This is the first in a series of articles on technology economics.
More than a decade ago, writer Nicholas Carr caused a stir with a Harvard Business Review article titled “IT Doesn’t Matter.” He argued that as costs fall for infrastructural technologies such as computers and the internet, the technologies would—like railroads, electricity, and telephones—become widely available commodities. Once a technology is ubiquitous and available to all—neither scarce nor proprietary—it no longer confers a lasting competitive advantage.
Although we agree that factors such as commoditization can erode a product’s advantage over time, we take fundamental issue with the notion that companies cannot create lasting advantage from widely available technology. In this series of articles, we challenge the conventional wisdom that the powerful effects of technology aren’t visible in economic metrics. Our research shows precisely why technology matters to a company’s bottom line and exactly how it has impact. The use of proprietary metrics such as “technology intensity” to make the most of technology lies at the heart of creating what we call technology advantage.
Given the rapid emergence of disruptive products and business models and the transformative power of digital technologies on business and society, executives must become masters of the global “technology economy,” capable of detecting the economic impact of rapid technological change and able to respond with speed and foresight. In these articles, we explore the new metrics and consider the new ways that companies need to think in order to navigate the technology economy and approach the many investment decisions in which technology plays a role.
The Impact of the Technology Economy
Technology infuses even the measurement of the market economy. The composition of indexes such as the Dow Jones Industrial Average (DJIA) and the S&P 500 has changed. Industrial companies are being replaced by tech powerhouses like Apple, Google, and Amazon, whose stocks are valued much higher than those of many long-time industrial members. Apple, with its high market capitalization, accounts for such a large share of the DJIA, for example, that a hiccup in its quarterly earnings moves the entire index. Just 20 or 30 years ago, the performance of Caterpillar or GM (the latter no longer part of the DJIA) could have similarly shaken up the market.
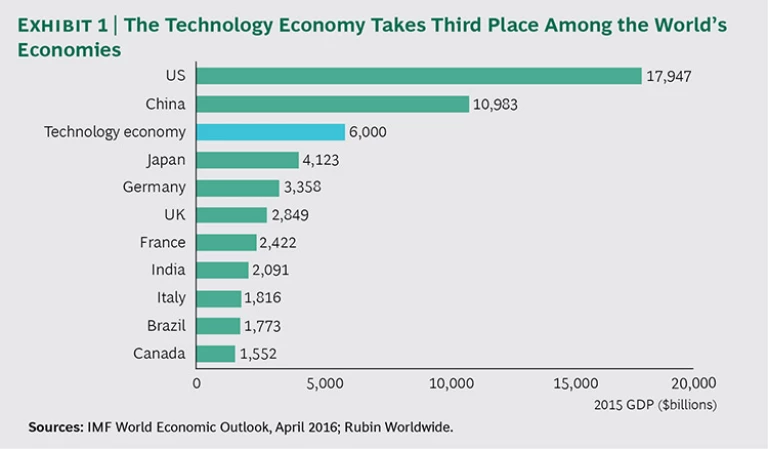
Furthermore, technology permeates companies. Worldwide corporate IT spending—an important barometer of the technology economy that focuses on corporate spending for hardware, software, data centers, networks, and staff, whether “internal” IT or outsourced services—is nearly $6 trillion per year. This amount is what it would cost to give a $500 smartphone and $350 tablet to each of the 7.1 billion people on Earth. If the global technology economy were a country and that spending its GDP, it would rank between the economies of China and Japan and would be more than twice the size of the UK economy. (See Exhibit 1.) Corporate technology spending grew by a factor of almost 20 from 1980 through 2015, while global GDP barely tripled.
Of course, the $6 trillion figure for corporate IT spending does not include all the money companies spend on technology. It does not account for spending on the sensors, processors, and other technologies embedded in everyday products, including cars, aircraft engines, appliances, and the smart grid; nor does it include spending on robotics, process automation, and mobile technologies. If we include such investments, our technology-spending estimate increases dramatically.
In this article, we focus on IT spending data as a proxy for the technology economy. This measure of technology spending, which highlights the complexities of looking at technology through an economic lens, is a critical element of a company’s overall digital transformation. (See “Simplifying IT to Accelerate Digital Transformation,” BCG article, April 2016.)
But what is all this spending doing for companies? Using technology intensity, we can shine a spotlight that reveals the economic impact of this massive amount of technology spending. The technology intensity calculation uses a patented formula to analyze technology spending relative to a company’s and an industry’s revenues and to their operating expenses. (See “A Better Way to Calculate the Impact of Technology.”)
A BETTER WAY TO CALCULATE THE IMPACT OF TECHNOLOGY
To calculate technology intensity, we use a patented formula that balances technology spending as a percentage of revenues with technology spending as a percentage of operating expenses. Technology intensity plots each of these figures on a right triangle, on which IT spending as a percentage of revenues is the base of the triangle and IT spending as a percentage of operating expenses is the vertical side of the triangle. The hypotenuse is technology intensity and is computed using the Pythagorean theorem: by taking the square root of the sum of the squares of IT as a percentage of revenues and IT as a percentage of operating expenses.
Although individually these two metrics are popular ways to benchmark the performance of the IT function, they are static measures of spending that just don’t stand on their own. The problem is with the denominator of each ratio. Revenues are unstable and not tightly coupled to technology spending over the short term. Operating expenses, or noninterest expenses, have similar problems. Technology spending doesn’t always or immediately lower operating expenses in the ways leaders hope.
Technology intensity offers a dynamic view that shows how these metrics interact and change over time. The relationship between the two ratios is like a seesaw. When a company is getting the balance right, revenues rise faster than its technology investment and the ratio of technology spending to revenues goes down. At the same time, if the company automates more operations, lowering labor costs and other expenses faster than technology expenses increase, the ratio of technology spending to operating expenses goes up.
In a healthy company, technology spending as a percentage of revenues decreases as investments both protect existing revenues and generate new revenue streams. Simultaneously, technology investment to reduce costs, avoid costs, and manage risk becomes a bigger component of operating expenses as automation increases.
In the past, business leaders tended to examine the two metrics in isolation. But that doesn’t give leaders the whole picture. Revenues don’t automatically rise when companies spend more on technology. And it’s not necessarily a bad thing if a company’s technology spending is high relative to operating expenses. However, if leaders compare technology spending simultaneously with revenues and operating expenses, as technology intensity does, several interesting relationships emerge.
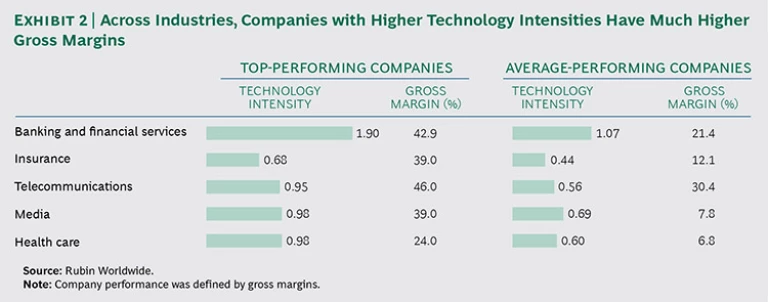
We have found that, across a range of industries, companies with high technology intensity have high gross margins. For instance, in the insurance sector, top-performing companies enjoy gross margins that are more than three times the margins of average performers and technology intensities that are more than 50% higher. In banking and financial services, companies with the highest gross margins have technology intensities and margins that are roughly double those of average performers. (See Exhibit 2.) This industry has seen extremely high levels of automation over the past five years—including technology systems that streamline processes, and advances in artificial intelligence that allow robots to answer clients’ questions and, eventually, to execute trades. Michael Rogers, the president of State Street, estimated in Bloomberg Markets that by 2020, automation will have replaced one in five of the company’s workers. A Citigroup report estimates that within a decade, 1.8 million employees in US and European banks could be out of jobs.
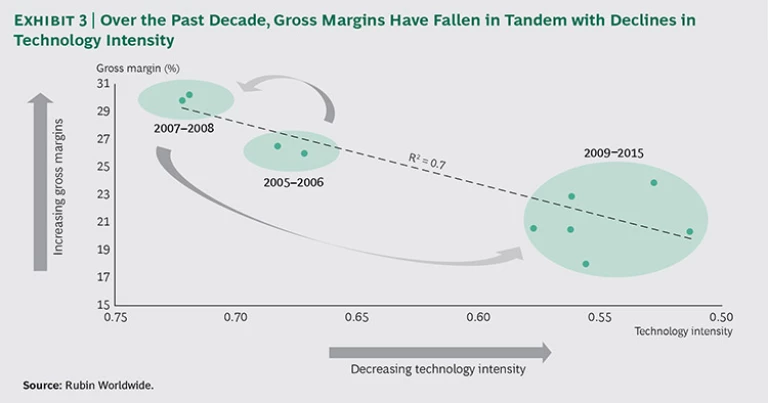
In fact, we see not just a connection between technology intensity and gross margins but also a strong correlation. That is, technology intensity and gross margins tend to rise and decline together. This effect was seen before and after the recent world economic crash. (See Exhibit 3.) In the run-up to the Great Recession that started in 2007, companies were investing more and more heavily in technology relative to revenues and operating expenses, and gross margins were rising. That trend accelerated through 2008 and until 2009, when companies belatedly realized the magnitude of what had happened and began to cut technology investment dramatically. After that, technology intensity dropped precipitously along with gross margins.
Other Measures of Success
Along with the technology intensity metric, companies can add other measures to their management dashboard, such as income per dollar of technology spending. (We define income as revenues minus operating expenses.)
For example, the energy industry produces the highest income per dollar of technology spending ($24.24). At the other end of the spectrum, the software publishing and internet services industry produces the lowest ($0.98). In both total technology spending and the technology spending required just to “keep the lights on,” we saw a similar rise until 2008, followed by a plunge in income per dollar of technology spending during the market collapse. Afterward, we saw what might be called the failure of recovery as a result of sluggish growth. Income per dollar of technology spending in 2014 and 2015 has basically flatlined, reaching only precrash levels.
Another measure that companies can use to connect the dots between the business and the IT function is the IT cost of goods. For example, in the US, the IT cost per day of a hotel bed is $2.50, and for a hospital bed, it is $65. The IT cost of a car is $323.
More than such individual measures, however, companies require different measures at different points in time. It is not enough simply to measure whether a project is on time and on budget. When companies are in the early stages of building new IT systems, leaders need progress measures to tell them whether a project is on track. For example, a bank may invest in automation and artificial intelligence in order to process loans better, cheaper, and faster. It needs metrics to understand how these projects are progressing.
Later on, a company may need deployment measures that determine whether the original business case is still valid. For example, while the bank is building its new system, it might shift a lot of work to the Philippines, cutting the cost of loan processing in half. With the new system, however, the context may change and the original plan may no longer make sense.
Finally, once a company has implemented a project, it needs realization measures that can discern whether the project has yielded the intended results.
These microeconomic metrics aren’t the only way to look at the impact of technology spending, of course. We can see how technology matters in a host of macroeconomic measures. In short, technology matters both to companies and to the larger economy, as we will explore in our next article.
Taking the Next Step
Top performers are different from average companies. Many top performers achieve higher margins by spending their technology dollars more efficiently and with greater focus than average companies.
Consider the case of a global financial services company that for years had prided itself on its low levels of technology spending. However, the company’s gross margins were the lowest in its industry. (Incidentally, its peers with higher margins had higher technology intensities.) The company turned things around by rebalancing its technology spending and increasing automation. It invested hundreds of millions of dollars in technology, funded by the lower operating expenses and greater revenues it gained through automation. Now, compared with its peers, it is the only company whose gross margins are increasing faster than its change in technology spending relative to revenues.
To support this kind of digital transformation, executives must define metrics such as technology intensity as KPIs for the organization and benchmark their performance relative to that of competitors and companies in adjacent industries. They must then incorporate new metrics into monthly management reports and dashboards and review the role and purpose of technology investments in the light of these measures. For their part, CIOs can embed KPIs into the business on the basis of metrics such as those outlined in this article, conducting regular reviews and supporting efforts to optimize performance. Finally, executives should develop even more sophisticated metrics that truly meas-ure the disruptions that technology fuels.
Adopting best practices in these areas will enable a new generation of executive-level “technology economists” not only to measure what really matters to company performance but also to thrive in the technology economy.
In the next article in this series, we consider why technology matters to the economy.


