
Micromobility holds great promise for the world’s traffic-choked cities, and not just as a way to rein in congestion and reduce greenhouse gas emissions. Many advocates see micromobility vehicles as an answer to the longstanding first- and last-mile transportation problem. But apart from traditional bikes, the electronically powered forms—e-bikes, e-scooters, and e-mopeds—haven’t yet moved beyond fad status in most places.
That is partly owing to the often hasty, uncoordinated rollouts of shared micromobility services. The parking-space shortages, conflicts with vehicular and pedestrian traffic, and safety risks that ensued—along with operational shortcomings, such as the logistics of charging huge numbers of batteries—drew criticism and, in some places, backlash. And while some of the initial drawbacks (longer battery life among them) have been or are being addressed, micromobility vehicles are still far from being fixtures of urban transportation systems worldwide.
So, what will it take to successfully integrate them? Certainly, more cooperation is needed among cities, operators, and public transit agencies. But even before considering those steps, it’s crucial for leaders to understand who uses micromobility, and why—and, just as important, what keeps people from using it. Users are not monolithic. Without segmenting them, decision makers are missing important differences in users’ practices and needs that have major implications on urban transportation planning decisions.
It’s crucial for leaders to understand why people use micromobility—and why they don’t.
BCG, in conjunction with the University of St. Gallen, recently conducted a major survey of more than 11,000 consumers across 23 cities in 10 countries. (See “About Our Survey.”) We explored the forms of micromobility currently in use and probed consumers’ habits, perceptions, and expectations. We looked at differences across regions and users by age bracket, income level, employment status, and other factors. What we found explained the mismatch we see today in many markets between micromobility goals and realities. In this article, we offer a preview of our findings, along with selected insights that can help cities advance micromobility and embed multimodal transportation into the urban mobility landscape.
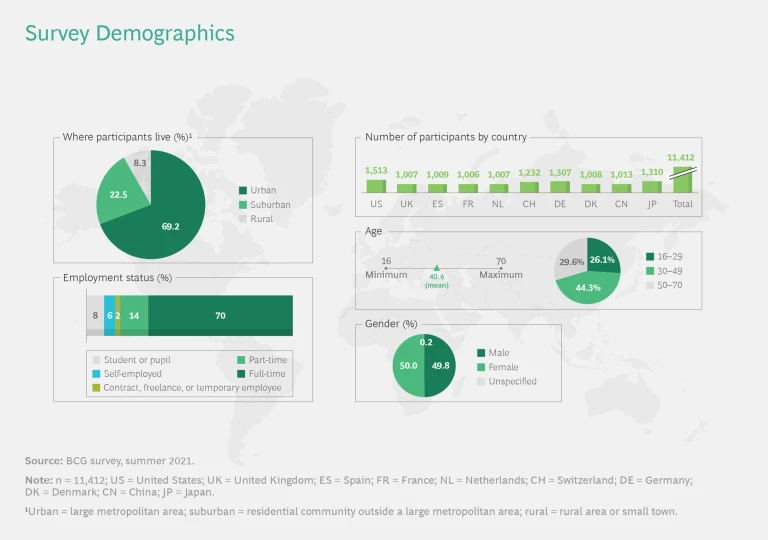
About Our Survey
Respondents were evenly divided by gender. The largest share, 44%, were ages 30–49, and more than 26% were ages 16–29. Our sample was a representative cross section, which provides a more accurate reading than any such survey based on operators’ customers. (See the exhibit.)
A Snapshot of the Global Micromobility Market
Exhibit 1 provides an overview of the 2021 global micromobility market, including growth rates, based on BCG’s micromobility market model. It shows market trends by vehicle and by usage model: whether ownership, subscription (in which the individual rents the vehicle for a specific period and is the sole user), or sharing (use of a provider’s vehicle for a single ride).
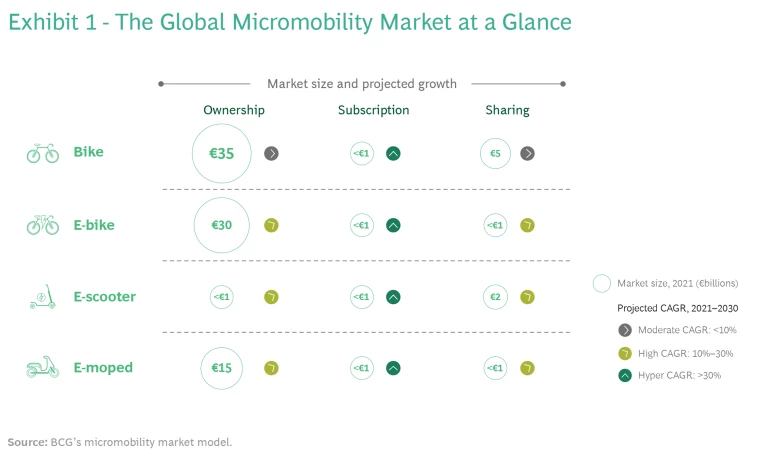
Traditional bike ownership is far and away the biggest market by volume, valued at €35 billion worldwide. Subscription volumes across all micromobility modes are under €1 billion, although they are growing at different rates. In the shared-vehicle market, bikes and e-scooters command the biggest volume, at €5 billion and €2 billion, respectively.
Across all types of vehicles, subscriptions are the fastest-growing segments in the micromobility market, with CAGR projected to exceed 30% over the next decade. (Their rapid growth isn’t surprising, given they are starting from a low baseline.) In the sharing segments, all modes except bikes are expected to have 10% to 30% CAGR over the next decade. The same holds true for ownership segments (the largest group by volume): traditional bikes, the world’s biggest market, will grow modestly, while all other modes will likely experience CAGRs of 10% to 30%. Overall, these numbers demonstrate that usership (sharing and subscription models) is growing increasingly attractive to consumers.
Regionally, there are marked differences in growth by vehicle. For one thing, micromobility as a general transportation mode has a different starting point in each broad region, country, and even city. There are considerable differences in what is available as well as in usage: In Asia, for instance, e-mopeds are quite popular, as e-scooters are in Europe and the US. Throughout Europe, traditional bikes and e-bikes are quite common. In the US, which is undergoing a micromobility boom, traditional bikes are enjoying a revival, as e-bikes gain in popularity.
Consumer Practices and Expectations
We asked consumers what forms of micromobility they use, how often they use them, and for what purposes; and what modes of transportation they replace. We also asked them how they anticipate using micromobility in the future.
More than 30% of all respondents use a bike several times a week, if not daily. Another 20% use one several times a month. Young people (ages 16–29) and middle-aged people (ages 30–49) are the biggest users of micromobility in city centers, and young males are the biggest users of e-scooters and e-mopeds.
Socioeconomic differences affect micromobility adoption. Socioeconomics and cultural attitudes also play a role in micromobility adoption. As income rises, so does micromobility use, across all modes. The differences in use among low-, medium-, and high-income residents are most pronounced with e-scooters and e-mopeds. In fact, we find that affluent young people are big users of micromobility (often for transportation when public transportation is infrequent or not running).
Cultural differences can discourage micromobility use.
Lower-income residents are typically less inclined to use micromobility, and not always because of cost. Cultural differences can discourage use, as well. In some cities, the reason is simply lack of availability. Providers of shared transportation modes stick to serving city centers where they can count on high usage and where serving densely populated neighborhoods is more economically efficient. However, recognizing that the benefits of micromobility can be outsized for lower-income residents (by expanding access to jobs, education, and services), some city governments are now making service to areas beyond the downtown a precondition for submitting tenders. In addition, a growing number of operators are expanding service to midsize cities, which will also make micromobility available to more people. Municipal leaders and operators need to consider all relevant factors in order to attract a broader segment of the population to micromobility.
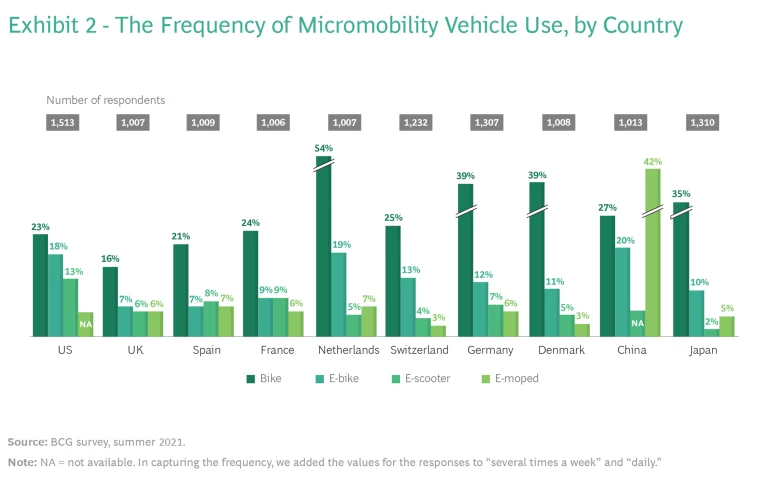
Exhibit 2 shows the frequency of use (from several times a week to daily) for the four key modes throughout the ten countries we surveyed. Not surprisingly, given its long history, the bike is still, by far, the dominant form among city dwellers. In China, its use is eclipsed only by the e-moped. Just as unsurprising, the Netherlands, Denmark, and Germany are leaders in bike use. In overall micromobility use, city dwellers in China use all modes more often than their counterparts in any other country. France leads the European countries in e-scooter use, most likely because it was an early proving ground for scooters. Country to country, there are big variations in usage—both in type and frequency.
Recently, consumer perceptions have shifted. During the COVID-19 pandemic, people saw micromobility as a safer alternative to public transit. Now, amid escalating fuel prices, people see micromobility as a more affordable alternative to public transportation or private motor vehicles. In general, a growing desire to practice sustainability has helped more people consider micromobility vehicle use.
Why do people use micromobility? Among all current users we surveyed, 42% use micromobility for leisure activities. Commuting and errand running are the next most common uses, accounting for 39% and 36% of all respondents, respectively (although among city dwellers, a slightly greater percentage, 41%, use a micromobility vehicle to commute).
How often do people substitute micromobility vehicles for other transportation modes? The most frequent substitution occurs for private car use: 32% of users employ some form of micromobility “often or very often” instead of a private car. (See Exhibit 3.) When we look at the broader comparison, the picture looks somewhat discouraging. Consider that 55% substitute a micromobility vehicle for walking (31%) or public transportation (24%) often or very often, while 40% substitute a micromobility vehicle for a private car (32%) or taxi or ride hailing (8%) often or very often. Essentially, the impact of micromobility use today is at best neutral. There are not only insufficient replacements for private car use, but more of the substitution is taking place with the two greenest mobility modes, walking and public transit.
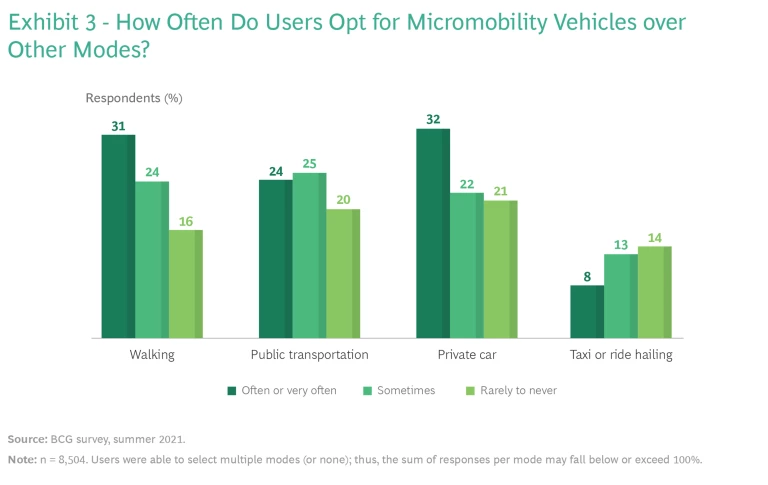
As for their choice of micromobility vehicles, residents use bikes (traditional and e-bikes) instead of walking and public transportation, and to a lesser extent, private cars. E-scooters replace three main traditional modes—public transportation, private car, and walking—fairly evenly.
How do people expect their micromobility usage to change postpandemic? During the pandemic, travel, including travel within cities, declined. But since then, travel of all types—both daily and weekly leisure trips, as well as daily commuting—remains, on average, 10% lower than pre-pandemic. This is mainly owing to the rise of remote work and changing consumer preferences. The pandemic, however, sparked micromobility use. We expect use to increase (also as a result of rising energy prices), but the patterns will differ, by region and by mode. Slightly more than one-quarter of respondents expect to take more micromobility rides for fun and leisure activities, and roughly one-quarter expect to do so to see friends or explore the city. Only one in five plan to use micromobility more for commuting to work, a proportion far too slim for the growth rates operators need to become profitable.
What Triggers—and Inhibits—Micromobility Use?
Those who opt to ride a bike, e-bike, e-moped, or e-scooter do so for many reasons. By the same token, those who abstain do so for many reasons.
The Spurs. Beyond convenience and cost, users appreciate that, among other things, micromobility benefits the environment while also suiting their lifestyle. Indeed, the top six reasons people choose micromobility were of almost equal importance: flexibility, reliability, price, the weather (when it is pleasant), safety, and the opportunity to save time by reducing travel time. (See Exhibit 4.)
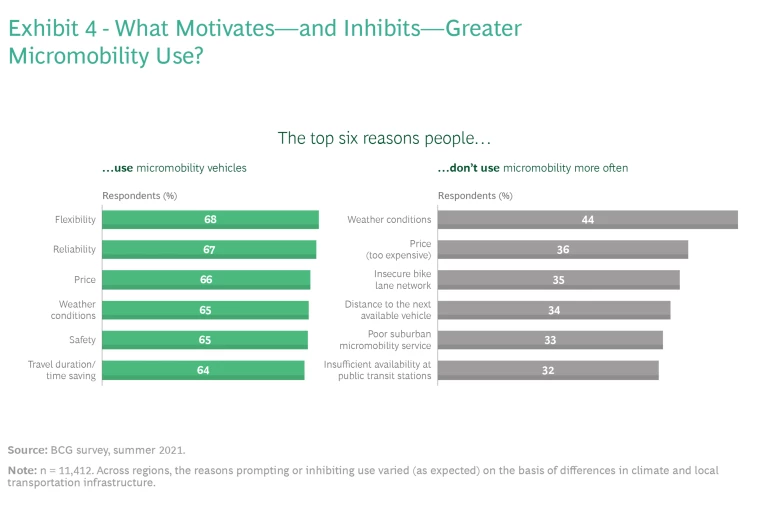
From country to country, the drivers differ. Respondents from China claim that flexibility, reliability, safety, and trip duration prompt them to use micromobility. In Switzerland, users especially value flexibility. In Denmark, price is relatively insignificant.
The Barriers. Across all ten countries we surveyed, the biggest impediment to micromobility use was by far bad weather (44% of respondents)—clearly an issue that providers ought to consider in their rollout plans. The other main impediments—high cost, insecure bike lane network, and so on—were nearly equal in importance, with between 32% and 36% of respondents, as Exhibit 4 shows.
Consumers’ Willingness to Pay for Bundled Tickets. While qualitative reasons matter, price is, for most people, the key deciding factor in their transportation choices. So, to better understand what people are willing to spend, we created two scenarios, each featuring a different bundled option that would be cheaper than buying the component tickets separately. We then asked respondents to estimate how much the average public transportation user would be willing to pay for each option. The exhibit breaks down the willingness to pay into four levels of increase (along with no increase), and also shows a weighted average increase that respondents believe the public would be willing to pay. (See Exhibit 5.)
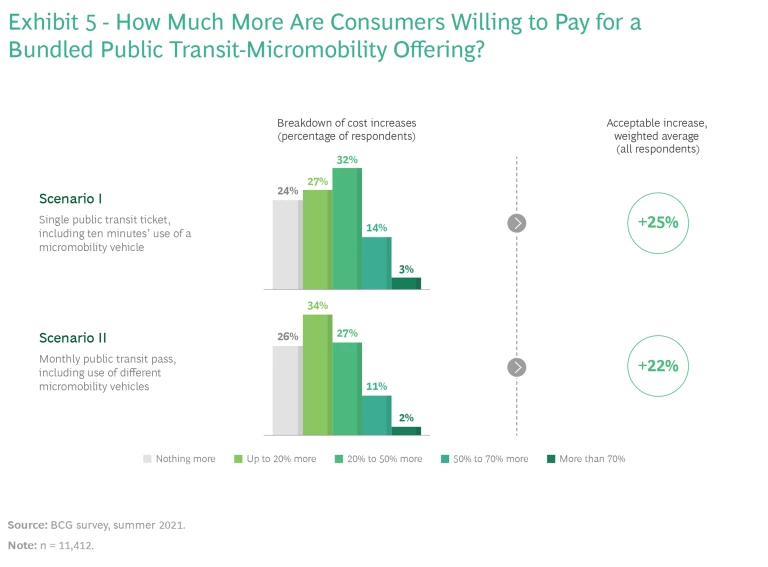
Scenario I features a single public transit ticket that also includes 10 minutes’ use of a micromobility vehicle. On average, respondents estimated that most users would be willing to pay 25% more than the current cost of a public transit ride. When translated into euros, this would mean that in Germany, for instance, where a ticket today on average costs €3, people would be willing to pay €3.75 for the bundle—a price below the current market price for most shared micromobility rides in Germany.
Scenario II consists of a monthly public transit pass that includes the use of different micromobility vehicles. (For simplicity’s sake, we didn’t set a limit on the number of rides per day; clearly, limits would be necessary and would vary, based on local economics.) Respondents believed that most users would be willing to pay 22% more for such a bundle.
The relatively high percentage increases in Scenarios I and II show not only that there is an appetite for integrated micromobility offerings within public transportation, but also that people are willing to pay up for them. Public transit and micromobility operators ought to take this as a strong cue: to attract more riders (commuters in particular), they need to offer bundled tickets that are priced attractively. And, if necessary, they should use subsidies to do so, as governments do to promote the use of other types of vehicles.
Taking Action: Integrating Micromobility into Public Transportation
In most cases, substituting a car ride with a micromobility mode benefits the environment and quality of life. However, from a sustainability perspective, micromobility can have a mixed effect. When electrically powered micromobility modes replace walking, transportation emissions rise—not just during operation, but throughout the entire product lifecycle, from procurement and manufacture to distribution, sale, and disposal. And, although public transit vehicles (notably buses) create emissions in some lifecycle stages, several of their impacts are offset by the vehicles’ relatively longer asset life and the fact that the investment is independent of the number of actual users. They operate no matter what: the more users, the greener they become.
Indeed, at scale, not all micromobility modes deliver equal benefit, so promoting micromobility without considering the totality of impacts can have a negative impact on the environment. If the goal is reducing motor vehicle use, walking and public transit should be the most incentivized options. Clearly, what’s good for Amsterdam may not be good for Atlanta, so the local environment and other conditions need to be factored in to leaders’ thinking.
At scale, micromobility modes don’t all deliver equal benefit to the environment.
Choice counts. Cities need to take an intermodal approach to transportation—one that offers users different types of vehicles to take them from departure point to destination as seamlessly as possible. With a single ticket for the train, subway, and e-scooter, for instance, riders should be able to enjoy the full advantage of the extensive network and fast connections of their city’s public transportation, along with the flexibility and accessibility of micromobility. But achieving this is predicated on having an adequate micromobility infrastructure. Unfortunately, today many cities fall short, and too many accidents between motor vehicles and micromobility vehicles occur. Indeed, the lack of bike lanes and bike infrastructure is one of the main impediments to micromobility usage.
Nearly one-third of our survey respondents already combine bike use with public transportation several times a week, if not daily. Micromobility use is farther along in places that have been more proactive about integrating it into the urban transportation mix, whether through regulatory frameworks (such as Paris’s “15-minute city,” which mandates bike lanes on every street and reduces on-street parking space) or infrastructure improvements like the Netherlands’ bike lane design (well marked for safety) and parking amenities. The more micromobility-friendly infrastructure, the greater the use.
What will it take to foster integrated, multimodal transportation systems?
For Cities, Putting the User First. Until cities can offer a compelling door-to-door solution to a bigger share of residents, their micromobility initiatives won’t amount to much. Leaders need to consider transportation from the users’ perspective—that is, the perspective of the many different key groups of residents (commuters in particular)—in everything from pricing to connections to vehicle supply. Some cities are already making service to disadvantaged neighborhoods and suburbs a precondition for participating in the tender process.
What will truly move the needle is integrated offerings.
For Cities and Micromobility Operators, a Joint Effort to Integrate Offerings. What will truly move the needle is integrated offerings. Cities need a digital platform that goes beyond general information or reservations and handles intermodal transportation and multimodal offerings. Users need to be able to book public transportation and micromobility services in combination. Working with micromobility operators, cities can develop a shared pricing strategy, concur on infrastructure needs (including parking and pickup space), and help them provide users with easy access to vehicles.
For Cities and Public Transit Operators, a Focus on Infrastructure. Cities need to shift from their car-dominant mindset and reallocate road and parking space for micromobility, as Paris and New York, for example, have already started doing. Cities might also partner with suburban and rural communities to provide free, secure bike storage for commuters—an offering too uneconomical for micromobility operators to provide. The city of Utrecht in the Netherlands is home to the world’s largest multistory parking facility, which holds 12,500 bikes. Consumers value reliability, flexibility, short trips, and safety, all of which argue for public transportation improvements.
For Micromobility Operators, Enhancing Operations and Creating Compelling Offerings. One obvious area of improvement for operators is targeting new user groups, such as commuters, and catering to their particular needs, such as providing coverage in needed areas. As the market continues to consolidate, operators need to keep refining their economics in order to offer more attractive prices and forge long-term partnerships with cities. This includes making design and engineering improvements that boost durability and operational efficiency, increasing battery size, and pursuing product innovations that extend vehicle life. Operators need to broaden their offering and price attractively to appeal to a broader user base. They should also consider ways to encourage use in different weather conditions—for example, by designing winter-proof vehicles or road infrastructure and offering incentives like price reductions or loyalty programs.
Integrating micromobility into urban public transportation systems is one of the most promising ways that cities can limit traffic congestion, emissions, and the other associated ills of uncontrolled car use. Advancing this goal takes a joint effort among cities, public transit systems, and micromobility operators. The headway some cities have already made is proof positive that a proactive, collaborative effort can yield major results.
The differences among cities—in their physical landscapes as well as their culture and demographics—tell us that we should listen to local users. By observing their different practices, needs, and expectations, and understanding their points of resistance, city leaders and their transportation partners will be able to make more informed design decisions that will benefit a greater portion of the population and ultimately advance their goals.
Thanks to a growing eco-consciousness and rising fuel prices, more and more consumers are willing to rethink alternative modes of transportation. Now is a more than opportune moment to move micromobility forward, and make it a central element in the urban mobility revolution.


