For the better part of three decades, a rough, bifurcated conception of the world has driven corporate manufacturing investment and sourcing decisions. Latin America, Eastern Europe, and most of Asia have been viewed as low-cost regions. The U.S., Western Europe, and Japan have been viewed as having high costs.
But this worldview now appears to be out of date. Years of steady change in wages, productivity, energy costs, currency values, and other factors are quietly but dramatically redrawing the map of global manufacturing cost competitiveness. The new map increasingly resembles a quilt-work pattern of low-cost economies, high-cost economies, and many that fall in between, spanning all regions.
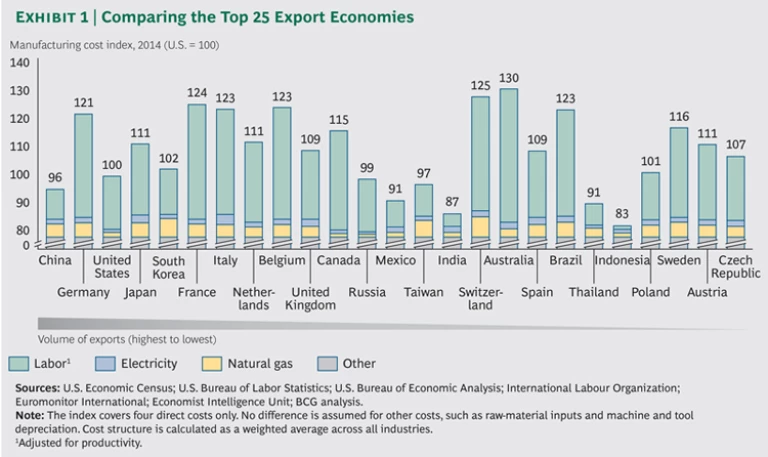
In some cases, the shifts in relative costs are startling. Who would have thought a decade ago that Brazil would now be one of the highest-cost countries for manufacturing—or that Mexico could be cheaper than China? While London remains one of the priciest places in the world to live and visit, the UK has become the lowest-cost manufacturer in Western Europe. Costs in Russia and much of Eastern Europe have risen to near parity with the U.S. (See Exhibit 1.)
To understand the shifting economics of global manufacturing, The Boston Consulting Group analyzed manufacturing costs for the world’s 25 leading exporting economies along four key dimensions: manufacturing wages, labor productivity, energy costs, and exchange rates. These 25 economies account for nearly 90 percent of global exports of manufactured goods.
The new BCG Global Manufacturing Cost-Competitiveness Index has revealed shifts in relative costs that should drive many companies to rethink decades-old assumptions about sourcing strategies and where to build future production capacity. To identify and compare the shifts in relative costs, we analyzed data in 2004 and 2014. The evaluation is part of a series of findings from our ongoing research into the shifting economics of global manufacturing.
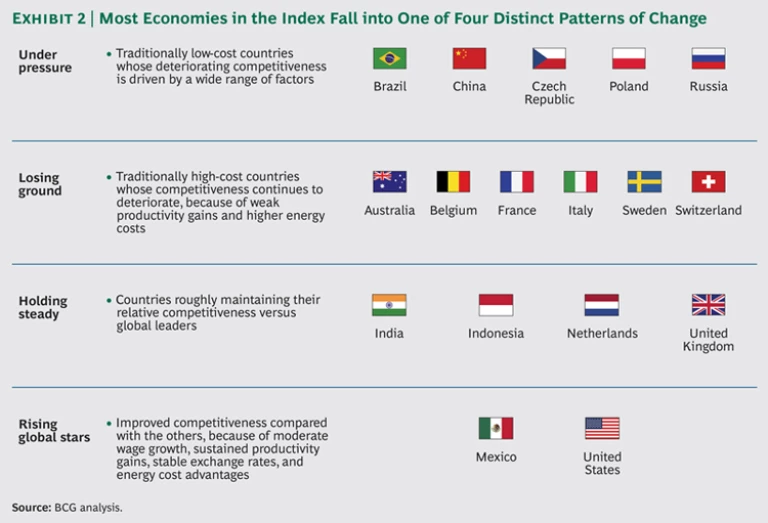
In developing the index, we observed that cost competitiveness has improved for several countries and become relatively less attractive for others. Within the index, we identified four distinct patterns of change in manufacturing cost competitiveness. (See Exhibit 2.) They include the following:
- Under Pressure. Several economies that traditionally have been regarded as low-cost manufacturing bases appear to be under pressure as a result of a combination of factors that have significantly eroded their cost advantages since 2004. For example, at the factory gate, China’s estimated manufacturing-cost advantage over the U.S. has shrunk to less than 5 percent. Brazil is now estimated to be more expensive than much of Western Europe. Poland, the Czech Republic, and Russia have also seen their cost competitiveness deteriorate on a relative basis. They are now estimated to be at near parity with the U.S. and only a few percentage points cheaper than the UK and Spain.
- Losing Ground. Several traditional high-cost countries that were already relatively expensive a decade ago have lost additional ground, resulting in 16 to 30 percent cost gaps relative to the U.S. This is largely because of weak productivity growth and rising energy costs. The countries losing ground include Australia, Belgium, France, Italy, Sweden, and Switzerland.
- Holding Steady. From 2004 to 2014, the manufacturing cost competitiveness of a handful of countries held steady relative to the U.S. Rapid productivity growth and depreciating currencies have helped keep costs in check in economies such as India and Indonesia—even as wages have grown quickly. In contrast to the dynamic changes in India and Indonesia, the Netherlands and the UK have seen relative stability across all the cost drivers we examined. The performance of these four countries has positioned them as potential future leaders in each of their respective regions.
- Rising Global Stars. Cost structures in Mexico and the U.S. improved more than in all of the other 25 largest exporting economies. Because of low wage growth, sustained productivity gains, stable exchange rates, and a big energy-cost advantage, these two nations are the current rising stars of global manufacturing. We estimate that Mexico now has lower average manufacturing costs than China on a unit-cost basis. And except for China and South Korea, the rest of the world’s top-ten goods exporters are 10 to 25 percent more expensive than the U.S.
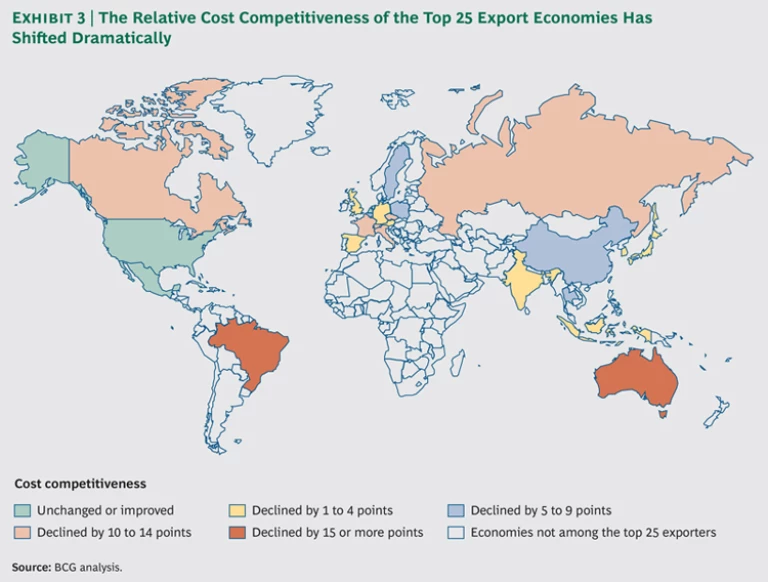
These dramatic changes in relative costs could drive a large shift in the global economy as companies are prompted to reassess their manufacturing footprints. (See Exhibit 3.) One implication is that global manufacturing could become increasingly regional. Because relatively low-cost manufacturing centers exist in all regions of the world, more goods consumed in Asia, Europe, and the Americas will be made closer to home. These trends also have implications for governments, whose leaders increasingly recognize the economic importance of a stable manufacturing base. We hope that this report will encourage policy makers in developed and developing economies alike to identify growing areas of strength and weakness and take action to shore up their manufacturing competitiveness.
Forces That Are Redrawing the Competitivess Map
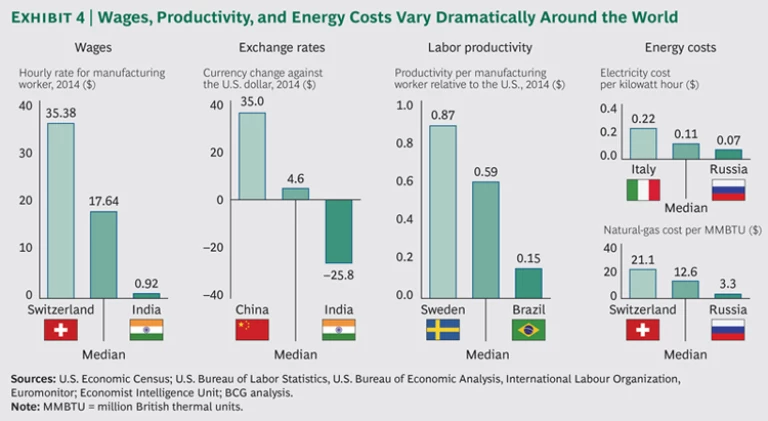
Four factors are most responsible for the dramatic shifts in manufacturing competitiveness from 2004 to 2014. (See Exhibit 4.) The factors are now blurring the traditional boundaries between low-cost and high-cost regions.
- Wages. The range of hourly pay differentials for manufacturing workers remains enormous. But rapidly rising wages have significantly eroded the competitive advantage of a number of major exporters. Although manufacturing wages rose in all 25 countries from 2004 to 2014, nations such as China and Russia have experienced more than a decade of annual increases ranging from 10 to 20 percent. In other economies, wages have only risen by 2 to 3 percent per year.
- Exchange Rates. Changing currency values can make an economy’s exports either more expensive or cheaper in international markets. Currency shifts from 2004 to 2014 have ranged from a nearly 26 percent devaluation of the Indian rupee against the U.S. dollar to a 35 percent increase in the Chinese yuan.
- Labor Productivity. Gains in output per manufacturing worker—or productivity—have varied widely around the world from 2004 to 2014 and explain some of the biggest shifts in total manufacturing costs. Manufacturing productivity rose by more than 50 percent in countries such as Mexico, India, and South Korea from 2004 to 2014 but shrank in others, such as in Italy and Japan. Some economies with low wage rates are not particularly competitive in terms of unit labor costs when wages are adjusted for productivity.
- Energy Costs. Prices for natural gas have fallen by 25 to 35 percent since 2004 in North America because of large-scale production of shale gas resources. In contrast, they have risen by 100 to 200 percent in economies such as Poland, Russia, South Korea, and Thailand. This has had a significant impact on the chemicals industry, which uses natural gas as a feedstock for production. Likewise, the industrial price of electricity has risen sharply in manufacturing economies such as Australia, Brazil, and Spain. As a result, overall energy costs in many countries outside of North America are between 50 to 200 percent higher than they were in 2004. This has caused major changes in competitiveness in energy-dependent industries.
To compare cost shifts in each of these four dimensions from 2004 to 2014 for the world’s 25 leading exporters of manufactured goods, we used the U.S. as the baseline. We aggregated scores for the four dimensions into an overall manufacturing-cost-competitiveness score for each economy in relation to the U.S. The score for the U.S. remains 100. If an economy has a score of 110 in our Manufacturing Cost-Competitiveness Index, its average manufacturing costs are 10 percent higher than in the U.S.
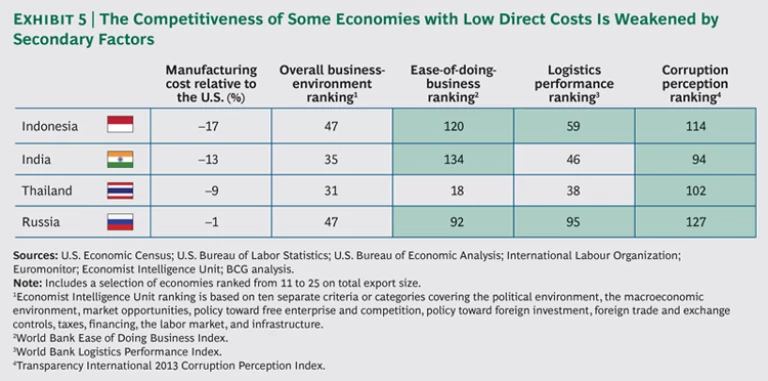
Of course, factors other than wage rates, productivity, exchange rates, and energy costs also weigh heavily on corporate decisions about where to focus supply chains. Logistics costs, the overall ease of doing business, and the presence of corruption—among other issues—can affect the attractiveness of potential locations. In our research, we have found that manufacturing growth in a number of countries that have very attractive direct costs is stunted because of weaknesses in these areas. (See Exhibit 5.) These factors are local in nature—and can vary widely in different locations even within countries. Therefore, we have not modeled them into our cost index. Wise manufacturers, however, must account for these factors when they make decisions.
Four Diverging Paths
Adecade of volatile changes in exchange rates and labor and energy costs has resulted in striking shifts in relative manufacturing-cost structures among the top 25 export economies. Manufacturing competitiveness—once concentrated in a few regions—is now truly global. There has also been a dramatic reordering of cost competitiveness among specific countries around the world.
As we dug more deeply into these macroeconomic trends, we identified four common patterns that describe cost shifts occurring in the majority of the economies in our index. We grouped these economies into categories that we describe as under pressure,losing ground, holding steady, and rising global stars.
Under Pressure
Five countries that have traditionally been regarded as low-cost manufacturing bases have seen their competitive edge erode significantly from 2004 to 2014: Brazil, China, the Czech Republic, Poland, and Russia. In several of these countries, average manufacturing costs are now estimated to be higher than those of the U.S. Brazil experienced the most dramatic swing: its average costs were around 3 percent lower than in the U.S. in 2004 and are estimated to be 23 percent higher in 2014. In 2004, average costs in Poland and Russia were estimated to be 6 percent and 13 percent cheaper, respectively, than in the U.S. Now they are both roughly at parity. Costs in the Czech Republic were around 3 percent lower than in the U.S. in 2004 but are now an estimated 7 percent higher than in the U.S. China’s estimated manufacturing-cost advantage over the U.S. has shrunk from 14 percent to just 4 percent over that period.
The key factors driving these changes vary widely by economy. Skyrocketing labor and energy costs have eroded the competitiveness of China and Russia. A decade ago, for example, manufacturing wages adjusted for productivity averaged an estimated $4.35 an hour in China and $6.76 in Russia, compared with $17.54 in the U.S. Again, adjusted for productivity differences, labor costs have roughly tripled in both countries, to an estimated $12.47 an hour in China and $21.90 in Russia. Average productivity-adjusted manufacturing labor costs in the U.S. have risen by only 27 percent since 2004, to $22.32. The cost of industrial electricity increased by an estimated 66 percent in China and 78 percent in Russia, while the cost of natural gas soared by an estimated 138 percent in China and 202 percent in Russia from 2004 to 2014. (See Exhibit 6.)
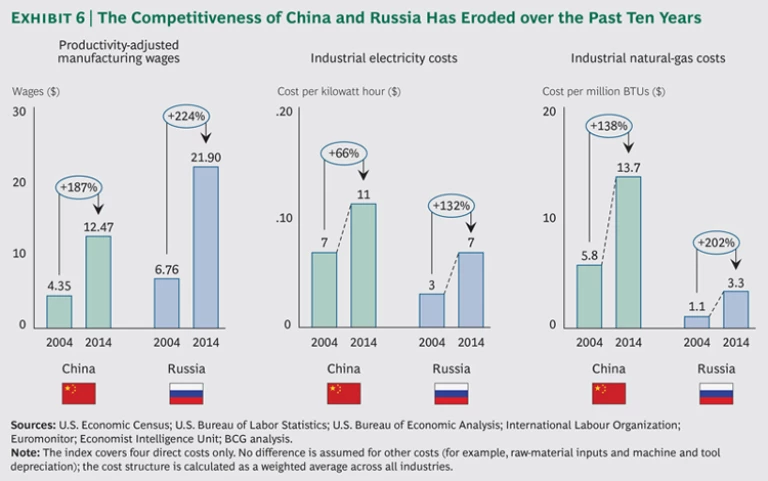
The erosion of Russia’s energy-cost advantage may seem surprising. Russia is a major exporter of natural gas and oil, and domestic manufacturers pay around 30 percent less for gas than industrial customers in the U.S. But Russian gas prices have risen sharply compared with those in the U.S. Why? The dramatic increase of the production of shale gas has caused U.S. prices to drop sharply. Russia still relies on conventional natural gas, which has become more expensive. So even though Russian manufacturers continue to enjoy the world’s lowest natural-gas costs for industrial manufacturers, the cost advantage over the U.S. has significantly narrowed. Russia’s manufacturing competitiveness is further weakened by factors that are not included in our cost index. In international indices, Russia ranks a low 92nd for ease of doing business, 95th for logistics performance, and 127th for the perception of corruption.
Brazil has lost ground across all dimensions. It should be noted that despite being regarded as a major emerging market, Brazil was not a significantly cheaper manufacturing destination than the U.S.—once productivity was factored in—even a decade ago. However, the situation has become worse. Higher wages combined with very weak productivity growth accounted for more than three-quarters of a 26 percentage-point manufacturing-cost increase compared with the U.S. from 2004 to 2014.
Brazilian factory wages have more than doubled in the past ten years. Higher incomes are typically a healthy sign of development. And the past decade was one of steady and stable economic growth that enabled millions of households to leap from poverty to the middle class. But rising wages were not offset by productivity gains. Indeed, total labor productivity improved by only 1 percent per year from 2004 to 2014—ranking Brazil 19th out of the 25 economies in our index on this dimension.
Previous BCG research has shown that Brazil’s high wage growth and weak productivity gains can largely be attributed to a shortage of talent, underinvestment, inadequate infrastructure, and an excessively complex and costly institutional framework for business. (See Brazil: Confronting the Productivity Challenge, BCG report, January 2013.) A doubling of industrial-electricity costs and a nearly 60 percent leap in natural-gas costs have also hurt competitiveness. Because of these factors, Brazil is tied with Italy and Belgium as the fourth least-cost-competitive manufacturing economy in our index, ahead of only Australia, Switzerland, and France.
Poland was the most cost-competitive economy in Europe a decade ago, and it remains well positioned compared with its neighbors. It has an estimated 20 percentage-point cost advantage over Germany, for example, although that has narrowed slightly from 23 points in 2004. But because of higher energy costs and rising wages, Poland has lost ground to some of the strongest global competitors. The country generated moderate productivity growth of approximately 38 percent from 2004 to 2014, but this benefit was largely offset by currency appreciation.
Losing Ground
Manufacturing costs in most of Western Europe were relatively high a decade ago, and cost competitiveness has weakened considerably in several countries. Average manufacturing costs in Belgium rose by an estimated 7 percent compared with those in the U.S. They rose by 8 percent in Sweden; 10 percent in France, Italy, and Switzerland; and 21 percent in Australia. (See Exhibit 7.)
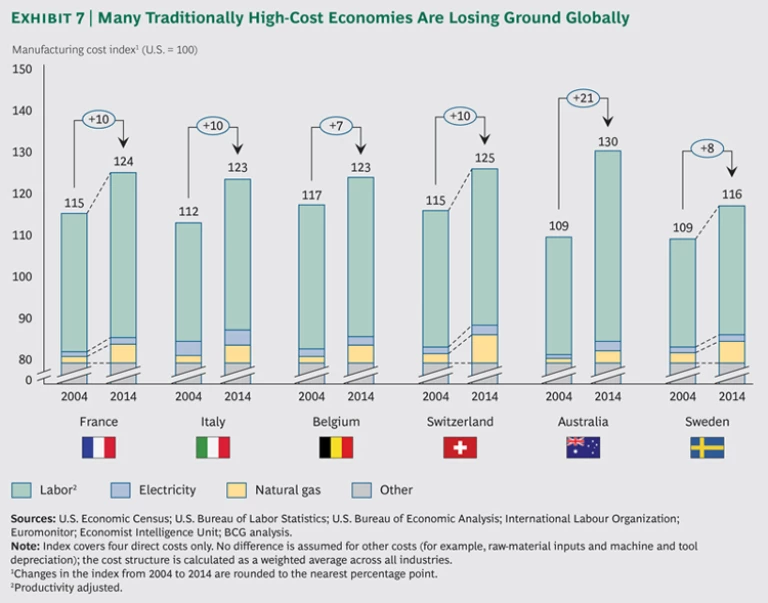
Rising energy costs, strong currencies, and weak productivity growth are the main culprits. Electricity costs have risen by an average of 59 percent in the six economies. Natural-gas costs have soared by an estimated 94 percent since 2004 on average. Wages in those countries losing ground rose by approximately 10 percent more than they did in the U.S., while productivity growth lagged that of the U.S. by an estimated 10 percent. In Australia, for example, wages rose by 48 percent from 2004 to 2014, and labor productivity remained virtually flat.
To get a sense of how dramatically productivity gains have lagged in some losing-ground countries, consider the following comparison. In South Korea, average output per manufacturing worker increased by nearly 56 percent from 2004 to 2014. In Italy, output per worker declined by more than 6 percent over that same period. Italy’s performance also is in stark contrast with that of neighboring Austria, where output per worker rose by around 24 percent since 2004. Even though Austria has the sixth-highest average factory wage of the 25 countries in our index, its relative cost competitiveness did not drop significantly over the past decade as productivity gains helped to offset other increases.
Relatively inflexible labor markets also contribute to the high productivity-adjusted labor costs in most losing-ground countries. France, another laggard in productivity, illustrates some of the challenges. From 2004 to 2014, this economy’s growth in output per worker was approximately 14 percent lower than that of the U.S. Part of the reason is that France has the most rigid work rules of any major exporting economy in our index. For example, the official workday is seven hours, employers must pay for 30 days of annual leave for workers, and night work is highly restricted.
Holding Steady
Four countries in our group of 25—representing both developing and developed economies—managed to sustain their cost competitiveness from 2004 to 2014, despite higher global energy costs. They are India, Indonesia, the Netherlands, and the UK. Overall costs in each nation changed by no more than 2 percent in either direction compared with the U.S.
These four nations have significantly increased their cost competitiveness within their regions. The direct-manufacturing cost structures of the UK and the Netherlands, for example, have improved against each of the other ten European economies in our index as well as against Russia. Likewise, India and Indonesia have improved their cost competitiveness compared with each of the five other Asia-Pacific economies. As such, we refer to the UK, the Netherlands, India, and Indonesia as “regional rising stars.”
The UK has emerged as the lowest-cost manufacturing economy of Western Europe, just ahead of Spain. The UK’s indexed competitiveness improved by an estimated 5 percentage points relative to Belgium, 6 points relative to Poland, 8 points relative to France, and 9 points relative to Switzerland. The UK’s flexible labor market, which makes it easier to adjust the size of the workforce when economic circumstances change, is a major competitive edge. (See “The UK: A Rising Regional Star.”) The UK, therefore, may be a more attractive proposition as a location for investment in new capacity.
In the Netherlands, productivity-adjusted labor costs fell from 2004 to 2014 relative to the U.S. That is because manufacturing wages rose by only around 1.7 percent annually during that period, while productivity grew by an estimated 2 percent annually. Natural gas and electricity for industrial users cost approximately 10 to 30 percent less in the Netherlands than in most of its European neighbors.
Manufacturing costs in India and Indonesia experienced more significant movement, rising in some dimensions but declining in others. Even though average manufacturing wages more than doubled in both countries over the past decade, these increases were offset by productivity gains and by currency devaluation. The Indian rupee declined by 26 percent against the U.S. dollar from 2004 to 2014, while the Indonesian rupiah fell by 20 percent. Energy costs increased relatively modestly. The price of natural gas rose by 5.2 percent annually from 2004 to 2014 in Indonesia and by 6.5 percent annually in India—substantially less than in other leading Asian manufacturing economies.
Both India and Indonesia could take better advantage of their low labor and energy costs to significantly increase exports of manufactured goods if they could improve in other areas that currently hinder their competitiveness. Even though Indonesia has the lowest direct cost structure of the world’s top 25 exporting countries, it earned the number 59 spot in logistics performance, 114 in corruption perception, and a lowly 120 in ease of doing business. In addition, Indonesia needs to improve its local supply base to reduce its reliance on imported materials, parts, and machinery. India’s low-cost advantage is significantly offset by its low rankings on logistics performance (46), corruption perception (94), and ease of doing business (134).
Rising Global Stars
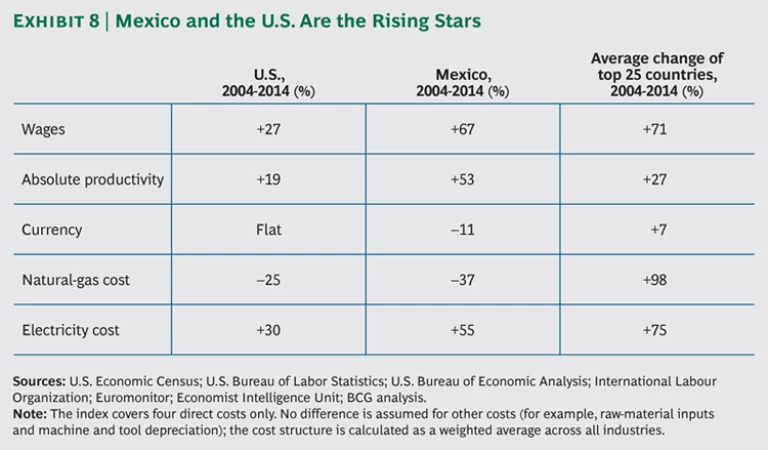
The manufacturing cost competitiveness of the U.S. and Mexico improved substantially over the past decade compared with all the other economies in our index. For these two rising global stars, productivity-adjusted wages and currency rates have remained stable or improved relative to the other countries. Both nations also have very competitive energy costs. (See Exhibit 8.)
Mexico has regained its status as a leading low-cost manufacturing base. The country enjoyed a surge of manufacturing investment and booming exports to the U.S. following the signing of the North American Free Trade Agreement in 1994. But a significant share of factory work went to China after that country entered the World Trade Organization in 2001. The pendulum is now starting to swing back.
The biggest factor is the cost of labor adjusted for productivity. In 2000, Mexican manufacturing labor was roughly twice as expensive as Chinese manufacturing labor. Since 2004, however, Chinese wages have nearly quintupled, and Mexican wages have risen by only 67 percent—less than 50 percent in dollar terms. And despite the fact that China has had higher productivity growth, the average Mexican productivity-adjusted labor costs are now estimated to be 13 percent lower than those of China. Add attractive electricity and natural-gas costs, and Mexico’s total costs are estimated to be 5 percent below those of China, 9 percent below those of the U.S., 10 percent below those of Poland, 11 percent below those of South Korea, and a full 25 percent below those of Brazil. (See “Mexico’s Manufacturing Cost Competitiveness: A Rising Global Star”)
The manufacturing-cost gap between the U.S. and other highly developed economies widened significantly from 2004 to 2014. Average U.S. costs are now estimated to be 9 percentage points lower than those of the UK, 11 points lower than in Japan, 21 points lower than in Germany, and 24 points lower than in France. Of the large developed-economy exporters, only South Korea—at roughly 2 percent higher costs—is close. Indeed, as discussed in previous BCG research, the U.S. has emerged as the lowest-cost manufacturing location of the developed world. (See The U.S. as One of the Developed World’s Lowest-Cost Manufacturers, BCG Focus, August 2013.) At the same time, the U.S. has achieved approximate cost parity with low-cost countries in Eastern Europe. The cost gap with China has shrunk dramatically and, if the trend of the last ten years continues, will disappear before the end of the decade.
Labor is one key to the growing U.S. competitive advantage. The U.S. has one of the developed world’s most flexible labor markets, ranking as the most favorable economy in terms of labor regulation among the top 25 manufacturing exporters. The U.S. also has by far the highest worker productivity among the world’s 25 biggest manufactured-goods exporters. Adjusted for productivity, U.S. labor costs are an estimated 20 to 54 percent lower than those of Western Europe and Japan for many products.
The big U.S. energy-cost advantage is a recent development. While industrial prices for natural gas have risen around the world, they have fallen in the U.S. by around 50 percent since 2005, when large-scale recovery from underground shale deposits began in earnest. Natural gas currently costs more than three times as much in China, France, and Germany than in the U.S.—and nearly four times as much in Japan. In addition to being an important feedstock for industries such as chemicals, low-priced shale gas has also helped keep electricity prices in the U.S. below those of most other major exporters. That translates into a sizable cost advantage for energy-intensive industries such as steel and glass. Natural gas accounts for only 2 percent of average U.S. manufacturing costs, and electricity represents just 1 percent. But in most other major goods-exporting countries, natural gas accounts for 5 to 8 percent of manufacturing costs and electricity for 2 to 5 percent.
Because of its vast reserves, U.S. prices are expected to remain within a range of $4 to $5 per thousand cubic feet for several decades. What’s more, because it will take time before other nations are able to begin large-scale recovery of shale gas or before the U.S. can export domestic supplies, the cost advantage will remain largely exclusive to North America for at least five to ten years.
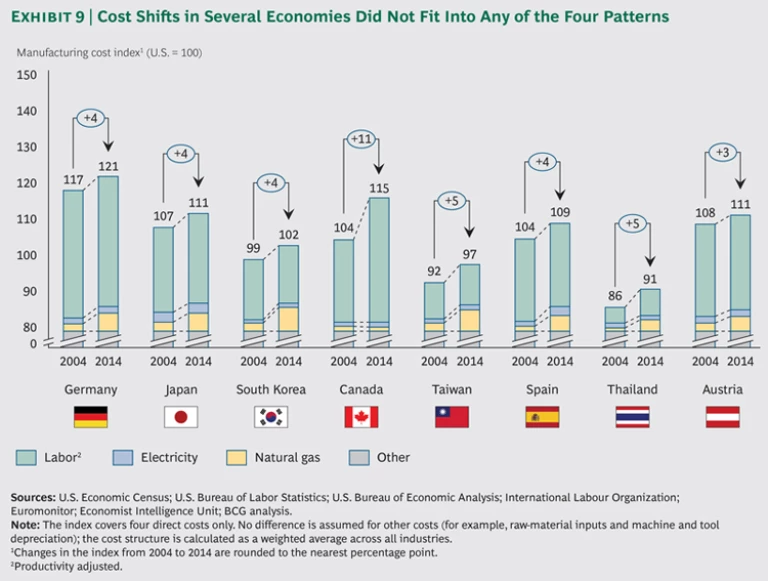
Several leading manufacturing export economies didn’t fit into our four categories because shifts in their cost structures didn’t follow one of the distinct patterns. (See Exhibit 9.) While Germany and Japan lost ground relative to economies such as the UK, the U.S., and the Netherlands, for example, they held steady or gained ground relative to China, Brazil, and many European economies. For South Korea and Taiwan, cost positions deteriorated compared with the U.S., India, and Indonesia, but these two economies gained significant ground on other emerging markets, such as China, Russia, Thailand, Poland, and the Czech Republic—and they gained a lot of ground relative to Brazil, Australia, and France. Although Canada lost 11 percentage points in cost competitiveness relative to the U.S. since 2004, it didn’t meet our criteria as a losing-ground economy because it has also benefited from declining natural-gas costs.
Adapting to Rapidly Shifting Cost Competitiveness
A worldview that neatly divided the globe into high-cost and low-cost manufacturing regions has served companies well for the past three or four decades. But as we have observed through the BCG Manufacturing Cost-Competitiveness Index, companies should view the world in a new light.
A decade ago, very few would have anticipated the dramatic and sustained shifts in wage and energy costs that have since taken place in the developed and developing worlds alike. However, in our rapidly changing global economy, there is reason to expect that volatility will continue and that relative cost competitiveness will remain dynamic. Neither companies nor policy makers can be complacent about their competitive position.
Economies that have already fallen behind in cost competitiveness need to take action now to keep their manufacturing bases from deteriorating further. Those that are well positioned cannot rest on their laurels.
There are profound implications for manufacturers with operations in all countries. They include the following:
- Enhance productivity. As once-enormous gaps between wages in developed and developing economies continue to shrink, improving the value added by each worker is becoming an increasingly important factor in manufacturing competitiveness across the globe. Conduct a fresh assessment across your manufacturing footprint of the potential cost benefits of greater automation and other measures that can significantly improve productivity.
- Account for the full costs. While direct costs such as labor and energy will continue to have a strong influence on decisions about where to manufacture, it is important to take full account of other factors. Logistics, obstacles to efficiently conducting business, and the hidden costs and risks of managing extended global supply chains, for example, can offset much of the savings from labor or favorable exchange rates. It is also crucial to take into account hidden cost advantages of operating shorter supply chains, such as speed to market, greater flexibility, and a better ability to customize products for specific markets.
- Consider the implications for the broader supply chain. Although direct costs may now be relatively cheaper in a given economy, companies must also consider their needs for components and materials. Reliable local suppliers may not yet be available to provide important inputs. In other cases, deconstructing the value chain could involve added logistics costs or unanticipated tariffs, duties, or other penalties. Companies will need to understand the implications of their network decisions from an end-to-end, supply-chain perspective to avoid any surprises.
- Promote better business environments. Maintain a dialogue with relevant regulators and policy makers in countries in which you manufacture. Actively encourage them to reduce barriers to business and to adopt measures that will improve global competitiveness, such as developing infrastructure and reducing corruption.
- Reevaluate your business model. To take full advantage of production in an economy, a one-size-fits-all model that uses the same processes and materials is unlikely to be optimal. Many companies should consider adjustments in their products or business models to better meet the needs of that manufacturing environment. It may make sense to use different materials that are locally available, for example, or to take advantage of new manufacturing technologies such as robotics and 3D printing when capital is cheaper than labor. Identifying and making such changes will allow companies to better meet the needs of the local market—often at a better cost position than if they use the same materials or processes that they use elsewhere.
- Realign the global footprint. It may be time to reassess your company’s global production and sourcing networks and align them with the shifting economics of global manufacturing. Map current and future demand for products in each region of the world and evaluate the optimal sources for goods and services on a global basis.
For many companies, the shifting economics of global manufacturing requires approaching the world with a fresh mind-set. Rather than seeing the globe in terms of low cost versus high cost, manufacturing investment and sourcing decisions should increasingly be based on a more current and sophisticated understanding of competitiveness within regions. Companies that build production capacity based on outdated concepts of cost competitiveness—and that fail to factor in scenarios for long-term trends—risk placing themselves at a serious disadvantage for two to three decades. The winners are likely to be companies that align their operations with the shifting economics of global manufacturing—and that build in the flexibility to shift gears as those economics continue to evolve.
Acknowledgments
This report would not have been possible without the efforts of Lee Talbert, Maria Rios, John Ranz, Matt Gamber, and Brian Quist of The Boston Consulting Group project team. The authors would also like to thank David Fondiller, Alexandra Corriveau, Madeleine Desmond, Beth Gillett, and Mike Petkewich for their guidance and interactions with the media and Pete Engardio for writing assistance.


