If there had been any doubt as to how quickly the global economic landscape—and the market perceptions of it—can change, it would have been erased by events during August and September 2015. Concerns about the Chinese economy and fretting over the next move by the U.S. Federal Reserve triggered massive global market volatility in stocks, commodity prices, and exchange rates. And that turmoil underscored a critical imperative: leaders of companies operating around the world need to move beyond old views and conventional wisdom as they set global strategies.
At the heart of many such strategies today remains a binary view that divides the world into “advanced” and “emerging” economies, with the former including wealthy nations and the latter encompassing less affluent, faster-growing countries. That mind-set has guided the setting of global strategies in corporate boardrooms, leading multinational companies to adopt emerging-market strategies for expanding beyond their traditional markets.
That binary view of the world economy is now hopelessly outdated, however. Colombia, Malaysia, Poland, and Turkey, for example, have as little—or less—in common with other so-called emerging countries such as Bangladesh and Kenya than they do with Germany or the U.S. Therefore, companies need to move beyond old labels and find new ways to set market priorities. And the answer is not just a matter of looking for new labels. Any approach needs to be dynamic and agile so that strategies can be altered when short- and long-term developments alter conditions within and across individual countries.
The evidence of a radically altered global landscape is everywhere. For one thing, the leading economic powerhouses today are not necessarily—as they used to be—high-income countries. This new paradox surrounding wealth and economic might stems from the robust growth rates posted by major low- and middle-income countries over the past 15 years. And the demand dynamics in these countries are quite different from those seen in high-income nations. In addition, in the aftermath of the global financial crisis, economic-growth momentum now varies widely across countries, and the differences do not conveniently align with the notions of emerging and advanced countries. Two of the four original BRIC (Brazil, Russia, India, and China) countries, for instance, have experienced a steep falloff in growth, and China—while still growing faster than most other countries—is facing heightened uncertainty in the midst of a rebalancing of its economy. Meanwhile, other emerging countries have significant—and much less recognized—potential for economic expansion.
Such developments have major implications for any company operating globally. Which markets are most relevant for a particular company? How can corporate leaders prioritize effectively amid such shifting dynamics?
To help answer such questions, we propose two approaches that can be useful as sorting tools. The first involves combining the lenses of economic size and growth momentum to identify countries—24 in our current analysis—that must be on the watch list of any corporation with global ambitions.
The second approach focuses on a country’s major categories of expenditure, which we call demand blocks. In those countries where personal consumption accounts for the dominant share of demand, for example, consumer goods companies are likely to find a lucrative market opportunity while industrial-goods makers will want to focus more on markets where investment is a major demand block.
These two approaches are designed to be the basic inputs for an active radar that helps identify important markets. They are only the first step in identifying priorities, providing the basis for more industry-specific analyses. The sorting criteria that make sense for a particular company may differ from those of other companies because they more specifically reflect, for example, that company’s products or services and its global positioning. And any sorting method is not intended to produce definitive answers once and for all. But the snapshots provided by our two approaches help identify underrated and overrated market opportunities and underscore why companies must abandon outdated mind-sets in reshaping their global strategies.
A Dramatically Altered Global Landscape
Has the global economy really changed that much over the past decade or two? The answer is yes. And the evidence can be found by examining three trends: the fading role of affluent countries, the paradox of economic might among less-than-affluent countries, and the diversity in growth across the global economic landscape.
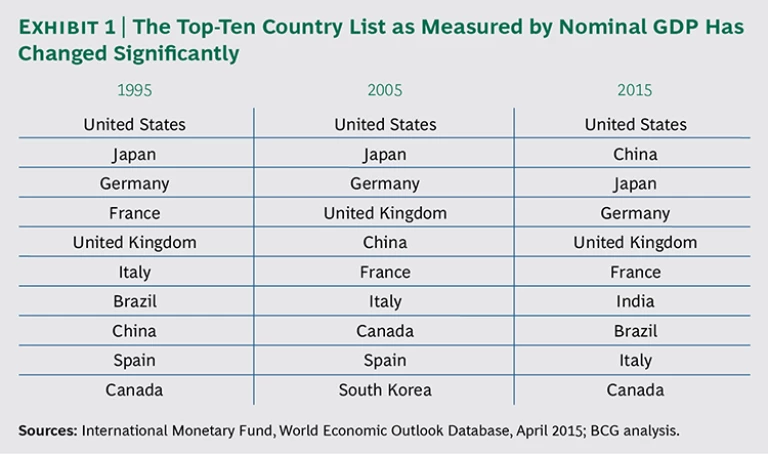
Affluent countries no longer exclusively dominate the global economy. Countries such as the U.S., Germany, and Japan continue to be economic powerhouses, but when we look at either economic size (measured by nominal GDP) or shares of global GDP growth, we can see that the role of affluent nations is clearly diminished. In 1995, the U.S., Japan, and Germany were the top three economies as measured by GDP. By 2015, China had rocketed to the number-two spot, and India—not even on the list in 1995—was ranked seventh. (See Exhibit 1.)
Dividing countries into three income bands to dig deeper into relative GDP performance illustrates the scope of change.
The higher threshold is $30,000 in annual GDP per capita. (For most of these countries, purchasing-power-parity and nominal terms produce similar numbers, so this corresponds to average monthly incomes greater than $2,500.)
Each of the resulting three income bands includes roughly the same number of countries. We call the countries whose annual GDP per capita is less than $10,000 incipient. We label those countries whose annual GDP per capita ranges from $10,000 to $30,000 midfield. Finally, affluent countries are those whose annual GDP per capita levels are greater than $30,000. Our analysis covers 152 countries, excluding only very small countries and countries in turmoil (where data is not available).
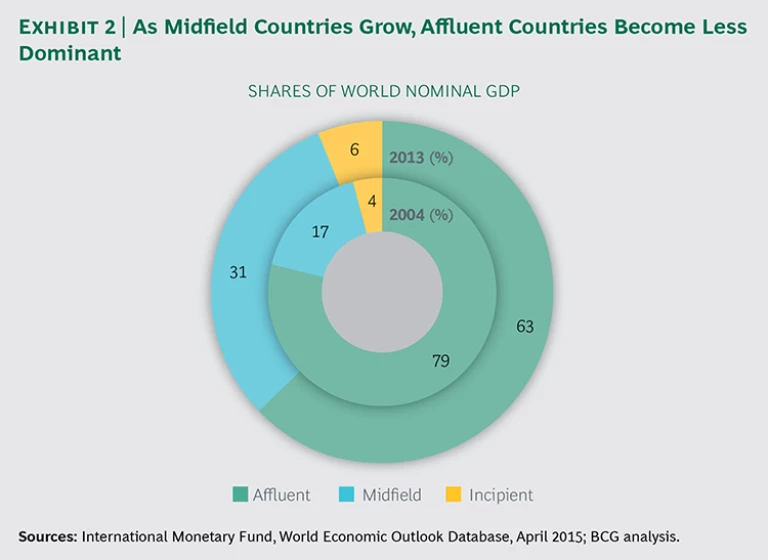
A 2013 snapshot of the countries within the three bands, by current share of GDP, still shows the economic predominance of affluent countries, but the picture differs greatly from that of a decade earlier. This is because nearly half of all the growth in the world economy from 2004 through 2013 was generated by midfield countries. The cumulative effect of the strength of the midfield countries is very significant: those economies nearly doubled their share of global GDP from 17 percent in 2004 to 31 percent in 2013. (See Exhibit 2.)
A new paradox is emerging. At the same time, the metrics for individual countries reveal another fundamental shift. At the end of the twentieth century, the leading global economic powers still were, for the most part, high-income countries. Today, however, several countries that are not wealthy in terms of per capita income are economic powerhouses. China’s economy, for example, is about 60 percent the size of that of the U.S., but Chinese per capita income is less than one-quarter that of the U.S. The economy of India, meanwhile, is nearly half the size of Japan’s, but Indian per capita income is only one-seventh that of Japan.
The combination of economic might and lower income levels in these countries results in demand dynamics that are quite different from those seen in higher-income nations. And this fact has major implications for many markets and for any company operating or aiming to expand globally.
Growth rates across the global economic landscape are increasingly diverse. Two popular notions over the past two decades were the idea of decoupling, meaning that low-income-country growth patterns were not tied to those of high-income countries, and the concept of a two-speed world in which the growth trajectories of developed and emerging economies diverged. These views, which stemmed in large part from the rapid growth of China, India, and other lower-income countries over the past two decades, helped drive global strategies for multinationals and cement the notion that an emerging-market strategy was needed.
But such patterns no longer hold true. Virtually all affluent and midfield countries, for example, were significantly affected by the global crisis that began in 2008, with only incipient economies emerging relatively unscathed. That fact undermines the notion of decoupling.
Even more important, within each of the income groups, there was significant diversity in terms of both recovery from the crisis and performance subsequent to the crisis—a finding that flies in the face of the two-speed economy notion. So while some formerly fast-growth economies (Brazil and Russia in particular) have experienced a steep falloff in growth, some incipient and midfield countries boast robust expansion that has been underappreciated. And in the developed world, some major economies have recovered well from the global recession while others have seen a less-than-impressive bounce back. For instance, Japan and Italy in 2013 had not yet achieved the nominal GDP that they had in 2007, while the GDPs of the U.S. and the UK in 2013 were both one-sixth higher than in 2007.
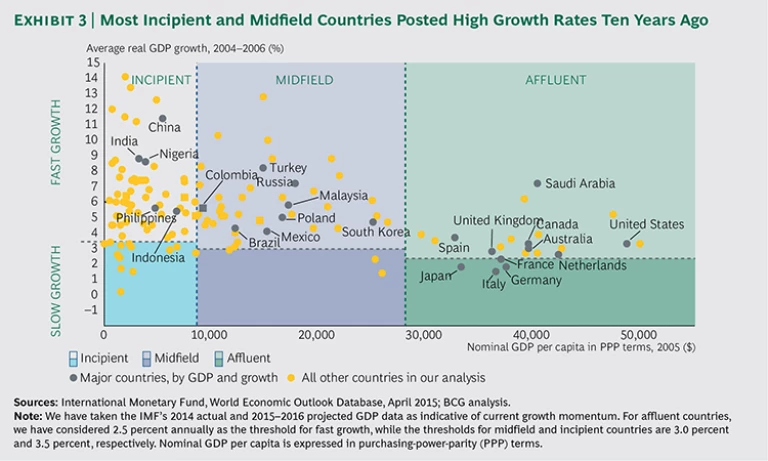
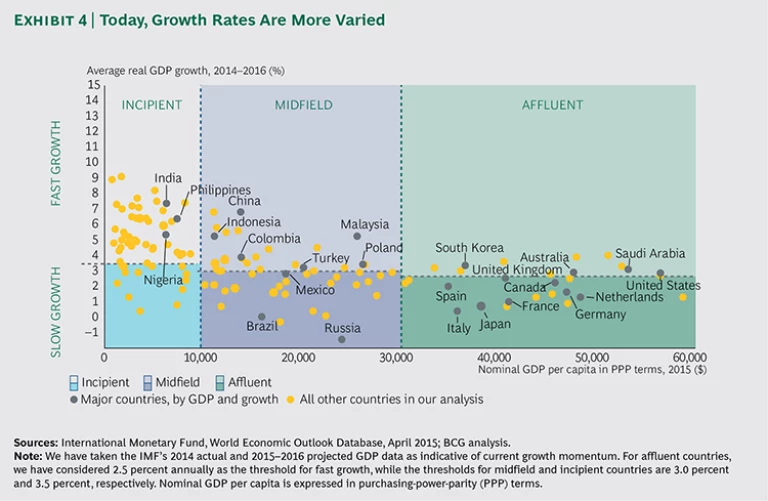
Analysis of GDP growth rates for our set of 152 countries shows how outdated the two-speed economy view is. Using International Monetary Fund estimated and projected data for GDP in 2014 through 2016, we have calculated the current GDP growth-rate momentum of individual countries. For affluent countries, we consider 2.5 percent annually (the median growth rate for the group) as the threshold for “fast” growth. To take into account that lower-income countries require stronger GDP growth rates to close the gap with high-income countries over time, we chose thresholds of 3.0 percent and 3.5 percent, respectively, for midfield and incipient countries. These growth rates allow for affluent economies’ doubling GDP (in real terms) in 30 years, while midfield and incipient economies would double GDP in 25 and 20 years, respectively.
Comparisons of growth rates for countries in our three income bands ten years ago with estimated growth rates today reveal that there is no longer a systematic relationship between income levels and growth rates. (See Exhibits 3 and 4.) Instead, today, there is roughly an even split between fast- and slow-growth economies in both the midfield and affluent country groups.
A review of the growth trajectories of G20 countries reveals just how much the landscape has shifted. Only a few years ago, the affluent members of the G20 were all growing slowly, and the midfield and incipient members were all growing faster. Today, the picture is mixed: more than half of G20 members lack growth momentum.
- Five are fast-growth affluent countries: Australia, South Korea, Saudi Arabia, the UK, and the U.S.
- Six are slow-growth affluent countries: Canada, France, Germany, Italy, Japan, and Spain.
- Three are fast-growth midfield countries: China, Indonesia, and Turkey.
- Five are slow-growth midfield countries: Argentina, Brazil, Mexico, Russia, and South Africa.
- One is a fast-growth incipient country: India.
This analysis highlights another important development: the obsolescence of the BRIC label. Since the label was coined, China’s growth has significantly outpaced the growth of the other three. Although India’s growth has picked up more recently, China’s economy now represents nearly three-quarters of the aggregate of the BRIC economies. The BRIC countries never had much in common, and their trajectories are increasingly divergent. In addition, China is now such an outsize part of the group that looking at these four economies together no longer makes sense. Ironically, the group appears to have gelled as a political force just as the four countries were becoming less meaningful as an economic cluster.
Identifying High-Priority Markets
If the world has changed so dramatically in such a short period of time, how can corporate leaders determine which markets are most relevant for them to track? And how do they prioritize amid such shifting dynamics? Two approaches to sorting global economies can be useful tools in answering these questions.
Approach One: The Contribution to Global Growth as a Measure of Market Importance. A powerful way of answering such questions can be found by rating countries on the basis of their expected contribution to global GDP growth. For each country, this is a function of its economic size and its growth rate.
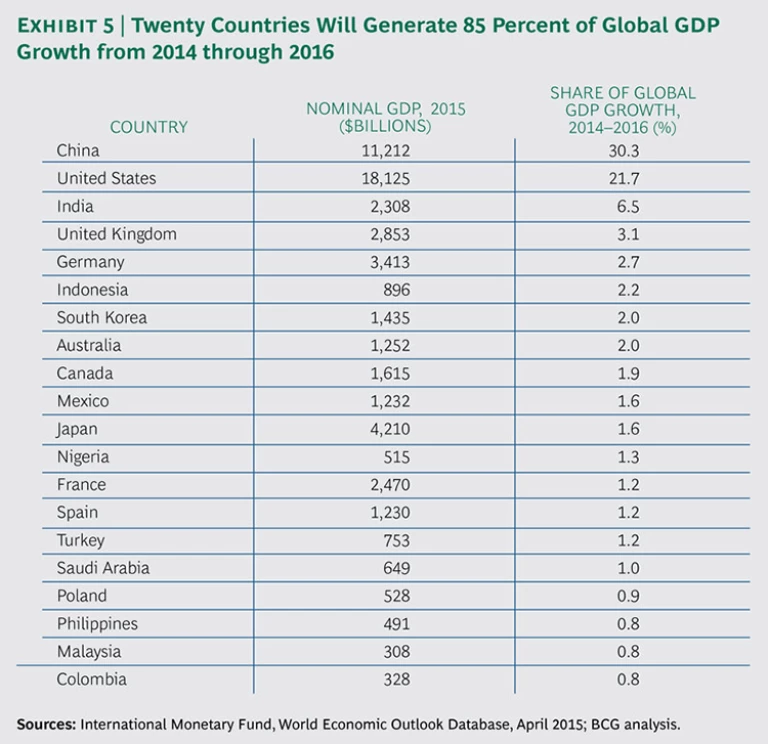
Applying this lens on an ongoing basis can help companies identify critical markets as dynamics change. Currently, 20 countries stand out because as a group they are expected to account for 85 percent of global GDP growth from 2014 through 2016. (See Exhibit 5.)
A couple of critical facts emerge from this list. First, this lineup serves as a strong reminder that in the near future, the shape of the global economy will be determined primarily by developments in two countries: China and the U.S. Despite China’s slowing economy, it is still expanding at a pace that outstrips most other economies. And combined, the U.S. and China account for half of the expected growth in the global economy from 2014 through 2016.
Second, although the G20 is often viewed as a proxy for the most important global markets, the list of the top growth contributors does not match up well with G20 membership. G20 members Argentina and South Africa, for example, do not make our top-20 list, while five countries that are not G20 members—Colombia, Malaysia, Nigeria, Philippines, and Poland—do. Those five countries demand attention not only because their prospects are relatively good but also because they provide a focus on subregions that might otherwise be overlooked.
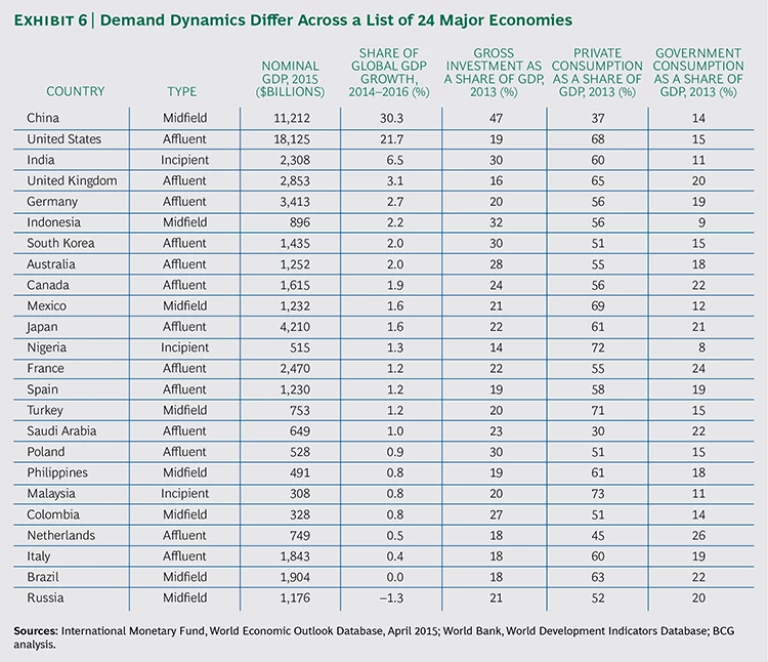
Certainly, there are some economies that companies cannot afford to ignore, regardless of their growth rates. Four such countries—Brazil, Italy, the Netherlands, and Russia, each of which currently accounts for at least 1 percent of the global economy—are missing from the list above because of weak or negligible growth momentum. As a result, we have added them to the list of the top 20 contributors to global growth, creating a roster of 24 critically important countries that should be on the current radar screen of most global companies. (See Exhibit 6.)
Approach Two: Using Demand Blocks as a New Lens for Global Markets. Although it is very useful to look at country growth momentum and economic size, it is also valuable to take another approach, one that zeros in on the most promising markets on the basis of demand blocks.
The global economy weighed in at $74 trillion in 2013.
Domestic demand is made up essentially of three components: private consumption, gross investment, and government consumption. Overall, the 2013 world economy consisted of $43 trillion in private consumption, $18 trillion in gross investment, and $13 trillion in government consumption.
In many countries, notably the U.S., private consumption is the dominant demand block, representing more than two-thirds of GDP. In China, the comparable figure is 37 percent of GDP, and investment is the main driver at nearly half of GDP. (China is the only major country where the investment share is larger than private consumption.) The role of government consumption also varies considerably: the Netherlands, France, Brazil, and Saudi Arabia are among the countries where it is most significant.
Using this lens to examine the 24 countries on our list, we can see clearly that affluent countries dominate the private-consumption market while midfield countries are making a major investment effort. The latter point reflects a combination of an infrastructure build-up and the process of urbanization—and what that entails in terms of residential construction—in many midfield countries.
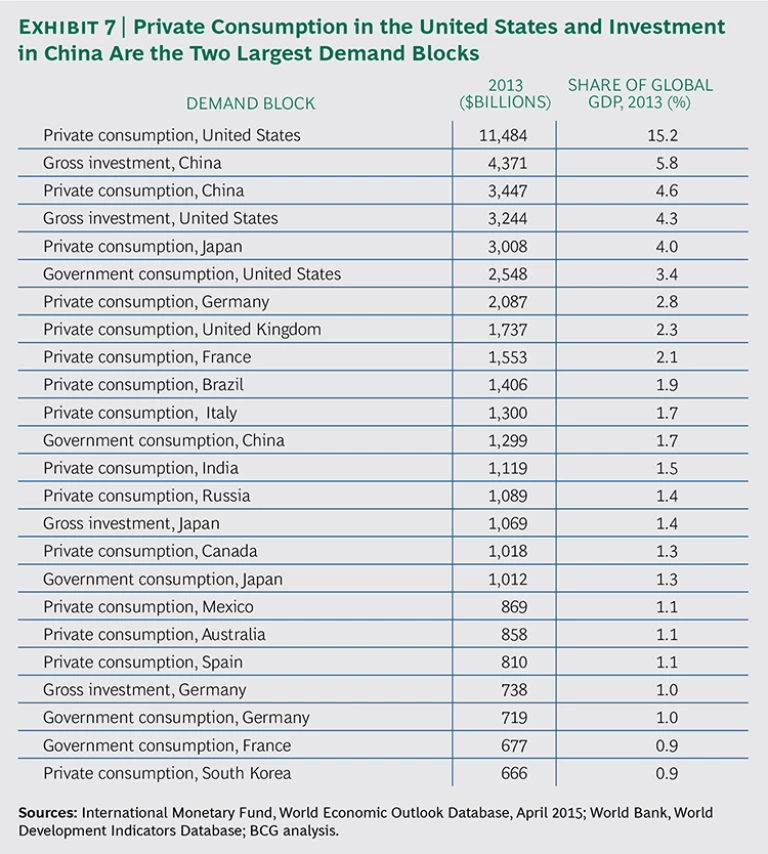
A further set of insights can be gained by reviewing the largest demand blocks overall. The largest two blocks are private consumption in the U.S. and investment in China, $11.5 trillion and $4.4 trillion, respectively. (See Exhibit 7.) These demand components are important in terms of the growth outlook for the world economy: both private consumption in the U.S. and investment in China are expected to contribute about 15 percent of total growth worldwide from 2014 through 2016. Other major demand components include private consumption in China ($3.4 trillion) and investment in the U.S. ($3.2 trillion), as well as private consumption in Japan and Germany and government consumption in the U.S.
It is critical that multinational companies understand how the size and importance of such demand blocks differ in various markets around the world. After all, the opportunities—in infrastructure development, for example—presented by countries with investment-driven economies are different from the opportunities in economies driven more by private consumption.
Rethinking Global Strategies
The lessons of global success over the past two decades strongly suggest that having good radar for tracking changes in the economic landscape and constantly updating the list of priority countries can be valuable sources of strategic advantage.
The two lenses we outline here—contribution to global growth and demand blocks—are useful sources of insight and can serve as the basis for such radar. They incorporate both a retrospective and a forward-looking perspective.
Of course, there are other factors that companies may want to incorporate into their process for establishing market priorities. Demographics, for example, provide yet another source of increasing diversity. A number of countries will be challenged by aging populations in the coming decades, while other countries will have youth population bulges that could become sources of opportunity or instability. In addition, national indebtedness and fiscal positions are indicators of vulnerability that have proved useful in past crises. Furthermore, climate change creates great uncertainty because it is likely to have large and varying effects on economic trajectories. And any company working through the process for setting priorities will need to factor in industry- and market-specific factors that affect profitability and risk levels.
But more important than any particular sorting approach is the overall message: adhering to outdated views of the world is dangerous. As the recent turmoil in stock, commodity, and currency markets makes plain, any indicator can quickly become outdated. Meanwhile, notions such as the binary nature (advanced versus emerging) of the world economy and shorthand labels such as BRIC have outlasted their usefulness as guides to global strategic thinking. This is true not only because the world is in a fast-change phase but also because the presumed homogeneity within categories has turned out to be a mirage.
This report should be seen as a companion to Why Well-Being Should Drive Growth Strategies: The 2015 Sustainable Economic Development Assessment (BCG report, May 2015). The concept of sustainability discussed in that publication is a valuable source of insight and can provide a long-term perspective on country dynamics that will be critical for companies that are making major and not easily reversed investment decisions.
Acknowledgment
The authors would like to acknowledge Peter Ullrich for his contributions to this report.
