Amid today’s extraordinary uncertainty, many companies are taking a hard look at their business portfolios. Should they diversify to reduce reliance on individual business lines and hedge their bets? Or should they sharpen their focus to reduce complexity and double down on what they do best?
To help companies navigate these strategic choices, we took a capital markets perspective: analyzing how investors have evaluated diversified versus focused portfolios. Our study covered 740 companies in the S&P Global 1200 index with continuously reported data from 2010 through 2023. By tracking how shifts in portfolio structure—whether toward greater focus or increased diversification—affect total shareholder return and valuation, we gained a fact-based view of what drives outperformance.
We found compelling evidence that focusing portfolios can be an effective path to value creation. On average, companies that streamlined their scope, concentrated capital and talent, and followed through with disciplined transformation outperformed peers in both relative TSR (rTSR) and valuation metrics. Moreover, our findings point to a set of distinct strategic approaches that promote the highest likelihood of success.
Stay ahead with BCG insights on corporate finance and strategy
Three Metrics to Assess Portfolio Focus and Performance
We used three metrics to assess portfolio structure and value creation. (See “About the Study” for a full description of our methodology.)
- The Herfindahl-Hirschman Index (HHI) measures revenue concentration and thus the degree of diversification across industries, providing a standardized metric to compare portfolio focus across companies. Higher HHI values indicate more concentrated (focused) portfolios, while lower values reflect greater diversification.
- rTSR isolates a company's performance relative to its peers. This metric is the difference between the company’s TSR and the TSR of the corresponding S&P Global 1200 industry group subindex.
- Diversification discount reflects the valuation gap between a company's actual enterprise value and its sum-of-the-parts valuation.
These metrics allowed us to examine not only whether focus creates value but how it does so, and to identify the common patterns of successful portfolio transformations.
About the Study
Companies in the Sample
We clustered and analyzed data on industry segment revenue for companies that were in the S&P Global 1200 index in January 2010. We chose the S&P Global 1200 because it includes the world’s largest publicly listed companies. To ensure consistency and comparability, we excluded firms that lacked complete reporting throughout the full timeframe studied. This yielded two sets of samples:
- 299 companies in the index from 2000 through 2023, which we used to analyze the long-term HHI trend
- 740 companies in the index from 2010 through 2023, which we used to analyze the performance and success factors of companies that had transformed
Measuring Diversification Using HHI
We computed the HHI at the company level based on revenue shares across industry segments. We classified industry segments based on the Global Industry Classification Standard (GICS) on a subindustry level to measure overall diversification. We split this measurement into unrelated diversification (revenue diversification across distinct industry groups according to the GICS) and related diversification (revenue share across subindustries within an industry group). HHI values close to 1 indicate highly concentrated (focused) portfolios, while lower values represent greater diversification.
For certain analyses, we classified companies as either focused or diversified using an HHI threshold of 0.82. Firms with an HHI above 0.82 were considered focused—typically indicating that 90% or more of revenue comes from a single business segment. Those below the threshold were categorized as diversified.
Analyzing Excess Return Using rTSR
To measure performance, we calculated relative total shareholder return (rTSR) as the difference between the company’s TSR and the TSR of the corresponding S&P Global 1200 industry group index. We applied this metric to companies undergoing portfolio transformations—defined as an HHI shift of more than plus or minus 0.2—to compare value creation from moves toward increased diversification versus greater focus.
Calculating the Diversification Discount
We estimated each company’s diversification discount using a sum-of-the-parts valuation approach. First, to compute an implied segment valuation, we applied the average revenue multiple of the relevant S&P Global 1200 industry group index to each company’s segment revenue in the corresponding GICS industry group. To ensure robust results, we replicated the analysis using EBITDA multiples. Since EBITDA is rarely consistently disclosed at the segment level over the timeframe, we approximated segment EBITDA by allocating the company’s total EBITDA proportionally to each segment’s revenue, applying the firm’s overall EBITDA margin across segments. We then used the sum of a company’s segment valuations as its implied enterprise value and compared it to the actual enterprise value to determine a diversification discount or premium.
For validation, we cross-checked results using Tobin’s Q—a metric comparing a firm’s market value to the replacement cost of its assets—as an independent valuation benchmark.
We refer to this as a diversification discount rather than a "conglomerate discount" because the latter is more narrowly defined in the academic literature, typically based on Standard Industrial Classification (SIC) codes. The GICS classifications used in our analysis are more reflective of today’s industry landscape and investor frameworks.
Classifying Economic Phases
To analyze cyclical effects on valuation metrics such as diversification discount, we segmented economic phases based on annual global real GDP growth from 1980 through 2023. We classified years in the bottom third of the distribution as “down” phases, those in the middle third as “mid” phases, and those in the top third as “up” phases.
Greater Focus Is Yielding Higher Shareholder Returns
Over the past few decades, companies around the world have steadily reduced diversification, opting for more focused business models. This shift has coincided with a notable decline in the average diversification discount, suggesting that investors increasingly reward clarity of purpose and operational simplicity. In this evolving environment, companies with focused portfolios are outperforming their diversified peers in terms of shareholder returns.
Diversification is declining. Our findings confirm a consistent structural trend toward portfolio concentration. Between 2000 and 2023, the share of companies classified as diversified (HHI less than 0.82, indicating that less than 90% of revenue is concentrated in one business segment) dropped from 57% to 45%. Over the same period, the median HHI increased by 18 percentage points. (See Exhibit 1.)
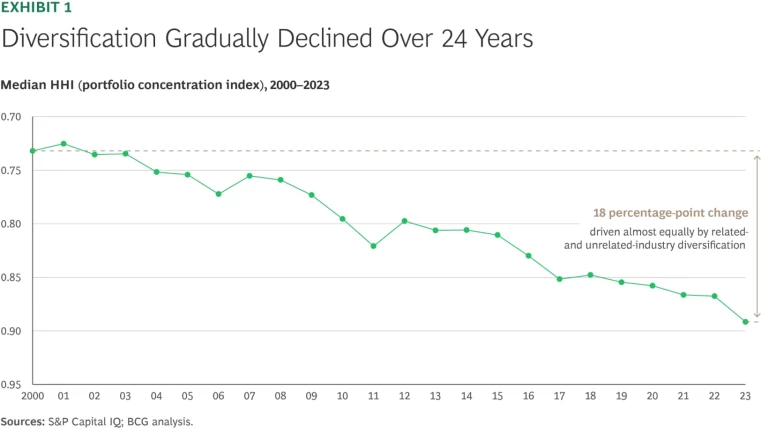
Unrelated diversification (across distinct industry groups) and related diversification (into adjacent or similar industries) contributed equally to this HHI increase. The only notable interruption in the trend occurred during the 2010 to 2012 market upswing, when HHI for unrelated diversification temporarily decreased. This reflected a rise in cross-industry activity as companies expanded into broader market opportunities.
The concentration trend is pervasive across regions and sectors, reflecting a reassessment of the value of diversification in a market environment that increasingly rewards strategic clarity. A meta-analysis covering more than 60 years of empirical research corroborates this shift, noting a steady decline in unrelated diversification since the
The diversification discount has also declined. In tandem with the rise in portfolio focus, the average valuation gap between diversified and focused companies has narrowed. Comparing 2019 through 2023 with 2010 through 2015, we found that the median diversification discount fell by 6 percentage points.
However, this downward trend was not linear. The diversification discount has fluctuated with the broader economic environment. (See Exhibit 2.) The discount declined most noticeably during economic downturns (periods when global GDP growth was in the bottom third of performance), such as 2019 to 2020. Conversely, it increased during strong upswings (when GDP growth was in the top third), notably in 2011 and from 2021 to 2022. These cycles reflect shifting investor sentiment: during downturns, markets tend to reward companies with lower risk from a diversified portfolio, while in bullish phases, there is often greater appetite for concentration on the most attractive growth opportunities.
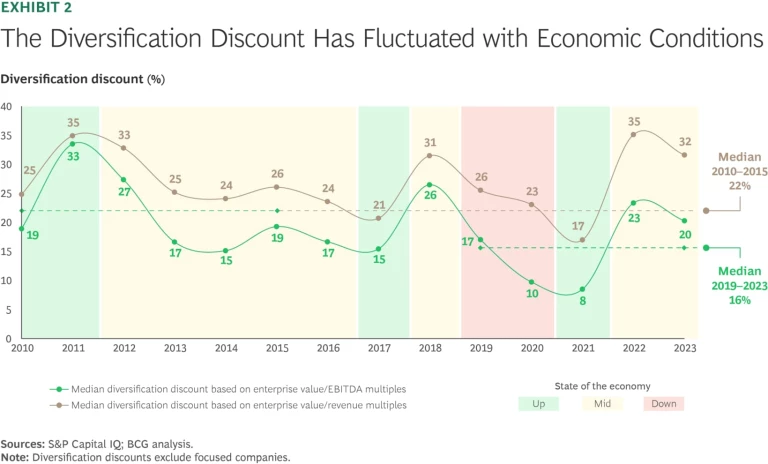
The direction of travel is clear. The decline in average diversification discounts correlates closely with the overall increase in HHI. This suggests that companies responded to evolving investor expectations by actively increasing their focus—streamlining portfolios to reduce complexity and concentrate on core strengths. Without these moves, many would likely have experienced even greater valuation pressure.
In essence, the narrowing diversification discount is not merely a passive market outcome. Rather, it is the result of deliberate portfolio actions, executed in response to long-term market signals as well as short-term
Focused portfolios outperform diversified companies. Even in the absence of major structural changes within a company, firms that consistently remained focused from 2010 through 2023 outperformed their stable but diversified peers. Focused companies in this category achieved an average rTSR of 2.3%, while diversified companies with similarly stable portfolios delivered 1.6%. This performance differential suggests that, all else being equal, markets consistently reward strategic clarity and concentrated resource allocation.
A “Focus Transformation” Creates Value
We next examined how companies performed after actively shifting their portfolios toward greater focus. For the 172 companies we identified as having undergone such a "focus transformation,” the key questions were whether such transformations translated into tangible performance gains and, if so, for which types of companies.
Focusing strengthens TSR performance regardless of starting point. Our analysis shows that the impact of focusing varies depending on a company’s starting position. Companies that were already in the top half of rTSR performers in the three years before starting their transformation managed to sustain their edge, achieving a 3.3% rTSR after increasing their concentration. Meanwhile, companies that had previously underperformed (the sample’s bottom quartile) showed remarkable improvement, achieving a 2.2% rTSR post-transformation.
These findings underscore that focus is not only a viable strategy for strong performers to maintain momentum but also a powerful lever for unlocking value in struggling businesses.
Focusing also leads to tangible valuation uplift—over time. The impact of focus extends beyond TSR to valuation fundamentals. Companies that focused saw an average 7.9 percentage point decline in their diversification discount, from 19% to 11%, whereas those that diversified saw an increase of 1.1 percentage points. (See Exhibit 3.) Furthermore, the average Tobin’s Q ratio (a metric comparing a firm’s market value to the replacement cost of its assets) improved from 1.5x to 1.7x after a focus transformation, versus a decline for those that diversified.
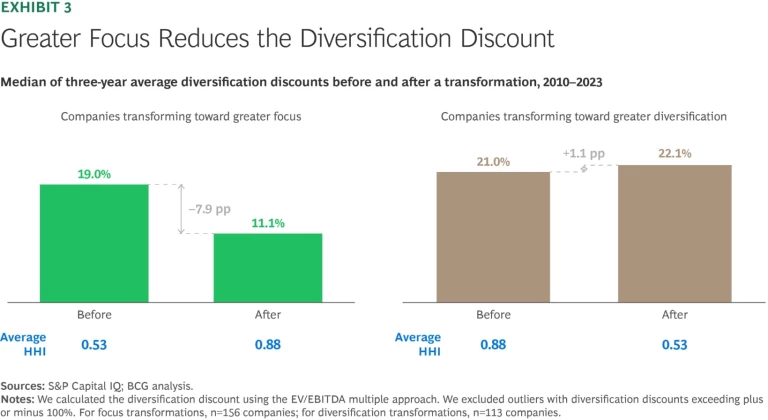
However, the full financial benefits of such transformations are not captured immediately. Our analysis shows that only 60% of the total discount reduction is realized within the first year after a portfolio shift. The remaining 40% materializes over the second and third years, reflecting the time it takes for markets to internalize the long-term implications of portfolio realignment.
This lag underscores the importance of sustained execution and clear investor communication well beyond the completion of transactions. Investors may reward focus, but they expect to see operational follow-through and consistent delivery on the new strategy. In other words, they place a premium on strategic simplicity, while recognizing that value capture is a multiyear journey requiring discipline and stamina.
Key Success Factors in Portfolio Moves
Although the benefits of focusing are evident, not all transformations yield the same results. To understand what separates successful transformations from those that fall short, we looked deeper into the patterns behind outperformance. Our goal was to identify what high-performing focus transformations have in common—beyond just the decision to focus. We found that the way transformations are structured and paced plays a decisive role in determining success. Specifically, our analysis points to three critical factors that consistently differentiate top-quartile outcomes from average performance or underperformance.
Exiting undervalued markets creates value. One lever in portfolio focus strategies is the divestment of noncore businesses during periods when overall market valuations are low (that is, when the market price-to-earnings ratio is below the ten-year average). Our analysis shows that such divestments are particularly effective in driving value creation.
Companies that acted decisively in these periods, often with divestments completed in a single year, outperformed peers in terms of rTSR in 75% of cases. Investors saw these moves as signals of strategic discipline and capital allocation focus, especially when tied to a broader intent to reinforce and streamline the core portfolio.
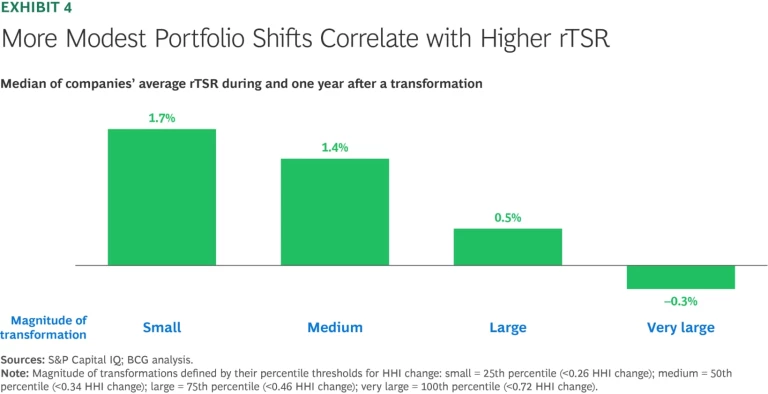
Gradual shifts deliver superior TSR. The magnitude of HHI change is closely linked to TSR performance. Companies that made moderate shifts in focus, defined as HHI changes in the bottom half of the distribution—the 25th and 50th percentiles, or less than 0.34 point—delivered the strongest results, outperforming peers by 1.7% and 1.4% in annual rTSR, respectively. (See Exhibit 4.) In contrast, companies that executed more extensive transformations—those in the top quartile of HHI change (greater than 0.46 point)—underperformed slightly, with rTSR lagging peers by 0.3%. This suggests that gradual transitions allow for better execution and investor alignment, reducing risk and signaling commitment without overpromising.
Consistency in transformation beats one-off moves. Long-term strategic consistency also emerged as a key differentiator. Companies executing focus transformations through small steps over multiple years outperformed peers by 8.1% rTSR during the transformation and retained a 1.1% edge in the years that followed. (See Exhibit 5.)
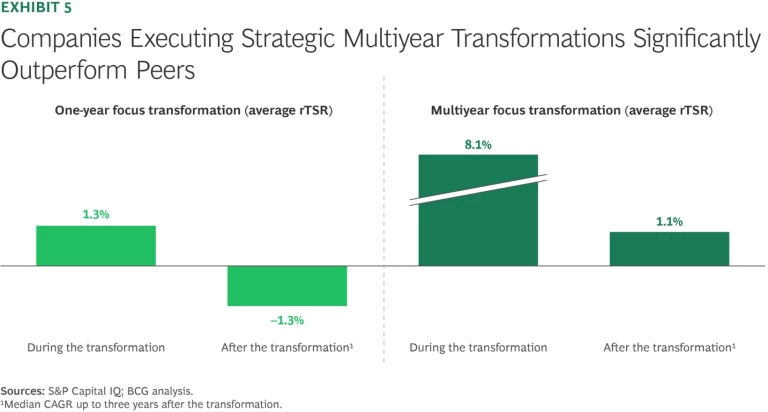
In contrast, one-off transformations yielded a lower rTSR of 1.3% during the transformation year. Moreover, this outperformance essentially eroded in the post-transformation period, with many companies failing to sustain their relative gains. These findings align with BCG’s broader research that emphasizes the importance of tailored portfolio transformation design, fit-for-context speed, and sequencing based on industry dynamics and company starting position.
Turning Strategic Focus into Sustained Outperformance
Our findings are clear: focusing portfolios is not only a trend—it is a value creation strategy. Companies that simplify their business scope, concentrate resources, and pursue consistent transformation journeys outperform in both rTSR and valuation metrics.
Yet success is not automatic. It depends on getting the "how" right, which includes these steps:
- Divesting from areas with low market multiples
- Sequencing changes through manageable steps
- Staying consistent over time
- Matching transformation design to company context and industry volatility
Although diversified models can offer advantages in moments of systemic crisis, the long-term premium increasingly favors focus. In today’s market, where strategic clarity is scarce and investor scrutiny is high, focus is a path to market outperformance.


