
The five-year period from 2017 through 2021 was turbulent in many respects, but it was a stable time for chemical companies. They enjoyed steadily increasing growth in total shareholder return (TSR) and in other fundamental economic measures. Even during two years of global pandemic, the chemical industry’s value growth held steady, and it was one of the first major industry sectors to recover financially.
So far, however, the year 2022 has been much more challenging. Inflation, the war in Ukraine, disrupted supply chains, and oscillating prices for oil, gas, and raw materials are all taking their toll. Moreover, demand has contracted in several key customer groups—for example, in some Chinese industries such as construction. Global auto sales, which represent another major customer group, continued a slump that began in 2020.
There are signs of the industry’s persistence in delivering value. Chemical TSRs are down only half as much as the broader market.
With so much uncertainty afoot, the markets are struggling for direction, and many managers cannot decide whether to plan for growth or for recession. The overall TSR for the chemical industry fell by 13% in the first half of 2022, giving back almost one-quarter of the value created during the previous five years. In the third and fourth quarters, uncertainty and volatility increased still further.
We are long-term believers in the chemical industry. There are signs of the industry’s persistence in delivering value. Chemical TSRs are down only half as much as the broader stock market. Still, there is more to do in order for companies to build the resilience needed to thrive amidst uncertainty. This is the focus topic for this year’s report.
Each year, we explore the changes in shareholder value, in terms of five-year annual TSR, for companies with a market value in excess of $1 billion. The chemical industry’s value is often a harbinger of general economic growth; and if the 2017–2021 TSRs are any guide, the prospects are hopeful.
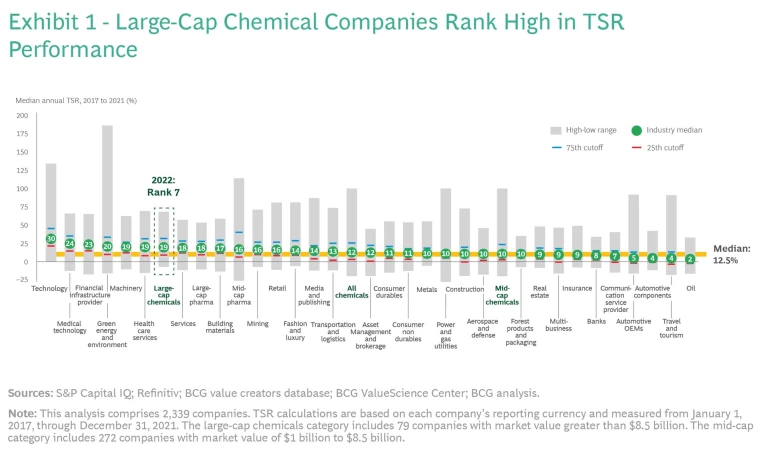
As in previous reports, we tracked the TSR status of large-cap chemical companies against that of other industries, using comparisons from BCG’s long-established Value Creators database. In the current assessment, covering 2017 through 2021, a good place to start is with large-cap chemical companies—companies whose total shareholder value exceeds $8.5 billion. There are 79 such companies in the category for this year’s report, and as a group they have done particularly well. Large-cap chemical companies ranked 7th against their large-cap peers across 33 major industries. (See Exhibit 1.) This represents a steady, significant improvement, from 16th place for the five-year period ending in 2019, to 12th for the five years ending in 2020, to their current ranking. Large-cap chemical companies also rose in absolute value, delivering an average TSR of 19% to shareholders for the five-year period ending in 2021—a significant improvement over 13% and 11% for the equivalent time frames ending in the two previous years.
The entire chemical industry, which in this study consists of all companies with a market cap over $1 billion, enjoyed similarly steady growth over the same period, albeit at lower TSRs and with less acceleration: from 8% (in the period from 2015 to 2019) to 10% (in the period from 2016 to 2020) to 12% in this year’s report. These numbers reflect the success of a much larger group of companies—351 in all. The roster includes many relatively young companies, especially in India and East Asia. They are growing rapidly, with high TSR performance, serving both global markets and those closer to home.
We calculate and compare median TSR over five-year time spans, rather than just focusing on the current year’s returns, in order to obtain a more coherent view of each company’s financial performance. Our approach downplays the temporary effects of spikes and plunges in shareholder price, which matters greatly in turbulent periods like the current one. (See “How We Calculate and Report TSR.”)
How We Calculate and Report TSR
Multiple factors affect TSR. Readers of BCG’s Value Creators series may be familiar with our methodology for quantifying the relative contributions of the various components of TSR. (See the exhibit.) We use the combination of revenue (sales) growth and change in margins as an indicator of a company’s improvement in fundamental value. We then use the change in the company’s valuation multiple to calculate the impact of investor expectations on TSR. Together, those two factors determine the change in a company’s market capitalization. Finally, our model also tracks the distribution of free cash flow to investors and debt holders—in the form of dividends, share repurchases, and repayments of debt—to determine the contribution of free-cash-flow payouts to a company’s TSR.

All of those factors interact—sometimes in unexpected ways. A company may increase its earnings per share through an acquisition and yet create no TSR if the acquisition erodes its gross margins. Moreover, some forms of cash contribution (such as dividends) can impact a company’s valuation multiple differently than others (such as a share buyback); the effects are complex.
In this report, the TSRs used for groups and for purposes of comparison are generally medians. The TSRs associated with individual companies are straight calculations of those companies’ capital gains—changes in share price value plus dividend value—rounded to the nearest percentage.
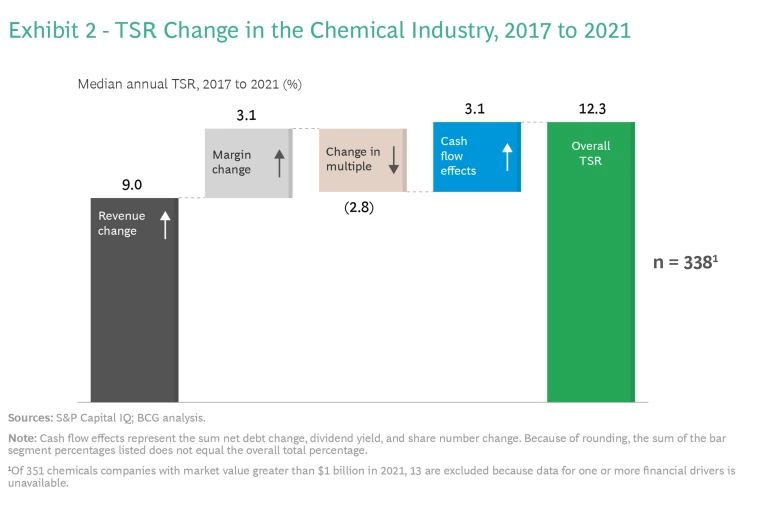
As always, we see TSR as a valuable indicator of the overall vitality of an industry sector. Although some readers might suppose that chemical companies rose in the rankings only because other industries faltered, that wasn’t the case. In almost all markets, revenue increases drove most of the industry’s growth, accounting for 9% of the 12.3% overall TSR. (See Exhibit 2.) Another 3.1% came from bottom-line improvement, indicated by a rise in EBITDA margin. Uncertainty and lowered expectations led investors to undervalue the companies during this period, reducing TSR by an estimated 2.8% (represented here as the change in EBITDA multiples). But this was offset by a 3.1% gain in net cash flow effects, including changes in debt, dividend yields, and number of shares. In short, the rankings show the chemical industry improving, not other industries getting worse.
This year’s report highlights several trends in the industry today. A wave of companies in Asia—particularly in India and China—are making TSR gains. Several industry subsectors, including multispecialty companies and agrochemicals and fertilizers, have generated shareholder returns above their previous TSR levels. The top TSR performers are shifting, too, with five of the current top ten located in India. Climate-related activity and sustainability are more closely associated with TSR in this report than they have been for several years. In terms of business models, TSR performance over the past five years suggests that technology-focused chemical companies are poised to do better than market-focused companies. This is a slight shift from our previous five-year analysis (for the period 2016 to 2020), in which market-focused business models outperformed the others.
Meanwhile, consolidation in the industry continues, largely through mergers and acquisitions, even as the total number of chemical companies expands. There are 113 new companies in our rankings this year, each having crossed the TSR threshold to reach more than $1 billion in market capitalization by December 31, 2021, the end of our 2017 to 2021 research period. The total roster has grown from 238 to 351 since our previous report, an increase of 47%. Consolidation may explain why, despite this overall increase, the number of large-cap chemical companies rose comparatively little—from 69 in last year’s report to 79 today.
Mindful of the crisis of 2022 thus far, we look at some of the pressures and contraindicators that confront the industry today. We also suggest some strategies that may help chemical company leaders maintain high TSRs going forward.
Asian Success Stories
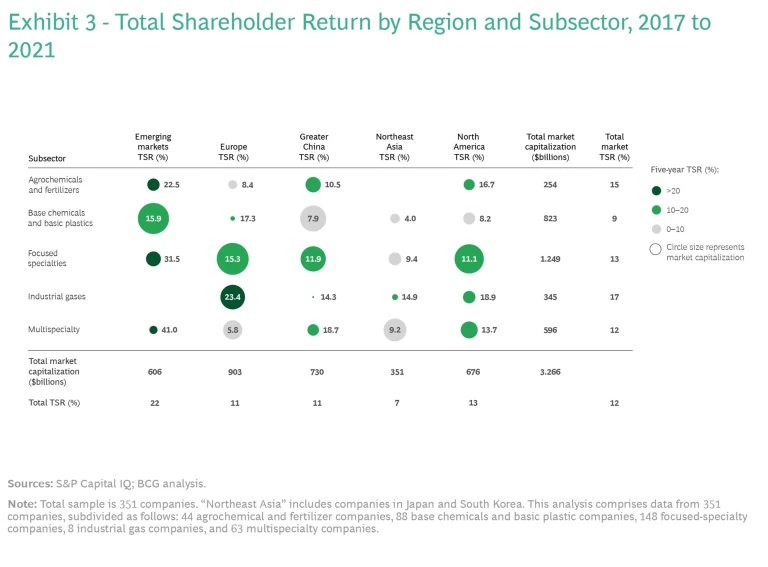
For the past five years, TSR has grown across all parts of the world. (See Exhibit 3.) One important element of this story is the performance of companies in India and Greater China. Indian companies have consistently displayed strong performance relative to companies in other regions. They account for most of the TSR in emerging markets. Particularly during the past three years of this time period, chemical companies in three Asian economies—India, Greater China, and South Korea—did particularly well. (South Korea is part of the Northeast Asia region.)
As Asian companies grow, they develop global reach, competing against producers in Europe and North America while maintaining their home market as a base. Some Asian companies are also building value through mergers and acquisitions with companies in the West. In mid-2021, Thailand’s PTT Global Chemical purchased Allnex, a German maker of coating resins; and in 2022, the Malaysian chemical group Petronas purchased Perstorp, a 140-year-old Swedish focused specialties company known for innovation in resins, coatings, lubricants, and sustainability- oriented products. Both deals reflected a focus on long-term strategic benefits rather than immediate synergies. The acquiring companies are improving positions in their value chains, gaining access to new markets, and extending their innovation capabilities in specialty chemicals.
China’s Revenue Growth Strategies
In Greater China, revenue growth has averaged 17% per year, driven by three specific growth trends. The first is the demand for focused chemicals in markets influenced by decarbonization and digitization. Makers of semiconductors, electronic vehicles, and batteries have become increasingly important customers for Asian chemical players. For instance, companies such as Dongyue, Shida Shenghua, and Huayou Cobalt have expanded their business in materials for lithium-ion batteries.
The second growth strategy in China involves broadening portfolios into adjacent businesses. Zhejiang Satellite expanded its petrochemical production capabilities to provide a wider range of carbon-based offerings, and Hualu-Hengsheng moved beyond its coal-to-methanol business into solvents.
The third growth strategy is backward integration, with the goal of securing supplies and optimizing costs. Some polyethylene terephthalate (PET) manufacturers took advantage of innovative crude-oil-to-chemical technologies to integrate their operations more closely with oil refining, while other chemical producers opened propane dehydrogenation plants. Both have been fertile areas for investment.
Headwinds in the broader Chinese economy have compressed valuation multiples, so the fundamental performance of the companies is stronger than the median TSR of 11% shows.
In this year’s report, six Chinese companies appear among the 20 named as top TSR performers. The highest-ranked Chinese chemical company is the Dongyue Group, a multispecialty business with a market value of about $3.5 billion. During the period from 2017 to 2021, it delivered an average TSR of 59%, ranking it sixth among the mid-cap companies (those with a market value of $1 billion to $8.5 billion) globally. Downstream demand has driven Dongyue Group’s rapid revenue growth since 2020, including a 178% increase in the first half of 2021. The company is a supplier of polyvinylidene fluoride (PVDF), which is used in lithium-ion batteries. Because of its businesses in fluoropolymers, organic silicones, and refrigerants, Dongyue is well positioned to catch other industrial trends too, including fuel cells and hydrogen.
India’s New Domestic Markets
India, where companies have benefited from a high level of investor confidence, has seen a consistent rise in TSR from 2017 to 2021. Some countries that used to rely on Chinese chemical imports are shifting to India as a preferred supplier nation.
In general, Indian companies are taking advantage of supply chain disruptions elsewhere; the ever-growing domestic market for focused specialties in categories such as paints, refrigerants, and pharmaceuticals; and the newer market for industrial chemicals. For example, there are now worldwide supply shortages in amines because of new environmental restrictions in China. To fill the gap, Indian pharma and agrochemical companies have shifted to chemical suppliers in their own country.
One prominent example of a high-TSR performer in India is SRF, a multispecialty company with a widening portfolio in the value-added specialty chemicals segment. Its five-year TSR of 52% earned it a third-place ranking in performance among large-cap chemical companies. SRF is one of the top three refrigerant producers in India and is the only one with full backward integration to its refrigerant production. This has given it a cost advantage against competitors. It has pursued the large domestic Indian markets in agriculture and pharmaceuticals, along with other global markets. SRF is active in sustainability-related innovation—for example, in developing low-carbon-impact refrigerants.
New Patterns of Subsector Performance
In most of our previous studies, the focused specialties subsector earned higher average performance figures than other subsectors did. In the five-year period from 2017 through 2021, other subsectors demonstrated noteworthy growth as well. The TSR for industrial gases, a small group of consistently profitable companies, rose from 13% to 17%, in a continuation of past trends. The most interesting stories involve the agrochemicals and fertilizers categories and multispecialty companies. These subsectors outperformed their past track records.
In agrochemicals and fertilizers, total shareholder return rose from 3% (during the five years from 2016 to 2020) to 15% (during the period from 2017 to 2021). This wave of TSR improvement in the subsector—the first it has experienced since 2016—is due in part to favorable conditions for food growers, especially in Latin America. New business models have emerged, with data analytics a playing a major role in helping farmers use their resources more effectively. Another factor is the rise in prices for food-related commodities, especially soybean and corn products, but also including ethanol fuel. Finally, agrochemicals and fertilizers, the two main businesses within this subsector, may have different dynamics. Fertilizers fared well during the pandemic, but agrochemicals are gaining in revenue during the current inflationary period.
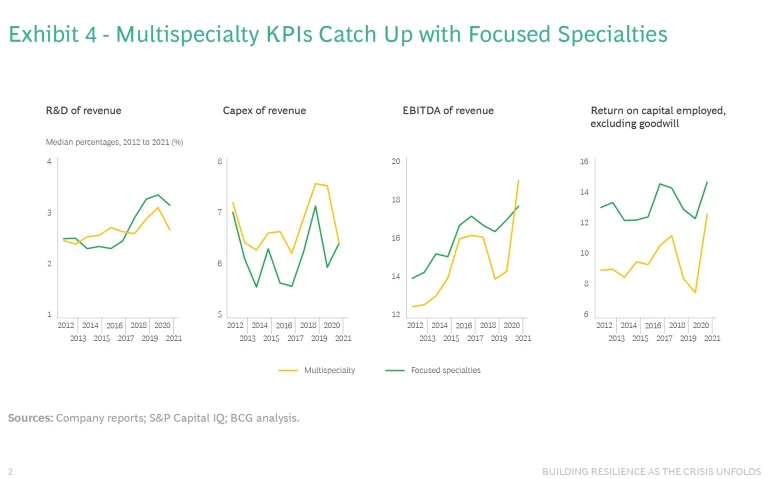
Multispecialty chemicals rose from 9% to 12%. This continues a trend that began in 2020, which we noted in last year’s report as a possible harbinger of future industry direction. These tend to be large, diversified producers, and they may be emerging from the doldrums of the 2010s. In general, the past few years have seen multispecialty companies catch up with focused specialties in several key financial metrics, most notably capex as a percentage of revenue and EBITDA as a percentage of revenue. (See Exhibit 4.) This reflects a higher ROI for the capital expenditures that multispecialty companies are making.
One explanation for this shift in fortunes may be that multispecialty companies have been paying attention to the capital markets and have learned from the success strategies of other subsectors. They are managing their businesses with more differentiated focus and greater acumen. They are also spinning off or separating themselves from noncore and underperforming businesses, making them somewhat less diversified than they used to be.
Finally, it’s possible that the breadth and scale of multispecialty companies give them the ability to weather volatility a bit more deftly than some smaller, more specialized companies. This is reflected in the EBITDA as a percentage of revenue figures, which rose in this subsector from 14% in 2020 to 19% in 2021. During the first half of 2022, however, this metric fell back to 17%—a possible indicator of headwinds and turbulence ahead.
The Top Performers
Each year, we note the ten companies that ranked highest in TSR performance over the past five years. In calculating the rankings for this year’s report, we included each company’s five-year annual TSR ending in 2021, which is our usual approach.
Of the ten large-cap companies with the highest overall TSR for this five-year period, four are based in China and largely serve the domestic market there—except Wanhua, which also has a large global business. (See Exhibit 5.) The others are located around the world.
By contrast, six of the top ten mid-cap companies are headquartered in India. Smaller companies, with rapid growth and more association with digital technology, tend to have relatively high TSRs. (See Exhibit 6.)


This year, 11 of the top 20 companies on our two lists are focused specialties producers. Examples include Alkyl Amines Chemicals and Balaji Amines (amine producers), Toyo Gosei (photosensitive materials used, for example, in displays and filters); and EcoPro (air pollution control materials). The next most prevalent subsector is multispecialty companies such as Dongyue Group and Posco Chemtech. The only base chemical company in the overall group is Deepak Nitrite, a company with a market value of about $4.5 billion, located in India. Among large-cap companies, base chemicals have a larger presence: three entrants, all headquartered in China. This reflects China’s ongoing role as a provider of and market for standard chemicals. And while agrochemicals and fertilizers advanced as a group, only one company from that subsector made the top ten: Chambal, in India.
The roster of top-performing companies changes continually, and the past year has been especially volatile. Of the top performers on this year’s list, only two—Lonza and Wanhua—were on last year’s list. Shareholder value for some previous high scorers declined during the first half of 2022, and many of these are likely to rebound.
The Value of Technology-Based Business Models
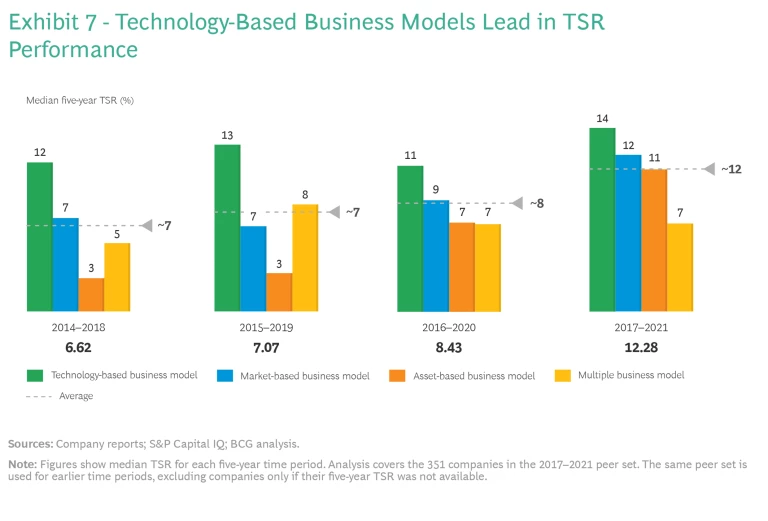
The business model that a chemical company adopts plays a major role in its TSR performance. Companies in this industry tend to divide into four broad groups, depending on how they create value over time: asset based, market based, multiple, and technology based. (See Exhibit 7.)
The overall strongest performer of the four is the technology-based business model. Companies following this model compete through proprietary offerings and intellectual capital. This group includes some providers of high-performance polymers, enzymes, and catalysts for industrial processes, as well as some producers of electronic chemicals used in manufacturing semiconductors. In many instances, innovations like these are difficult to reverse-engineer or reproduce. These companies thrive particularly well when their offerings are distinctive and few other companies can supply them.
The technology-based business model seems to be changing as sustainability efforts take hold. As innovation for alternative energy—particularly hydrogen fuel and battery technology—has increased, so has the need for capital investment, which has begun to pay off for many companies that have responded actively to the need.
The market-based business model calls for companies to focus on satisfying customer requirements, typically in the B2B sphere. They recognize the high level of industrial innovation taking place right now, and they accommodate rapid shifts in demand by synthesizing compounds upon request and supporting applications and particular industry needs. This group has experienced the most consistent increase in five-year TSR, moving from 7% to 12% over three successive reports. When the market-based model requires investment, it is usually to improve customer service or to develop products and services tailored to specific customer needs.
The technology-based business model enables companies to compete through proprietary offerings and intellectual capital.
The asset-based business model is almost as strong on TSR as the market-based one. Companies in this category focus their businesses on running their assets efficiently and mastering supply chains seamlessly. The assets may include large-scale, high-investment production facilities, such as those used in cracking petrochemicals, or they may involve access to basic chemicals. In our previous report, this group earned a median TSR of just 6%, but that figure has risen to 11% in this year’s report, reflecting supply shortages and increased demand for basic raw material products during the most recent five-year period. Continued disruptions in global supply chains could benefit this sector in the short run, by increasing prices and margins.
Companies with multiple business models, which combine the other three models in some fashion, saw little change. In last year’s report, covering the period from 2016 to 2020, their median TSR was 6%. In this year’s report, it rose slightly to 7%. In the context of sustainability and volatile change, the multiple business model may be at a disadvantage because it requires so much investment to keep up with changes in all three domains.
Thriving in a Crisis
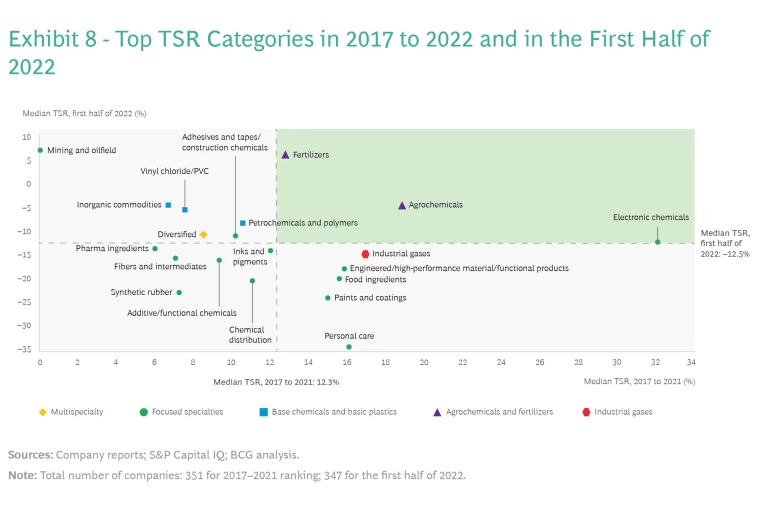
What do the instability and macroeconomic headwinds that began affecting the markets in 2022 augur? Is the sudden shift to an overall –12.5% TSR cause for long-term concern, or is it a temporary anomaly like the blip that occurred in mid-2020?
One way to explore this question is to break companies out by product category. (See Exhibit 8.) Just a few of these categories fall above median rankings in both the five-year period from 2017 to 2021 and the first half of 2022. To do so, their aggregate TSR had to stay above 12.3% for the first five years, and then their six-month TSR had to stay above –12.5% for the first half of 2022. The product categories that accomplished this feat were electronic chemicals (which delivered by far the highest TSR), agrochemicals, and fertilizers.
These categories have several attributes in common. They benefit from a high price environment for some of the materials they supply, such as nitrogen fertilizers and silicon wafers. On the customer side, demand for these materials is strong and growing stronger. The categories also tend to have robust pricing power, often on the strength of contracts with pass-through provisions. These areas have also benefited from digital innovation and close customer relationships.
One example is CF Industries, a fertilizer producer based in Deerfield, Illinois. The company had a TSR of 21% for the five years ending in 2021, and then a TSR of 22% for the first half of 2022, placing it among the very few companies with a higher TSR for those six months. CF Industries sells its fertilizer products in Europe, and the lower price of natural gas in the US gives it a competitive advantage in lower feedstock costs. It also has benefited from expanding demand for fertilizers, driven by population growth. The company built on these advantages in its strategy, which includes promoting sustainability, capital investment (for example, new blue ammonia plants in the US Gulf Coast), smart fertilizer systems, and the advanced use of digital technology.
The disruptions of the past several years, including oil price volatility, the pandemic, inflation, and the war in Ukraine, remind us that eras of relative stability are few and far between. Even if the macroeconomic climate calms down, geopolitical changes may create new challenges to global supply chains.
At the same time, there is reason to be optimistic. The crisis yields large opportunities for companies that gain competitive advantage now. The most resilient companies—those that can adapt quickly to changing circumstances—appear to be getting stronger.
A Plan for Increasing Your Resilience
Some companies are responding to the current challenges with a surefooted combination of analysis and implementation, deploying the full range of tools and leverage points now available. Beyond changes in cost structures and asset bases, resilience requires improved ways of working and faster decision-making practices. High inflation and energy prices, which put margins at risk, can rapidly shift. Labor and supply shortages may vary around the world. Chemical companies that cannot turn on a dime will be unable to compete.
Every company is different, and there is no single silver-bullet strategy that will suit every situation, but successful responses seem to have a sequence of activities in common. These can be summarized in three steps.
First, size the problem that you’re facing. Develop a set of scenarios—alternative futures—that capture the specific issues affecting your supply and demand. Then stress-test your existing financial health and business model against the most severe outcomes in each scenario. Include financial outcomes in the simulations.
Assume that any of these outcomes could happen, and assess the gaps you identify in your capabilities and competitive environment. How would you stand up if the business environment began falling all around you? Conversely, would you be ready for a new wave of demand for products adjacent to your own, especially if they required you to pivot to provide them? Be ruthless in scrutinizing your strengths and weaknesses, particularly with regard to the competitiveness of your assets.
Beyond changes in cost structures and asset bases, resilience requires improved ways of working and faster decision-making processes.
The point of these exercises is not to predict the future but to identify no-regret moves that you can make today in order to maximize your preparedness for any future that comes your way. The most robust investments involve gaining competitive advantage whether the business environment is brilliant or bleak. The scenario exercise will also illuminate your organization’s temperament and give you confidence to make superior, thoughtful decisions, rather than hasty, self-defeating responses.
Second, manage the short-term challenges that confront you. Focus on those that need immediate attention and those that can provide you with a visible win to demonstrate to your organization. Develop pricing programs that offer customers relief from inflation, in part through your own ability to cut costs. Look for rapid energy transition opportunities and ways to shift from selling products by weight to using fee-for-outcome pricing.
Third, develop a plan to improve your resilience for the medium to long term. This has several components:
- Set up milestones to help the business move, step by step, toward its goals. Limit each business segment to just one or two goals, and avoid creating more projects and initiatives.
- Protect your top line by gaining more transparency on your costs. Find the right balance between customer-centric direct-sales channels and cost-focused distributors. Improve your capabilities for B2B engagement and sales activation. Use data analytics and AI to rethink your approaches to capturing and keeping customers.
- Reduce your break-even point. Review your assets. Improve your procurement and sourcing strategies. Develop your supply chain resilience by cultivating a wider net of local suppliers. Streamline all activities relate to selling, general, and administrative expenses, and design staff reductions to create a lean workforce, not to leave your company feeling weaker. Focus on operational excellence, using digital technology, yield improvement tools, and partnerships with other organizations.
- Review your portfolio, including capex investments and R&D. Be prepared to ditch or delay projects if you can’t justify the required investment. Act rapidly on M&A possibilities and other opportunities when they arise. Develop innovative offerings through alliances and joint ventures, gaining machine learning and advanced data analytic capabilities in the process. Devise a sustainability strategy and a plan for diversifying downstream toward more specialty products. Continually consider adjacent categories that you could expand into. As an example, Navin Fluorine started as a fluorine producer but is now active in materials for electronics and batteries.
- Learn from your experience. Monitor risks and make specific people accountable for rapid action when circumstances change. Set up processes to adjust plans as needed. For example, you may need to implement cost reductions if demand softens. Escalate incrementally from moderate improvements, such as supplier contract renegotiations, to radical ambitions, such as a 20% rise in productivity.
This year, the industry is cautiously optimistic yet challenged, as it seeks to retain its ability to create value while preparing itself for more change. You are not alone in this: your customers, suppliers and competitors are all engaged in the same difficult task. No matter how volatile things get, you will not lose your license to operate. Be bold and determined as you build resilience now. Sooner or later—maybe sooner than you think—you will use that resilience to seize your future.


