
The Boston Consulting Group has been tracking value creation among large-cap companies on a global basis for 19 years. Not surprisingly, a cursory look back reveals substantial turnover among the top companies each year. But a deeper look uncovers an elite group of consistent outperformers—companies that have delivered outstanding value creation over a sustained period of two full decades. These companies are not always at the top of our annual value creators rankings, but more often than not they are among the strongest performers. They significantly outpace the market, and they manage to resist the fade that ultimately drags most outperformers back to average. How they do so provides some valuable lessons for others seeking to deliver strong and sustainable results for their shareholders.
The 2017 Value Creators
- Value Creation and Corporate Reinvention
- Creating Value from Disruption (While Others Disappear)
- How Top Value Creators Outpace the Market—for Decades
- The 2017 Value Creators Rankings
The 2017 Rankings
First, the new news. Among the world’s 200 largest companies, the top ten value creators for the five years from 2012 through 2016 delivered an impressive average annual TSR of 41%, with a range of 66% to 30%. (See Exhibit 1.) By way of comparison, the average annual TSR for the next ten best companies was a still impressive 29%. The overall average annual TSR for the approximately 2,350 companies in this year’s value creators database was 16%, well above the long-term average of about 10% for the S&P 500.
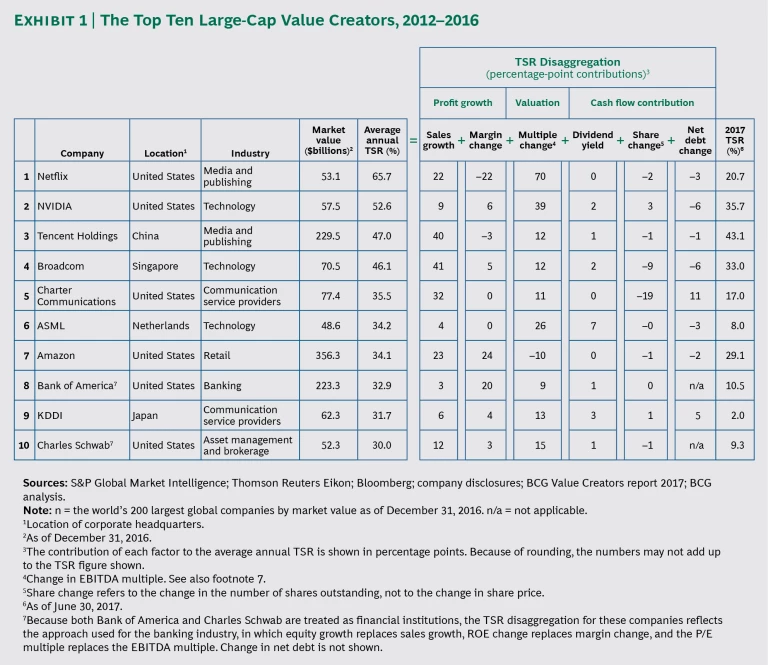
The top ten companies represent six industries, with a concentration in technology, media, and telecommunications (TMT)—and Amazon, despite being listed as a retailer, also qualifies as a megacap technology player. The results are a departure from the previous two years, when pharma dominated the top ten, holding down four places each year. Nevertheless, although pharma is absent this year, it has not fallen far: three companies in the industry—Gilead Sciences, Allergan, and Celgene—rank in the top 20 (and as we shall see, they are consistent long-term value creators). As an industry, large-cap pharma (more than $18 billion in market cap) ranks only 17th this year (17% median TSR), while mid-cap pharma ($4 billion to $17 billion) still ranks first. Other top-five sectors are consumer durables, automotive components, financial infrastructure providers, and medical technology. (See Exhibit 2.)
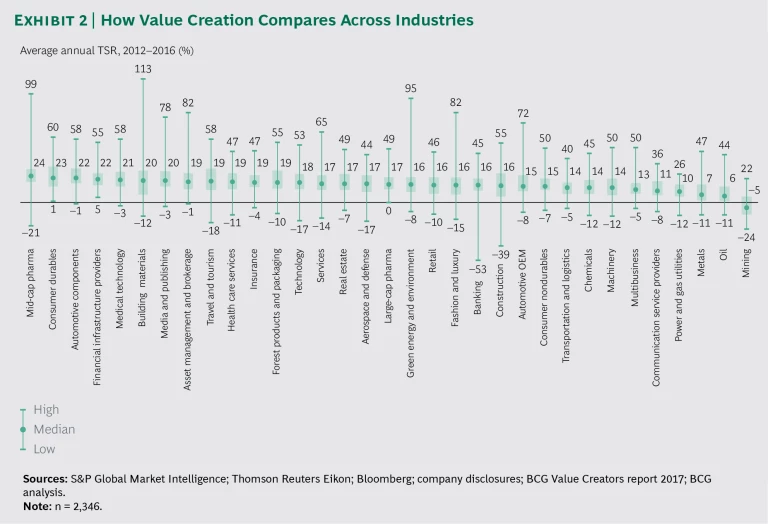
At the other end of the spectrum, with the exception of the mining industry (which had a median TSR of –5%), even industries near the bottom (such as communication service providers, oil, and metals), which have been buffeted by sector-specific economic headwinds, still managed to deliver solid, if unspectacular, median annual TSRs of 6% to 11%. And a challenging industry context does not rule out superior value creation—the top-performing companies in most industries rank well above average, or even in the top quartile, across the full sample.
Why TSR Is Important…
People sometimes criticize TSR for being a time frame-dependent metric, and certainly a company’s TSR performance depends on the starting point and length of the period measured. Bank of America, for example, was a top TSR performer for the most recent five years, with an annual return of 33%; and however, it had a –35% annual TSR between 2006 and 2011.
That said, TSR (especially relative TSR) is valuable, because it reflects shareholders’ true bottom line (the total return they receive from the moment they buy the stock). A new CEO, a shift in strategy, a big acquisition or divestiture—all such changes signal a new phase in a company’s life and a reason to start a new TSR clock ticking. Using TSR as a performance measure lets companies set goals and reward managers for delivering actual value, rather than focusing on relatively narrow measures that may be arbitrarily selected or even subject to manipulation, such as EPS growth or return on equity. TSR helps managers and boards balance short-term moves and longer-term vision. It takes some of the weight off quarterly EPS and enables companies to incentivize longer-term performance—from the shareholder’s point of view.
…and Difficult to Sustain
Five years is hardly a short time frame, and delivering value at the level that top-ten companies do over such a period is a considerable accomplishment. Last year, we looked at how hard it was to sustain the exceptional performance of a global top-ten company for more than a few consecutive rolling five-year periods. For example, just three of the companies in the 2017 top ten also made the 2016 list—KDDI, Netflix, and Tencent. Last year, five companies—KDDI, MasterCard, Netflix, Regeneron, and Visa—were newcomers; this year, of those five, only KDDI and Netflix remain in the top ten. (See Creating Value Through Active Portfolio Management: The 2016 Value Creators Report, BCG report, October 2016.)
The likelihood of beating the market—especially by a wide margin, year in and year out (or over consecutive measurement periods)—is low. For companies in mature industries, the challenge is even greater because growth is such an important driver of long-term TSR. That said, companies in mature industries still can drive value creation by improving efficiency, allocating capital prudently, and returning cash to shareholders rather than investing it in low-return growth opportunities. At the other extreme, the primary value creation priority for high-growth companies is to “beat the fade.” High-growth companies must significantly outperform expectations, because capital markets look forward and continually capitalize expected future earnings into today’s stock price. As growth slows, which it almost inevitably does, falling expectations usually lead to lower valuation multiples, and this in turn reduces TSR. As a result, top-performing companies tend to move slowly to average market performance over time.
Successful companies also understand that every strategy has a useful life. Over the long term they regularly adapt their strategies and their value delivery models to evolving circumstances. Some rebuild expectations by investing in the next wave of high-return growth opportunities. Others pursue a growth-focused model in a young or fast-growing industry, but over time, they shift to a more balanced mix of growth, margin improvement, and rising cash payouts in order to reap higher rewards for shareholders. In the right circumstances, investors will pay up for a cash-focused, high-dividend model or a turnaround story that emphasizes improving margins. Senior management and boards of directors must regularly review and challenge current strategies and underlying assumptions regarding such issues as the market and the company’s competitive position, financial resources, and human capital.
Tales of 20-Year TSR
From 1997 through 2016, nine companies that rank among the largest 200 have been top-quartile value creators in at least three of the four five-year periods. They top the consistent value creators list for the past two decades by generating average annual TSR of 16% to 32% over 20 years. (See Exhibit 3.)
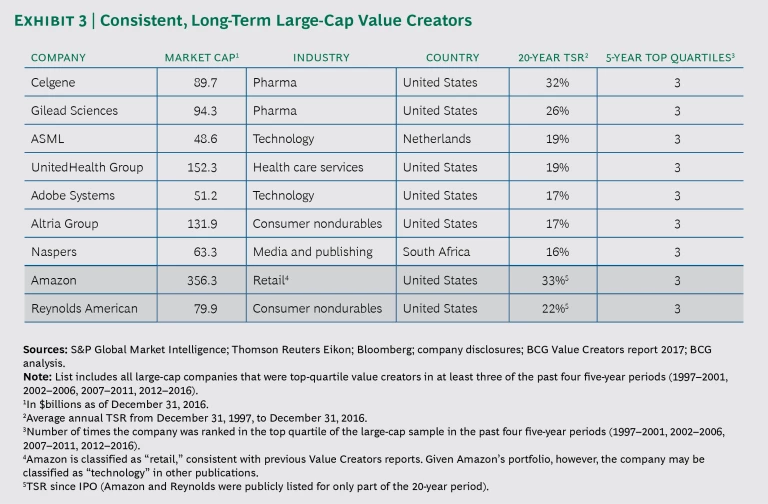
These are extraordinary levels of sustained value creation. Over 20 years, a 16% annual TSR results in a twenty-fold increase in absolute value, and a 33% annual TSR results in a three-hundred-fold increase in value.
The small number of consistent value creation champions is not surprising; it’s close to what a statistical analysis of outperformers versus underperformers would suggest. More interesting are the questions of where these nine companies come from and how they built their track records. Two are pharma companies, two are tech firms, and two are tobacco companies. One comes from media and publishing, and one from health care. Amazon straddles tech and retail. Seven are based in the US, one in the Netherlands, and one in South Africa.
What are these companies doing? Which value delivery models do they follow? Three (Gilead, Celgene, and Amazon) are high-growth stories, with 20-year annual revenue growth rates of 52%, 41%, and 43%, respectively. The two pharma firms have ridden blockbuster-producing R&D programs to dizzying heights, and along the way they have also used M&A strategically to reinforce their innovation efforts. They have managed to outperform even the outsized expectations that fairly consistently become priced into such companies’ stocks. (See “Innovation in 2015,” BCG article, December 2015, and “Bristol-Myers Squibb: Reshaping the Portfolio to Create Superior Shareholder Value,” BCG article, October 2016.)
Amazon generated its growth by fundamentally and continually disrupting one of the economy’s biggest sectors—retail—and championing the development of an entirely new, high-growth industry: cloud computing. Like the two pharma firms, Amazon has for a long time met or exceeded high expectations and rebuilt expectations that it can continue its rapid growth and thereby maintain a high multiple.
Two other top companies—Altria and Reynolds American—could not have more different stories: they have hardly grown at all. Both are in the tobacco industry, which has long been in decline. But they have managed to beat expectations and expand margins (largely by raising prices), and they have consistently returned cash to shareholders through generous dividend yields.
Between these two extremes of high growth and no growth are several companies that have pulled multiple TSR levers over time. For the first decade or so of our time frame, ASML rode a steep growth curve. Then, as the semiconductor market changed and growth slowed, the company adjusted its capital allocation strategy to return more of its cash flows to shareholders, increasing its dividend yield to 7% over the most recent five years. Similarly, Adobe, Naspers, and UnitedHealth Group have managed slowing growth, uncertain market conditions, and investor expectations. All of these companies have achieved strong TSR and—in recent years—expanded multiples as they have repositioned themselves for the future.
For consistent value creators, the strong tailwinds of a growth industry help, to be sure. But far more important is management’s understanding of different value delivery models, its willingness to adapt its strategy and capital allocation to meet evolving conditions, and its ability to balance short-term targets and longer-term TSR goals. (See “The Art of Capital Allocation,” BCG article, March 2017.) Regardless of time frame, top performers set their sights on winning in their industry or peer group—and they deliver.
There are plenty of ways to create value in both the near term and the long term. Top performers are adept at selecting the most effective ones for responding to the conditions they face.


