
Manufacturers can use an assessment framework to anticipate and prepare for future market disruptions.
Volatility in the supply and price of raw materials—resulting from the COVID-19 pandemic and the war in Ukraine—is strongly affecting companies across many sectors, including manufacturing. For example, pandemic-induced disruptions followed by a strong rebound in demand drove a 250% increase in US steel prices compared with the recent prepandemic low. Among the many supply shocks caused by the war, the price of natural gas spiked by over 50%.
Although the recent impacts have been extreme, this is not manufacturers’ first time managing market perturbations. Indeed, our research shows that market disturbances caused by extreme events—including natural disasters, geopolitical disruptions, and other global crises—are becoming more frequent and more pronounced. Even as the recent crises show signs of easing, companies can use insights from past episodes of volatility to compile a set of risk indicators for their most critical raw materials. By periodically assessing these indicators, they can prioritize materials for closer monitoring and take appropriate actions to mitigate the risks of supply disruptions.
Supply Disruptions Are Frequent and Persistent
Raw materials frequently experience market volatility, often resulting from supply disruptions, pent-up demand, or significant peaks and troughs in prices. The past two decades provide examples of both temporary and sustained supply disruptions that caused significant price increases. In 2010, for instance, heavy floods in Thailand, the world’s largest rubber producer, caused prices for the commodity to surge 57% year on year. Similarly, the 2011 Tohoku earthquake and tsunami in Japan temporarily shut down the world’s only plant that produces the specialty pigments used in automotive paint. Major automakers were forced to delay production of vehicles in certain colors while they scrambled to replace the pigments with other chemicals.
Since the onset of the pandemic, the manufacturing sector has been rocked by supply chain disruptions that have resulted in shortages and higher prices. We have seen instances of a bullwhip effect in which changes in demand have been amplified as they move further upstream in supply chains, causing significant shifts in availability and pricing.
Companies can use insights from past episodes of volatility to compile a set of risk indicators for their most critical raw materials.
Most notably, many automakers were unprepared for the semiconductor shortage caused by the pandemic-driven surge in demand for consumer electronics and technology infrastructure. The semiconductor supply issues were among the factors that prevented automakers from meeting strong demand in their own sector. The market imbalances cost the industry an estimated 10 to 12 million units in 2021.
In addition, supply crises that affect consumers more directly—such as the current food crises sparked by the effects of the war in Ukraine—can have important secondary and tertiary effects, including disruptions in social cohesion, mass migration, and government instability.
Assessing the Leading Risk Indicators
Manufacturers have a clear imperative to anticipate and prepare for market disruptions such as these. Given the large number of inputs required for their production operations, they face the challenge of deciding which raw materials to focus on. By analyzing and tracking their leading risk indicators, companies can allocate their attention and resources to the most at-risk materials. It's important to note that a company’s context is critical. Different businesses will have different perspectives on which commodities to include in the assessment, as well as on how to interpret and act on the findings. In addition to risk exposure, the criticality of commodities and the availability of substitutes are important factors to consider.
For each raw material under consideration, risk indicators across four key dimensions provide visibility into supply scarcity and price volatility:
- Supply and Demand. Companies often must source materials that are heavily concentrated within a region or among a small set of suppliers. Constraints on diversification expose companies to increased risk of supply disruptions, such as from natural disasters, geopolitical conflicts, and suppliers’ financial challenges. Having few, if any, alternative options when disruptions occur is an additional risk driver. Nonlinear demand growth for a material—in the company’s sector as well as in others—typically indicates that demand will eventually outpace supply, resulting in scarcity and price increases. By forecasting demand growth, companies can understand the potential for stresses on a commodity’s availability that could make the market less resilient to external shocks.
- Supply Chain Resilience. Having multiple options for material extraction, processing, and logistics allows companies to mitigate the risks that could limit the availability of specific suppliers. The breadth of a company’s options is affected by suppliers’ barriers to market entry. Chief among them is the capital intensity of production, which can be assessed by looking at the price of a commodity per unit cost of installed production capacity. Flowing from this, price volatility is another barrier to market entry because it affects the reliability of suppliers' projections of capital intensity.
- Geopolitics and Regulation. The war in Ukraine is the most recent example of how geopolitical dynamics can pose risks to supply. To evaluate geopolitical exposure, companies should understand how governmental factors—such as conflicts, sanctions, embargoes, and trade regulations—could influence the price and availability of materials in the near and long terms. Besides production disruptions, trade routes are also becoming more vulnerable to conflicts and economic sanctions. Other trends include resource nationalism (with governments asserting control over their country’s resources) and the push toward resource or raw-material independence at the national level. In addition, companies should consider the approach that countries and regions are taking to sustainability. For each material, manufacturers should analyze risks related to the impact of carbon taxes, decarbonization incentives across supply chains, and recycling.
- Cross-Sector Impacts. To anticipate disruptions, manufacturers need to understand how trends and actions in other sectors will affect the production and delivery of raw materials. For example, suppose a country restricts the supply of electricity to promote sustainability or reduce infrastructure costs. Such a move will elevate risks to the supply and price of commodities heavily concentrated in the country, which manufacturers downstream will need to anticipate and prepare for. Companies should monitor the specific sectors that are most relevant to their industry. Automotive companies, for example, should focus on energy and transportation and logistics given their impact on the availability of essential commodities.
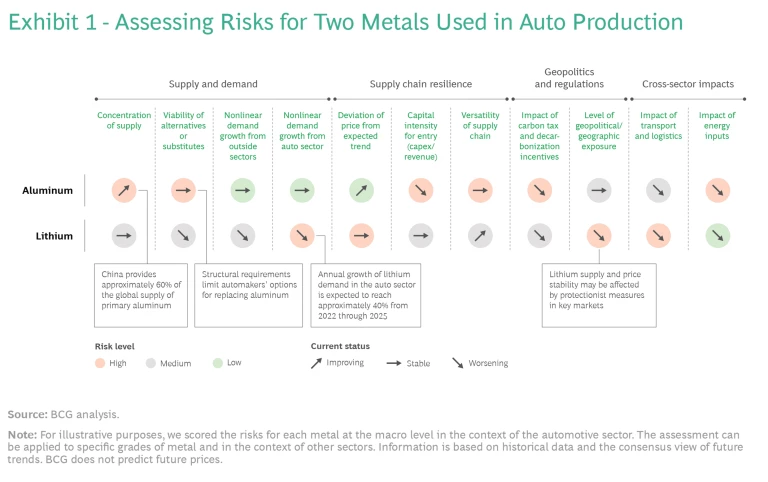
To facilitate an assessment, indicators related to each of these dimensions can be visualized as a framework. Exhibit 1 illustrates the application of the framework to two metals used in automotive production: aluminum and lithium. For each indicator, the framework shows the current risk level (low, medium, or high) as well as how the risk level is evolving (improving, stable, or worsening). This assessment takes a macrolevel perspective on the risks associated with these metals, while a more fine-grained perspective might focus, for example, on specific grades of metal.
The Assessment in Practice
Looking at aluminum, we found that the major drivers of risk levels in the automotive industry will be concentration of supply, capital intensity of smelters, and demand growth in the industry itself. The risk relating to supply concentration is high and increasing. China provided approximately 60% of the global supply of primary aluminum through 2019. But the relative growth of supply from China is expected to slow as the country seeks to reduce greenhouse gas emissions. The high cost of capital involved in bringing aluminum smelters online means that the rest of the world is unlikely to build enough new capacity to offset the slower growth of China’s supply. Adding to the overall risk level, structural requirements limit automakers’ options for replacing aluminum. However, demand growth for aluminum in the automotive industry will be linear and represents a low risk. (See Exhibit 2, left side.) This assessment points to the integration of recycled aluminum into the supply chain as a way to circumvent the headwinds. By advancing the technology for recycling and developing partnerships with leaders in the field, manufacturers could bolster access to aluminum supplies.
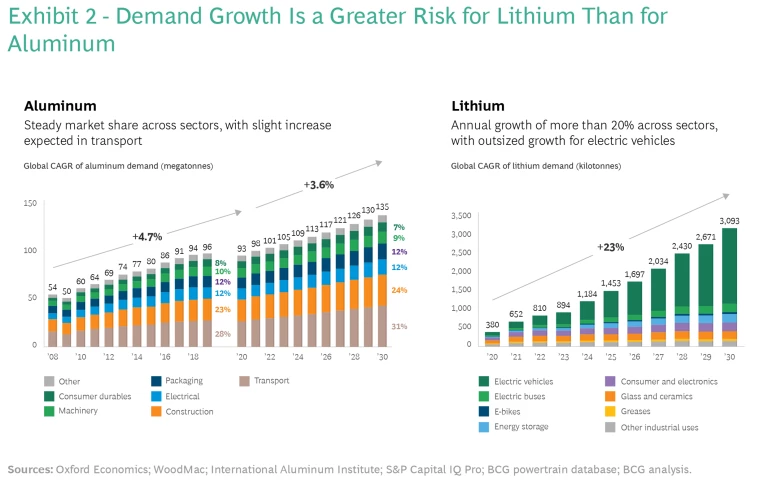
For lithium, supply and price stability in the automotive industry will be greatly affected by demand growth and global protectionist measures. Exponential demand growth is a major risk factor. (See Exhibit 2, right side.) We expect approximately two-thirds of the growth to come from electric vehicles that use lithium-ion batteries, with the annual growth rate reaching approximately 40% from 2022 through 2025. Through 2030, an anticipated surge in the adoption of electric vehicles will further increase demand for lithium-ion batteries. Demand outside of the automotive sector—such as from consumer electronics, energy storage, and electric buses—is expected to grow by approximately 15% through 2030. Lithium supply and price stability will likely be affected by environmental concerns, which some countries will seek to address through protectionist measures.
Applying the Lessons of the Semiconductor Shortage
How can companies use the insights generated by the risk assessment? To continue with the example of the automotive industry, the semiconductor shortage offers some lessons. If we turn the clock back to 2018 and apply the assessment to conditions at that time, we can see signs that the supply of 70-nanometer legacy node semiconductors was not keeping pace with demand. If the industry had heeded those signs, it might have been better prepared for the shocks arising from COVID-19.
This retrospective assessment shows moderate or high risks for three indicators: concentration of supply, viability of substitutes, and nonlinear demand growth in the automotive sector. Five semiconductor manufacturers accounted for more than 40% of the 70-nanometer chips supplied to automakers. The use of alternative suppliers was hampered by the challenge of substituting newer fabrications (of less than 70 nanometers). The challenge arises from the need to test the chips in products and revamp the supply chain, as well as from the two-year lead time needed to construct new foundries. These constraints placed the auto industry in a poor position to respond to nonlinear demand growth. In 2018, the expected annual growth of industry demand for 70-nanometer chips through 2025 was approximately 10%, driven by several technological developments. This figure was significantly higher than the near-term demand growth through 2020.
By analyzing and tracking their leading risk indicators, companies can allocate their attention and resources to the most at-risk materials.
Had they been aware of these risks, automotive OEMs and suppliers could have taken action to mitigate the effects of supply scarcity and the associated price volatility. Considering that the war in Ukraine has disrupted supplies of materials used in semiconductor production, companies should be preparing now for future chip shortages. Four categories of action (which are among those we will discuss in our next article) are especially relevant:
- Flexible Business Planning and Execution. Improving interactions and data flows for planning and execution allows companies to make faster course corrections in response to supply-demand imbalances. For example, by detecting early indications of the potential for insufficient supply and alerting the right stakeholders, companies can preemptively explore new sourcing options or redesign affected products. Key enablers of such flexibility, especially during crises, are transparency into demand at the part level and the use of forward-looking analytics to forecast demand.
- Supply Chain Resilience. Companies can take various approaches to strengthen their ability to forecast and respond to supply-demand imbalances. These include applying data, analytics, and digital technology to anticipate chip shortages and simulate their effects. In addition, gaining end-to-end supply chain visibility helps business strategy teams in developing responses to shortages and helps procurement teams in pursuing new purchasing options and building inventory buffers.
- Value Chain Positioning and Partnership Strategy. By forming partnerships with value chain participants (such as component suppliers and raw-material producers), OEMs and tier 1 suppliers can help to secure supply over the long term. OEMs can also work together to acquire supply or reassess product designs.
- Value-Based Innovation and R&D. Companies can design a technology roadmap to, for example, incorporate newer fabrications in place of legacy nodes, reduce the number of chip types used in a car, or substitute semiconductor components used in other products.
The greater visibility gained by assessing risk indicators allows companies to anticipate disruptions and allocate resources where they are needed most. But assessing risks is only the starting point. Companies also need the ability to prepare for crises and take the sorts of mitigation actions we have described. In our next article, we will discuss the capabilities that companies must build over the near and long terms to manage supply and demand shocks.
This is the first of two articles on managing raw-material scarcity and volatility. The next article will describe the capabilities companies must build to minimize the impacts of volatility.


