"Synergies” have been used to justify some of the worst and best M&A transactions in history. M&A is supposed to be about value creation, and for many deals, synergies are cited as the primary means to that end. But relatively few companies provide hard numbers to support these claims. Even seasoned executives and M&A advisors use the term in varying ways that engender different interpretations. And empirical evidence on the role of synergies in determining M&A outcomes is hard to find.
This article aims to set straight the role of synergies in M&A value creation.
A Definition
Start with a straightforward definition: synergies are the source of the tangible expected improvement in earnings (calculated at an annual run rate) that occurs when two businesses merge. In our analysis of almost 300 recent significant M&A transactions, we found that the acquiring companies paid an average of $3 billion—a 34% premium—to gain control of their targets. What sorts of synergies did these acquirers really get in return for their investment? How did they know—or did they know—whether they were overpaying for those synergies? From the viewpoint of acquiring shareholders, what were the predictors of value-creating synergies?
We found that, when it comes to synergies, value-creating acquirers are different from others in the way they do three specific things:
- They limit the control premium that they pay on the basis of a rigorous assessment of the synergies that they expect to achieve.
- They are candid with their investors about their synergy expectations, publicly describing explicit synergy commitments when they announce a deal.
- They practice rigorous postmerger integration (PMI) to capture synergies fully and rapidly, and they are transparent with investors about their progress.
The Data
Not all M&A is pursued in the name of achieving synergies; for example, sometimes an asset simply may be perceived as undervalued and therefore a good deal. In other cases, companies want to acquire a critical technology or capability that they lack. But most deals do involve synergies (or so investors are told). To examine the role that synergies play, BCG analyzed 286 major acquisitions. The deals, spanning a dozen industries in North America, were conducted from 2010 through 2015. Each transaction was valued at more than $500 million, involved two public companies, and was a significant deal for the acquirer, meaning that the total deal value was greater than 30% of the acquirer’s market capitalization.
For each deal in our sample, we asked the following questions:
- How much did the acquirer pay (in the control premium) relative to the announced synergy targets?
- Did the acquirer disclose the synergy expectations publicly?
- Did the acquirer report on the progress relative to the initial synergy targets within 12 to 18 months of the acquisition?
As part of the analysis, we developed a simple metric that we call the P/E of synergies. It is the control premium paid (the absolute-dollar amount, using share price data 30 days before announcement) divided by the pretax synergies (the absolute- dollar amount at the expected annual earnings run rate). For example, if a company pays a control premium of $3 billion and expects $300 million of pretax earning synergies, the P/E of synergies is 10x. Dealmakers often focus on the control premium they need to pay to get a deal done. Since the P/E of synergies compares the control premium with the deal’s effect on earnings power, it is a more powerful indicator of whether the transaction is likely to create value for investors. (See the sidebar “The P/E of Synergies: A Key Metric for M&A Success.”)
THE P/E OF SYNERGIES: A KEY METRIC FOR M&A SUCCESS
The P/E of synergies is a complementary valuation indicator to the more traditional measure, overall percentage of the control premium paid. It also appears to have clear predictive ability to estimate how well a deal is likely to be received by investors.
For the 167 companies in our data set that announced expected synergies, the average premium paid was 34% and the average P/E of synergies was 8.6x. But in the retail sector, for example, the average control premium was 45.4%, while the average P/E of synergies was only 5.1x. It is not surprising that retail acquirers that announced synergies achieved a 20-day relative total shareholder return (rTSR) of 4%. On the other hand, energy companies paid a lower-than-average control premium of 25.5% and a higher-than-average P/E of synergies of 12.7x. The median rTSR for the companies announcing synergies was –5.7%. High-tech acquirers paid an average control premium of 40.1% and an average P/E of synergies of 7.1x, 1.5 percentage points below average. Those announcing synergies received a 20-day rTSR of 1.65%. (See the exhibit below.)
Synergies and Shareholder Value
We also reviewed each acquirer’s relative total shareholder return (rTSR)—its stock price performance relative to an industry index—to determine which deals did and which did not create value. Not only did we find consistent outperformance in value created by companies that accurately valued synergies, paid appropriately, and delivered on their projections, we also found that the market consistently penalized less disciplined acquirers. (See the exhibit, “A Disciplined Approach to Synergies Leads to Superior M&A Value Creation.”)
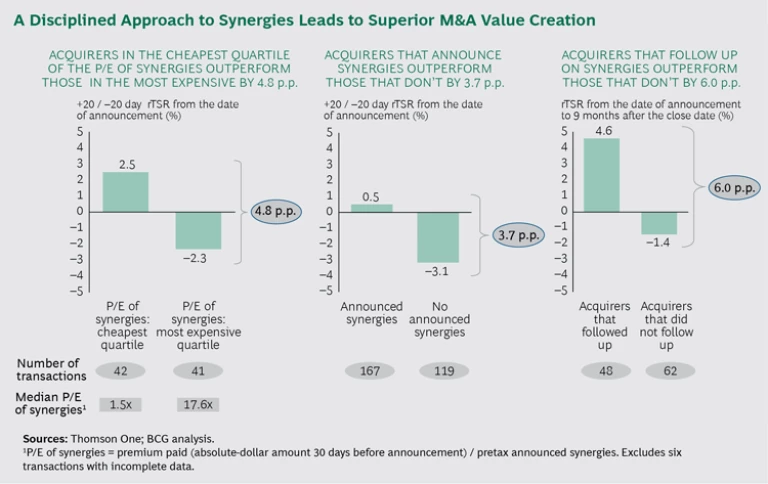
Acquirers in our data set that paid less than the average P/E of synergies outperformed by about 5 percentage points of rTSR those that paid more than the average. Those that paid more than the average P/E of synergies were penalized with a negative rTSR. Moreover, the acquirers in the cheapest quartile (those that paid a median P/E of synergies of only 1.5x) outperformed those in the most expensive quartile (those that paid a P/E of synergies of 17.6x) by 4.8 percentage points of rTSR. The data is consistent. The second quartile outperformed the third quartile by 3.1 percentage points. To put this in context, consider that an acquiring company with a $30 billon market capitalization could expect to see more than $1 billion of market capitalization added (or subtracted), depending on how it handled its valuation and disclosure of synergies.
Preparation, Candor, and Delivery
The research shows that acquirers should do their homework: they must be in a position to publicly announce the synergies they expect to result from the combination. Yet only 58% of acquirers in our sample (167 out of 286 companies) announced synergies, and the percentage varied by sector. For example, 69% of high-tech and 59% of energy acquirers announced expected synergies while only 38% of health care companies and 45% of materials companies did the same. Investors bid down the shares of acquirers that did not announce synergies. In the 20 days before and after the announcement date, the TSRs of these companies averaged –3.1%, which translates into almost $300 million of lost value per transaction.
Of the acquirers that initially announced synergies, only 29% then saw fit to follow up with investors on their progress against their targets. Those that did were further rewarded by shareholders, outperforming those that did not by a median of 6 percentage points nine months after their deals closed. Moreover, those that did not follow up saw positive rTSRs at the time of the announcement turn negative (a median rTSR of –1.4%) nine months after their deals closed.
There is good reason for these discrepancies, and it’s not only that investors generally appreciate management transparency. In our PMI work with more than 1,000 companies worldwide, we have observed that most successful acquirers go after a significantly larger synergy number than they publicly announce, and they achieve the synergies much faster than they project publicly. The thinking is simple: if we can’t get the synergies within 12 to 18 months, they are not likely to happen. Management teams that put themselves on the line do so secure in the knowledge that they plan to outperform—a good strategy for management and shareholders alike. (See the sidebar “Outperforming on PMI.”)
OUTPERFORMING ON PMI
Acquirers project two types of synergies: cost and revenue. Very few of the companies that announce their synergy expectations break out the two, but they do tend to track each one internally.
On the basis of our work with more than 1,000 PMI projects, BCG has built a database that tracks the PMI results of some 200 transactions over the past decade. Our data and analysis show that companies’ internal synergy expectations are significantly higher than the targets they provide publicly: on average, they are 15% higher for cost synergies and 21% higher for revenue synergies. In addition, companies that practice particularly rigorous PMI, holding firm to the accountabilities outlined below, substantially exceed even their internal targets. These companies boost cost synergies by another 15% (so the total achieved exceeds the announced synergies by 32%) and revenue synergies by 25% (for a total of 51% over announced expectations). (See the exhibit below.)
Delivering on Promises
These are big gains even if one factors in some conservative downplaying of initially announced expectations. So how do successful companies do it? In our experience, they practice four subdisciplines, all of which are related to accountability within the organization.
- Bottom-Up Accountability. Smart companies don’t leave synergy projection to the bankers and the M&A team; early on, they involve the line managers who will be responsible for achieving the targets. These line managers play a part in setting their targets.
- Individual Accountability. Managers are assigned individual responsibility for their specific targets and held accountable for meeting them by the project management office (PMO) and top leadership. Furthermore, targets are hardwired into managers’ budget and performance objectives, eliminating any ambiguity about what is required.
- Leadership Accountability. Top management leads from the front throughout the PMI process. It actively supports the PMO and stays the course until target realization is well underway.
- Public Accountability. Individual managers are held publicly accountable for meeting their targets. “Heroes” are acknowledged and rewarded (often with meaningful leadership roles in the acquired company); managers who come up short must answer to their peers as well as the boss.
In addition, companies that excel at PMI move fast, especially with respect to revenue synergies. One highly effective technique that enables companies to hit the ground running the day after a deal closes is the establishment of a so-called clean team that gets a jump-start on planning for revenue synergy execution. The clean team is a group of outside advisors or soon-to-retire managers who can work with confidential customer data from both companies during the period between contract and closing without running afoul of anticompetition laws or regulations.
Realizing Elusive Revenue Synergies
Identifying cost synergies is a relatively straightforward exercise, and achieving them is largely a matter of accountability and discipline. Revenue synergies present bigger challenges in both quantification and realization. This may be one reason why relatively few companies (only one-third of those that announce any synergies) announce revenue synergies in advance and investors are skeptical of those that do. Acquiring companies in our database received virtually no market benefit increase for projecting revenue synergies.
That said, in our experience, many frequent acquirers have become adept at realizing these synergies. They demand the same level of rigor that they require when they go after cost synergies precisely because revenue synergies are so difficult to project and execute. Best practices from best-in-class acquirers include the following:
- Using detailed account mapping and allocation to identify precisely the opportunities for increased revenues
- Quantifying cross-selling quotas and linking associated compensation and incentives to achieving them
- Clearly articulating future sales models (such as reselling and referral) and implementing sales force enabling programs (such as new training)
- Moving quickly to capture key-account upside potential and to protect against major account loss, not waiting to identify top cross-selling targets or key accounts at risk while IT systems are being integrated, and using manual solutions to address the greatest upside opportunities and downside risks.
Putting It All Together
In the competitive bidding market for corporate assets, many acquisitions transfer all, if not more than all, of the synergy value from the acquirers’ shareholders to the seller’s shareholders. (See Divide and Conquer: How Successful M&A Deals Split the Synergies, BCG Focus, March 2013.) This is why more than half of all deals destroy value for investors.
Value-creating M&A requires discipline in the assessment, valuation, and delivery of synergies. Take the example of Martin Marietta and TXI. The two companies announced a $2.7 billion merger in January 2014 to “create a market-leading supplier of aggregates and heavy building materials, with low-cost, vertically integrated aggregate and targeted cement operations.” The combined company had a market capitalization of about $9 billion. The announcement highlighted the expectation of significant synergies: “The transaction is expected to generate approximately $70 million of annual pretax synergies by calendar year 2017.”
Martin Marietta paid a P/E of synergies of 5.8x, which is lower than our data set average of 6.5x for the materials industry. Investors reacted to the deal with a 20-day rTSR of 18.7%. Martin Marietta followed up on its synergy estimates on February 11, 2015, indicating that the company expected to exceed its original estimates by 40%. Nine months after closing, the company’s TSR had outperformed the industry index by 8.3 percentage points.
M&A is risky business—especially for the shareholders of acquiring companies. To be sure, many factors that contribute to M&A success or failure are beyond management’s control. But acquirers can tilt the odds strongly in their favor by consistently applying discipline to how they assess, value, and deliver synergies from their acquisitions.


