
The best military leaders study history—and for good reason. By understanding the battles of the past, they can better prepare their forces to win in current and future conflicts. That concept applies to the business world as well, particularly right now.
Given the current economic adversity, it’s valuable to identify which companies not only survived the previous crisis—the global financial meltdown—but also emerged stronger from it. More relevant, though, is understanding the five steps that these companies took and that helped them prevail: acting proactively, increasing vitality, sticking to a clear vision, building resilience, and streamlining the organization. These steps make up a playbook for how today’s leadership teams should manage the impending crisis in order to position their companies for success.
The Top Performers
To identify the companies that performed the best worldwide from 2008 through 2019, we evaluated earnings before interest, taxes, depreciation, and amortization (EBITDA) and total shareholder return (TSR) for companies in the S&P Global 1200. (See Exhibit 1.)
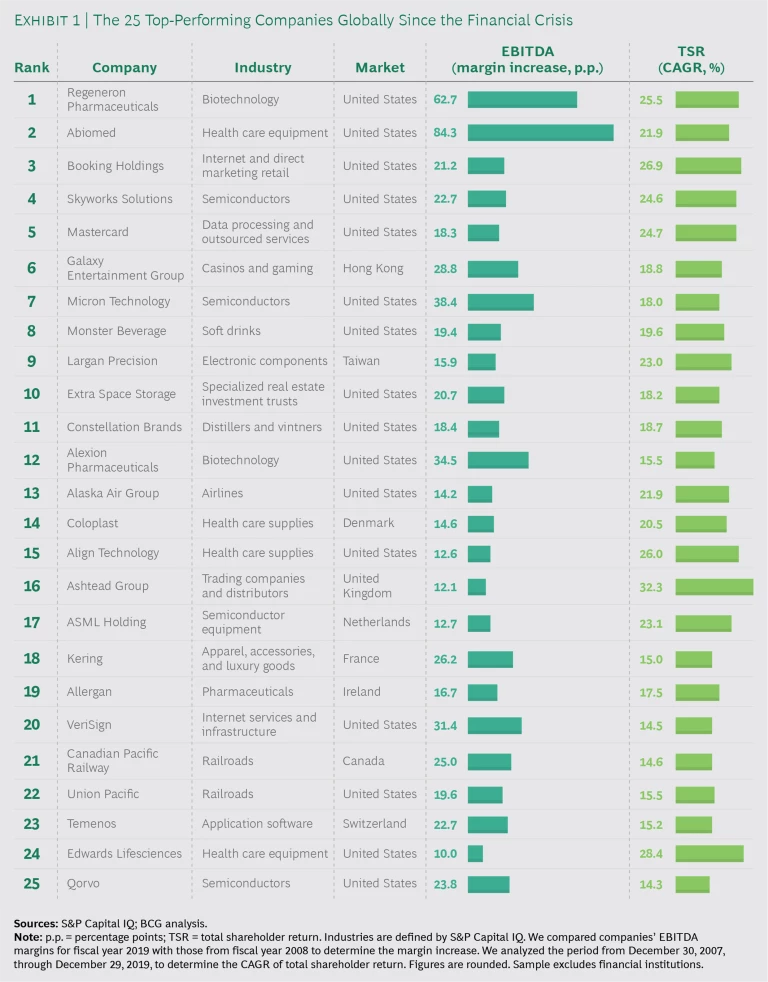
Leaders experienced as much turbulence as their competitors did. But the top 25 were able to turn their fortunes around earlier.
The 25 top performers are in a variety of industries—including biotechnology, semiconductors, and health care supplies—and they have massively outperformed the competition. These leaders increased their EBITDA margins by 25 percentage points, on average, compared with only 4 percentage points, on average, for companies in the S&P Global 1200. The TSR performance of the top 25 was just as strong, with an average annual increase of 21%, compared with a 4% average annual growth for the index.
To be clear, these leaders experienced just as much turbulence from the crisis as their competitors did. By the end of 2008, their TSRs dipped, on average, by 27 percentage points—not as big a decline as the S&P Global 1200 index, but still a dramatic plunge. But the top 25 were able to turn their fortunes around earlier, compared with the performance of the overall market. As a result, they didn’t fall as far, and they recovered faster.
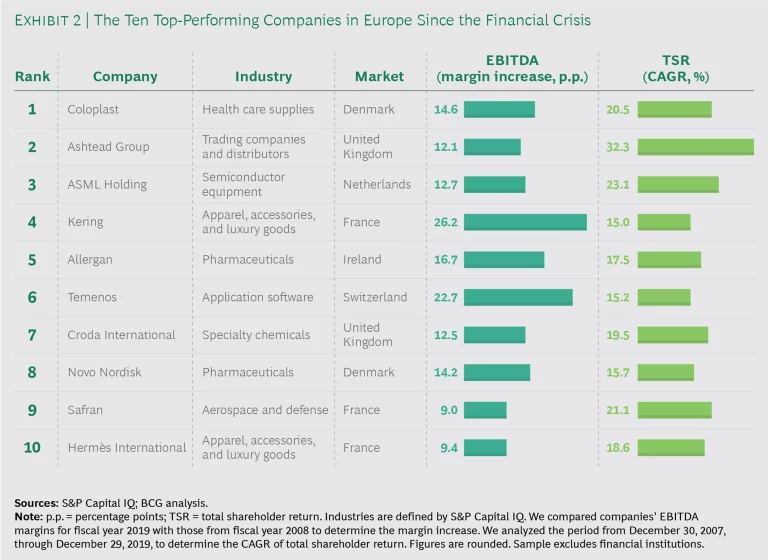
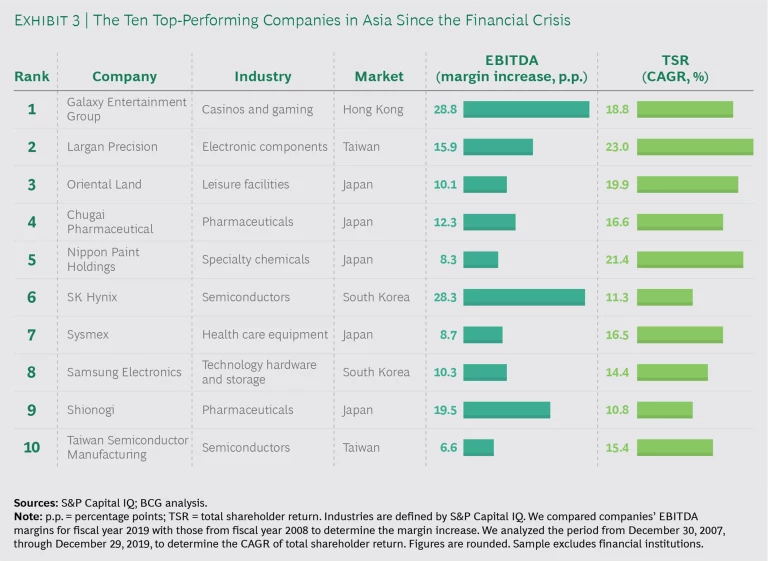
Notably, the global list is dominated by US-based companies, which represent 16 of the top 25. We also identified the top ten companies for Europe and Asia. (See Exhibit 2 and Exhibit 3, respectively.)
Different Actions During Four Phases
What accounts for the success of these companies? One key aspect is that they took different actions than their competitors did at certain points during and after the crisis. During the 12-year period, the top performers went through four phases: managing turbulence, stabilizing, revving up, and continuing to accelerate. (See Exhibit 4.) They succeeded by tailoring their strategy to the changing macro conditions in each phase.
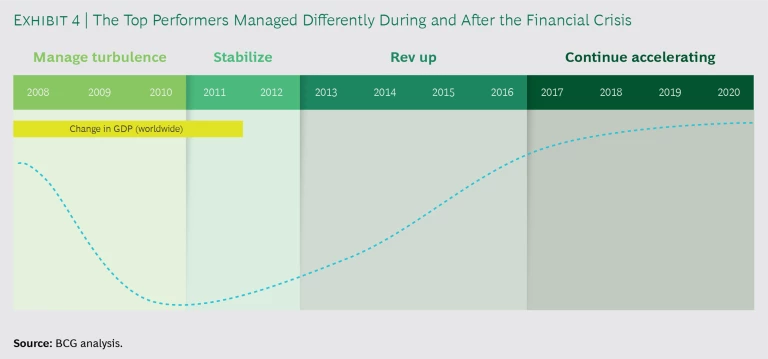
For example, during the first phase—managing turbulence—the 25 top companies were far more likely to hoard cash and maintain liquidity than companies in the S&P Global 1200 index. Cash and cash equivalents made up nearly 20% of each company’s total assets, whereas the average for companies in the index was less than 10%. The liquidity served as a cushion during times of extreme volatility, allowing the top 25 top to ride out periods of slow or nonexistent sales and giving them the means to take action quickly as soon as the market stabilized.
Similarly, when revving up, the best performers capitalized on economic tailwinds and relentlessly sought growth. From about mid-2012 through about mid-2016, these companies grew by an average of 19.5%, even as the index fell, reflecting a decline in companies’ growth (due to a sluggish global recovery). And starting in 2016, the top 25 turned their focus to innovation and making acquisitions with growth potential—in some cases drawing down their cash to fund expansion.
Five Key Steps
By analyzing the actions of the 25 top performers not only during and after the financial crisis but also before it hit, we identified five key steps that enabled these companies to rebound strongly from an economic crisis.
Act proactively. During the 2008 financial crisis, 80% of the S&P Global 1200 companies tended to act reactively rather than proactively; they waited until their businesses were directly affected by the downturn before taking mitigating actions. By comparison, the 25 top performers had not only increased liquidity but also had proactively invested in strategic acquisitions. They applied the preemptive philosophy of fix it before it breaks.
For example, Galaxy Entertainment Group, which runs casino-based resorts in Macau and finished sixth in the rankings, had taken two significant measures to strengthen its capital position before the crisis hit. First, in 2007, it sold a 20% stake to Permira, a European private-equity firm. Permira’s expertise in the global gaming and retail sectors had strategic value for Galaxy. The deal also brought in $1 billion, shoring up Galaxy’s capital base. Second, the company issued new equity shares in 2007, raising capital that was used to repay debt.
Increase vitality. In addition to being proactive, the top performers with a successful business model in place avoided the temptation to rest on their laurels. They knew that no winning approach lasts long. So, these companies increased their vitality, which we define as the ability to innovate, explore new ideas, and reinvent the corporate strategy in order to achieve sustainable long-term growth. They actively sought out promising markets and concepts, and they redesigned their development processes to get new ideas to market quickly. The vitality mindset helped these companies stay nimble and find growth regardless of how market conditions had changed.
For example, Abiomed, a US health care equipment company that finished second in the rankings, had made a large-scale pivot that positioned it for growth. In the 1990s, Abiomed was focused on developing the world’s first artificial heart. But in 2005, the company bought a heart pump technology called Impella. Impella pumps are used to help patients after some types of heart attacks. The pumps are tiny, and they can be inserted through a patient’s femoral artery in minutes (even while a patient is still receiving CPR); the pumps reduce the need for open-heart surgery. For Abiomed, the acquisition represented a major strategic shift—from heart replacement to heart recovery. Today, sales of Impella pumps account for the vast majority of the company’s revenue.
Stick to a clear vision. Even as they looked for new sources of growth, the top performers pursued the clear vision that they had before the global financial crisis—a vision that was based on a small number of long-term themes. For example, most had planned to invest heavily to expand into new countries and to digitize their processes and customer interactions. The projects to support those objectives changed because of the crisis, but the objectives themselves remained fixed, so the organization continued to have the same clear points of focus.
Booking Holdings—formerly Priceline, and third in our rankings—is a good example. The company relentlessly stuck to a few core themes: expanding its service offerings across the travel industry; sticking to digital platforms, often by making acquisitions; and growing through partnerships with established players such as Chevolet, Ticketmaster, United Airlines, and Virgin America. In 2010, the company surpassed its competition to become the world’s largest online hotel reservation service.
Similarly, Edwards Lifesciences, 24th in the rankings, is a US health care equipment company that specializes in heart valves and critical-care equipment. Much of its strong performance in the decade since the financial crisis came from strategically reshaping its product portfolio to reinforce its market-leading position in heart and valve lines and equipment for heart surgery. Since 2008, the company has made six acquisitions, all with the explicit aim of expanding into a business line or market that was related to its market focus on heart-related product lines. Even as the company was acquiring these assets, it was divesting others in noncore areas, freeing up resources that it could reallocate to more strategic product lines and services. And it maintained a high level of R&D investment, compared with the industry level, allowing it to continue innovating and expanding its product portfolio.
The top performers built organizations not only to withstand future shocks but also to anticipate them.
Build resilience. The top performers knew that they couldn’t avoid future disruptions, so they built organizations not only to withstand future shocks but also to anticipate them. For example, most top performers developed a scenario-planning function that was tasked with watching for emerging trends and potential disruptions. These companies also maintained cash reserves that were two times higher, on average, than the reserves maintained, on average, by the companies in the S&P Global 1200. This helped the top 25 keep their options open. In addition, they hired talent with a wide variety of expertise. Because of a focus on building resilience, these companies now have a diverse staff with a variety of skills and ideas and talent development programs.
For example, at Kering—a fashion conglomerate that ranked 18th and that is home to brands such as Gucci, Balenciaga, and Alexander McQueen—women make up more than 60% of the workforce and hold more than 50% of the leadership positions. Kering also has multiple international partnerships to develop the next generation of leaders in luxury and fashion. One such program trains tailors through the Scuola di Alta Sartoria Artigianale Italiana; the program comprises a three-year course and a one-year internship. In addition, Kering and the London College of Fashion are cocurators of a course dedicated to environmental sustainability in the luxury fashion sector.
Streamline the organization. Finally, top performers prepared their organizations by streamlining core operations, redesigning processes to capitalize on digital, and generating efficiencies so that they were as lean as possible before tough times hit again. That’s a more forward-looking approach than many organizations take. Many tend to rely on budget cuts and head count reductions should a crisis arise.
UK-based Ashtead Group, 16th in the rankings, had a strong market position going into the crisis. It was one of the largest equipment rental companies in its core markets of Canada, the UK, and the US. But in late 2008, the company launched a cost-reduction initiative, closing or consolidating more than 100 stores, reducing the employee count by nearly one-fourth, and scaling back the number of delivery vehicles, especially older models, leaving it with a smaller and newer fleet. That effort, in turn, reduced depreciation for the company. In all, the cost-reduction measures generated an annual savings of about $100 million.
Two Case Studies
The following case studies show in detail how two of the top performers—ASML Holding and Alaska Air Group—navigated the financial crisis and its aftereffects. As another economic downturn looms, these stories should be a source of inspiration for company leaders.
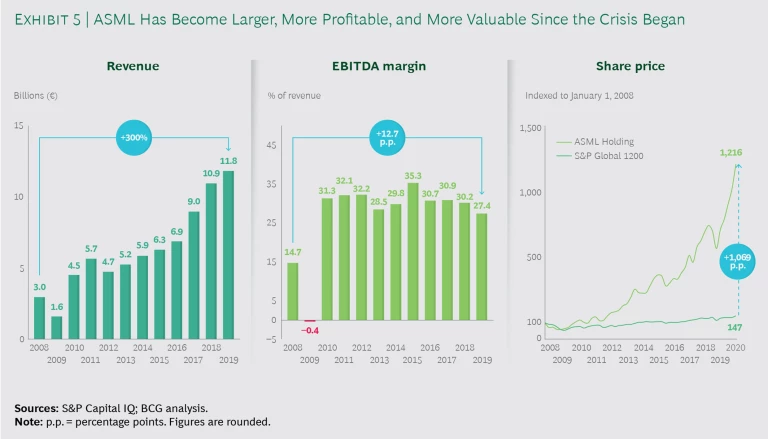
ASML Holding. You may not have heard of Dutch technology company ASML Holding, but if you’re reading an electronic version of this article, you’re using a product that incorporates its work. ASML makes lithography machines, the equipment that semiconductor manufacturers use to produce microchips. The company has more than 24,500 employees, and it supplies all major chip manufacturers in the semiconductor industry.
The company has performed extremely well since the financial crisis. (See Exhibit 5.) It finished 17th in our rankings. A key reason for that performance is that the company took proactive measures to shore up its market position leading up to and during the crisis.
In 2007, ASML had an extremely strong market position among both large and small chip manufacturers, and customer satisfaction ratings were extremely high. However, ASML—like most companies in the tech industry—was impacted by the financial crisis. When the demand for electronics slowed, ASML felt the upstream effects, as semiconductor manufacturers eased production and reduced their equipment spending. Scarce credit also limited the ability of some customers to make investments in capital expenditures. Much of the industry was in a wait-and-see mode, but ASML’s leadership team recognized an opportunity to make bold investments to reinforce its already-strong market position.
In 2008, the company deliberately outsourced the manufacturing of most components and subassemblies that made up its products, capitalizing on its strong supply chain capabilities. That allowed ASML to reduce costs and increase its R&D investments in order to deliver better end products. Overall, R&D spending increased by almost 9% in 2008, compared with 2007, helping the company develop new lithography technologies and systems that allowed customers to reduce their chip-manufacturing costs and increase yields. As a result of these investments—made during a period of broad economic uncertainty—ASML saw some of its competitors exit the market, leaving it with an even stronger market position for leading-edge lithography equipment.
ASML outsourced the manufacturing of most components and subassemblies. That allowed it to reduce costs and increase R&D investments.
In addition to its internal R&D efforts, ASML set up an innovative coinvestment program, and its three biggest customers invested nearly €1.4 billion from 2013 through 2017 to help ASML develop new chip production technology. (The customers received equity in ASML.) By pooling resources in this way, participants shared the risk of R&D efforts but could benefit from the advances.
Cost savings was another major contributor to the company’s strong performance. In 2008, ASML reduced its workforce by roughly 1,000 people (or 12%)—primarily contract employees—and shut down some production facilities for short stints in 2008 and 2009. In addition, it participated in a Dutch program that let companies reduce employees’ working hours without affecting their overall wages. (The government paid a portion of employees’ wages provided they spent their nonworking hours on training and education.) And ASML closed a training center in the US, along with several other locations, and downsized its US headquarters.
Those measures led to cost savings of approximately €30 million in 2008 and more than €200 million in 2009. More important, the slimmed-down cost structure remained in place even after sales began to pick up in the second half of 2009, leading to a sustainable boost in profit margins.
Finally, ASML sustained its fast pace of innovation owing to an explicit focus on talent. Even though it was forced to let go some contract employees during the crisis, it stayed in touch with them and actively recruited them during the recovery, ultimately rehiring about 400. That meant a faster time to value for those workers, who already understood the organization and its culture.
Like virtually all organizations, ASML needs to continually find talent that has digital skills. It has taken steps to do so, including building relationships with universities in Asia, Europe, and the US; creating training and development programs that are highly targeted to the needs of individual employees; and instituting a buddy system. Most of the organization’s culture and emphasis on talent stems from its president and chief technology officer, Martin van den Brink. One of the company’s first employees, van den Brink later led transformative advances in the optical lithography processes used to manufacture semiconductors.
Collectively, the emphasis on building market share during the crisis, investing in R&D, reducing costs, and focusing on talent throughout the crisis positioned ASML for strong performance in the decade since. Revenue has increased by 300%, to €11.8 billion as of 2019, and EBITDA margins have nearly doubled, to 27.4%. The company’s share price has increased by more than 1,100% since the beginning of 2008.
ASML’s example shows the value of taking bold action during economic uncertainty. Rather than trying to ride out the crisis, the company capitalized on it and emerged far stronger.
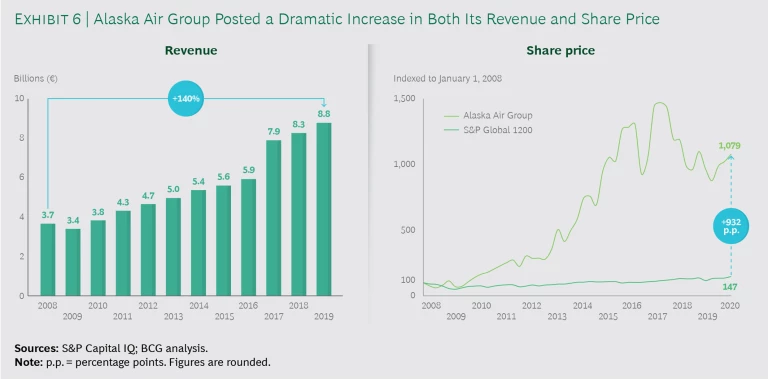
Alaska Air Group. The airline business is notoriously tough because of high capital costs and fluctuating oil prices. During the financial crisis of 2008, those challenges were even greater because consumer travel demand dropped and oil prices skyrocketed. Many airlines had to raise fares simply to cover their costs, only to see oil prices drop precipitously. In this brutal environment, however, Alaska Air Group, a US-based carrier, took proactive steps to mitigate the effects of the crisis, positively affecting its performance. (See Exhibit 6.) As a result, it finished 13th in our rankings.
To be clear, Alaska Air had some internal issues when the crisis hit. Unlike many domestic carriers in the US that have large route networks of domestic and international destinations, Alaska Air’s routes were primarily focused on northbound and southbound trips along the West Coast. That meant it had too much capacity during the travel slowdown. Alaska Air also had limited exposure to the corporate travel market, which typically garners higher fares and generates higher margins. And a new entrant, Virgin America, posed a clear threat because it would mean even more capacity and lead to aggressive pricing to fill seats.
In this environment, Alaska Air took specific steps to improve its performance. It simplified its fleet to a single type of aircraft—the fuel-saving Boeing 737—reducing complexity in maintenance, training, scheduling, and other aspects of operations, all of which allowed the company to boost internal efficiencies. The airline now had the most fuel-efficient aircraft available. Over the next five years, those changes to the fleet allowed Alaska Air to boost its available seat miles flown per gallon of fuel (a key industry metric) by 3.7%—a gain that was compounded as fuel prices fell. (Horizon Air, a subsidiary carrier of Alaska Air, currently flies two additional aircraft types.)
In 2009, Alaska Air took steps to reduce costs and boost employee productivity. It also took advantage of opportunities to expand its route network during a time when most airlines were contracting. Combined with the more fuel-efficient planes, those moves gave the airline a large and growing cost advantage in the industry over legacy carriers.
Alaska Air simplified its fleet to the most fuel-efficient aircraft, which allowed the company to boost its available seat miles flown per gallon of fuel by 3.7%.
To boost growth, Alaska Air strengthened its marketing efforts. A new ad campaign in 2009 helped, as did engaging the entire workforce to market the company. Like other carriers, Alaska Air also boosted the number of revenue-producing sources. In addition to ticket sales, it began earning revenue from in-flight Wi-Fi charges, checked baggage fees, and commissions from rental car companies and hotels when passengers booked reservations through the airline’s website.
With that liquidity, Alaska Air invested in strategic partnerships and acquisitions to expand its network coverage. In 2011, it bought the capacity of Horizon Air—an industry arrangement in which Horizon Air continued to operate and maintain its planes, while Alaska Air handled commercial aspects such as marketing and pricing, along with scheduling.
A bigger move came in late 2016, when Alaska Air acquired Virgin America. The deal made sense for several reasons, including gaining scale. After the acquisition closed, Alaska Air advanced from the ninth-largest airline in the US to the fifth largest, and it had more seats on West Coast routes than any competing carrier. But Virgin America’s assets also provided a platform for growth: the airline had a low-fare product with a strong brand, access to critical airport gates (particularly in California and along the East Coast), and international partnerships.
In 2017, Alaska Air merged the affinity programs of the two airlines, helping boost customer loyalty and retention. The airline industry often struggles to capitalize on passenger data, in part because tickets are often booked through online travel aggregators such as Expedia. But loyalty programs are a key means of fighting back; they enable airlines to retain control over the entire passenger experience—before, during, and after the flight—and gain access to critical passenger data. By using that data, carriers can better understand customer needs and personalize offerings more effectively in terms of marketing channels, price, and other aspects. At the end of 2017, Alaska Air’s loyalty program (after the Virgin America merger) represented 11% of its total sales.
The combined effect of these measures was a dramatic improvement in financial performance. From 2008 through 2019, revenue more than doubled, to $8.8 billion, and EBITDA margins increased more than 14 percentage points. Even more impressive, the company’s share price rose by almost 1,000%, nearly nine times the increase of the S&P Global 1200 index.
This report was written as the COVID-19 pandemic unfolded. Our objective was to draw on lessons from the 2008 global financial crisis and identify management approaches for handling future crises.
BCG TURN is a special unit of BCG that helps CEOs and business leaders deliver rapid, visible, and sustainable step-change improvement in business performance while strengthening their organizations and positioning them to win in the years ahead. BCG TURN helps organizations change their trajectories by turning their upside potential into radical performance gains. The BCG TURN team consists of transformation practitioners and battle-tested experts with a proven track record in large-scale transformation. BCG TURN is invested in the sustainable success of clients, with a focus on performance acceleration and a commitment to value delivered.


