
Internal funding is essential to building corporate resilience, no matter the economic environment. In a downturn, external financing can be tough to find, and in an upturn, high interest rates can make external funding expensive. Even when interest rates remain low, banks may be cautious about providing fresh capital—just when it’s needed most.
That’s why net working capital management should be an integral part of every good performance program, especially given the new opportunities for value creation offered by big data and digital analytics. And in today’s environment—with trade conflicts and an automotive downturn—it’s arguably more important than ever.
To find out how well businesses across industries and countries in Europe are managing their net working capital, we analyzed and compared data on approximately 700 companies in 15 different industry sectors and 16 countries across the region from 2013 to 2018. (See the sidebar, “Our Approach.”)
Our Approach
Our Approach
Our analysis was based on our extensive experience in the field as well as on information from a number of large databanks, including internal BCG databanks. The data covers approximately 700 companies with median revenues of around $1 billion in nearly all European industries and countries. We excluded financial institutions and insurance, as well as selected sectors from other industries, such as agriculture, software, and travel, because of either their lack of comparability or the limited number of companies in the sample.
By revenue, the largest sectors were oil and gas, with median revenues of $3.8 billion, and electric and gas utilities, with median revenues of $3.4 billion. The smallest sectors were media, with median revenues of $0.4 billion, and technology, health care providers, and consumer products, with median revenues of approximately $0.6 billion each.
We also investigated underlying macro trends in net working capital development across 16 European countries and 15 industry sectors for the period 2013 to 2018. Due to the standardized data available in the databanks we employed for our research, we were able to consistently use cost of goods sold (instead of revenues) as a denominator to derive DIO and DPO; DSO are by default based on revenues.
Why Net Working Capital?
Optimizing net working capital (NWC)—for which we use the definition of trade working capital, that is, accounts receivable plus inventory minus accounts payable—is a fundamental and powerful way to boost internal funding. When NWC is well managed, operating cash flows are stronger, supporting the ability to invest and expand; when it isn’t, companies may have trouble growing, paying back creditors, and even staying afloat.
Whether a business wants to build resilience for a downturn and cut back on external financing or take a bolder step—financing M&A, implementing new digital technologies, or starting a transformation program—optimizing NWC can support the effort and lead to greater financial flexibility.
When NWC is well managed, operating cash flows are stronger, supporting the ability to invest and expand.
A proof of concept was found in a recent BCG study that analyzed the development of German companies with especially strong performance since the last financial crisis in 2009. The study found that certain companies, which we call “comeback kids,” actively engaged in cash optimization programs during the crisis, allowing them to fund strategically important investments in the postcrisis period.
Less Painful Than Cost Cutting
Improving NWC is cheaper and less risky than eliciting new bank loans, other debt instruments, or equity, even when interest rates are low—and it is undoubtedly less painful than cost cutting, the other primary source of internal financing.
In addition, the better the NWC, the better the return on capital employed—EBIT divided by total assets less current liabilities—an increasingly important measure of how efficiently companies are utilizing their invested capital. Optimized NWC also translates into higher equity valuations for capital-markets-oriented companies. And, given that net leverage is part of the financial covenants for many debt-financed companies, optimized NWC supports compliance by reducing external borrowing. As shown in a recent BCG report on the financing of mid-cap companies in Germany, several trends are boosting complexity for debtors in Europe. These include a shift away from the dominance of traditional banks in financing midsized companies and the growing importance of new financing sources such as private equity and private debt funds—making yet another important argument for NWC optimization as a key funding source.
Note that, for the purposes of the current report, we often look at NWC optimization through the lens of the cash conversion cycle (CCC), which is defined as days sales outstanding (DSO) plus days inventory outstanding (DIO) minus days payables outstanding (DPO). Also known as the net operating cycle or simply the cash cycle, CCC attempts to measure how long each net input dollar is tied up in the production and sales process before being converted into cash received.
Improved NWC Goes Hand in Hand with Improved EBITDA
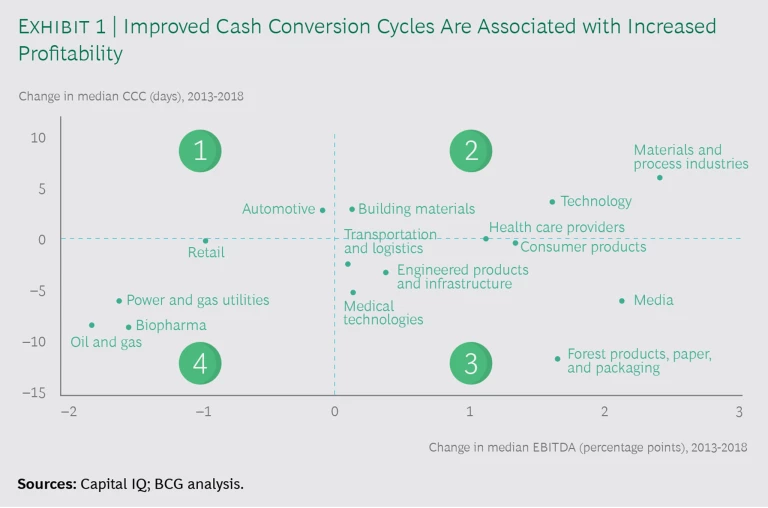
Both NWC improvement and profitability growth require thorough enhancements in core processes, so it’s no surprise that both improve when either one is explicitly addressed in a comprehensive program. Of the 15 industry sectors surveyed for this report, for example, 7 of those that improved their CCC days from 2013 to 2018 also managed to increase operating profits, as measured by EBITDA margins. (See Exhibit 1.) While EBITDA improvements in sectors such as medtech, consumer, engineering, and forest, paper, and packaging products were certainly supported by the recent environment of economic growth, companies in these seven sectors also seem to have professionalized their NWC approaches.
One reason NWC improvement and profitability growth go hand-in-hand is that rigorous process improvements are at the heart of any sustainable profit improvement program. That is, improving EBITDA performance requires a thorough rethinking of central operational elements, from customer segmentation and penetration to procurement processes to demand and production planning. As a result, there are ample opportunities to improve NWC at the same time. A transformation program that requires investments can even be funded by the NWC improvements.
While improved NWC does not correlate with increased EBITDA for all companies within a given sector, our observations suggest that tight processes for controlling NWC do support profitability improvement efforts. Performance improvement programs should therefore always include NWC optimization.
We also encountered contrary developments in our analysis. For example, the worsening CCC and rising EBITDA margins of industry sectors in quadrant 2 of Exhibit 1 appear to have been influenced by industry players trading off cash for profitability—for example, by acquiring new customers on the back of poor payment terms or generous inventory terms, such as too much consignment stock. Alternatively, flourishing companies, supported by cheap financing in a generally low-interest-rate environment, may have simply reduced their focus on the cash conversion cycle. Going forward, companies in these sectors should contemplate initiating new NWC programs (or revamping existing ones) in order to become more resilient in the face of growing economic headwinds.
Our observations suggest that tight processes for controlling NWC support profitability improvement efforts.
In quadrant 4 of Exhibit 1, the majority of players show improving CCC and decreasing EBITDA margins, as cash management appears to have been prioritized over profitability. Some of these industries have faced various challenges in recent years, from increasing online competition (in retail) to stagnating prices for oil and gas, putting EBITDA margins under pressure. As a result, liquidity in these sectors is becoming tighter and covenant headroom is shrinking because of reduced EBITDA margins and rising debt levels, making a strict NWC focus inevitable.
The developments illustrated in quadrant 1—with both KPIs deteriorating—tend to apply to companies in operational turmoil, which have less control over both profitability and cash management. This situation is often seen early in crisis and restructuring situations, when countermeasures have not yet been applied and liquidity is getting tight. Companies in the automotive industry (the only sector currently in quadrant 1) face pressure on their EBITDA margins owing to the ongoing automotive crisis, which has its origins in the slowing Chinese economy, the US-China trade war, and the burgeoning market for electric vehicles. Companies in this sector showed worsening CCC from 2013 to 2018 and should start to react, as the financial pressures will only increase.
Improved NWC and Debt Reduction
High NWC levels tend to create a burden on a company’s finances, increasing the need for external funding. We performed an analysis of net leverage and CCC days, similar to the analysis of NWC and EBITDA discussed above, and found that 9 out of 15 industry sectors supported this conclusion during the 2013−2018 period, with improving CCC and declining net leverage, or worsening CCC and increasing net leverage. Because its benefits can be realized quickly, net working capital management—especially in economically tough times—appears to be a suitable way to decrease financial leverage and thus increase headroom in financial covenants. This, in turn, can increase return on capital and send positive signals to the capital markets.
Industry Differences in NWC Management
The spread of CCC within a given industry can serve as an indicative benchmark for NWC optimization programs. In addition, country-to-country differences can highlight broad cultural and economic variations that affect NWC in general.
During the 2009 financial crisis, most industries faced a severe recession, putting strong pressure on the liquidity of individual companies. Not only did companies struggle to keep afloat, they had to improve their operations as well: increasing efficiency, reducing leverage, and becoming more competitive.
When we began our research, we therefore expected most companies to have deliberately improved their NWC management post-downturn, reducing the need for external financing while boosting cash flow and preparing the business for any subsequent downturns. And in fact we found that 11 out of the 15 industry sectors analyzed did improve CCC between 2013 and 2018, while 4 did not.
Despite the overall improvement, the ongoing availability of cheap money does reduce the pressure on companies to optimize their CCC days; as a result, we believe there may be still further opportunity for improvement. In fact, our analysis revealed that—while optimization possibilities vary both within and between industries—the opportunity may be vast, with wide spreads between the results for poorly performing companies and their industry median. This gap implies a great deal of room for below-average companies to improve.
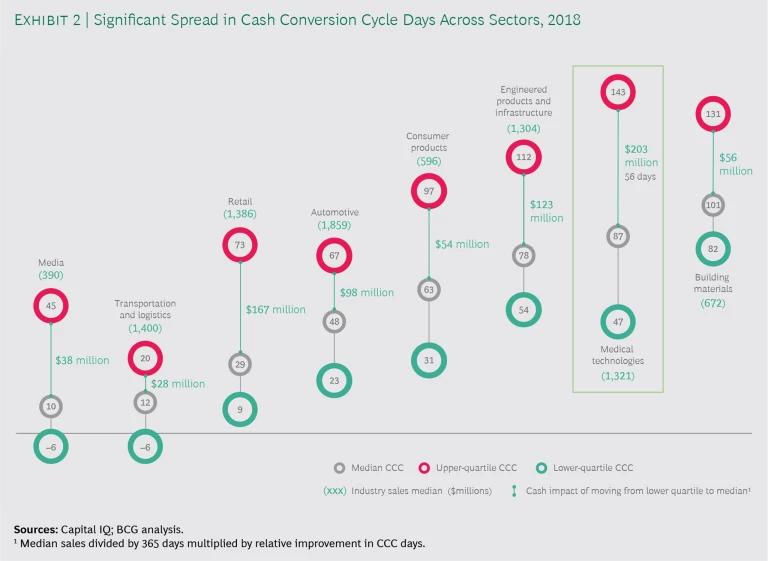
We found the greatest potential in medtech, for example, which has an approximate 56-day difference between the low-performing upper quartile, with 143 CCC days, and the industry median of 87 days. If a medtech company were to have the industry’s median revenue of $1.3 billion and a CCC performance at the industry’s upper quartile, the spread of 56 days to reach the median performance level would translate into cash potential of approximately $200 million. (See Exhibit 2.)
Of course, this data serves only as an indication, since a real-life benchmarking process for an individual company would need to account for numerous influencing factors, such as the varying business models and inherent NWC characteristics found within medtech’s different subsectors. In addition, such an exercise would not be based on the industry’s average CCC but instead would look at the individual components: DIO, DPO, and DSO.
Looking at the other sectors in our sample through the same lens, we found less potential, for instance, in the transportation and logistics sector, with only an 8-day differential between the upper-quartile CCC and the sector median. The sector’s overall spread of 25 days between lower- and upper-quartile CCC is fairly low, perhaps because of its comparably lower margins, which may force companies to keep a close watch on their net working capital.
The optimization opportunity may be vast, with wide spreads between the results for poorly performing companies and their industry median.
Explaining the Industry Differences
Our sample also implies that the level of NWC needed to run a business varies significantly among companies and industries, as does the focus placed on NWC management. There are many reasons for this, from company size to level of maturity in NWC management to structural, economic, and cultural differences.
Company Size
We found that larger companies (more than $5 billion in revenue) generally manage their NWC better than smaller players (less than $5 billion in revenue). In fact, the median CCC for larger companies during the 2013−2018 period was around 20 days less than for smaller players. This may be due to the presence of more professionalized corporate structures in larger companies. Scale effects may play a role as well, so smaller companies can learn from their larger competitors in order to catch up. Of course, size alone does not dictate the opportunity for NWC optimization; many other factors are also involved.
Structural Differences
Some industries face more intense competitive pressures than others, resulting in lower margins and, generally, a greater focus on NWC management. In addition, business models vary widely; for example, industries such as building materials hold large amounts of inventory, while others, such as media, hold relatively small amounts. In fact, a major difference among industries in our sample was the mean inventory level, as measured by DIO. Inventory-heavy industries tend to have high mean DIO levels of 80 days or more, along with similarly high mean CCC days of around 80 or more. (See Exhibit 3.)
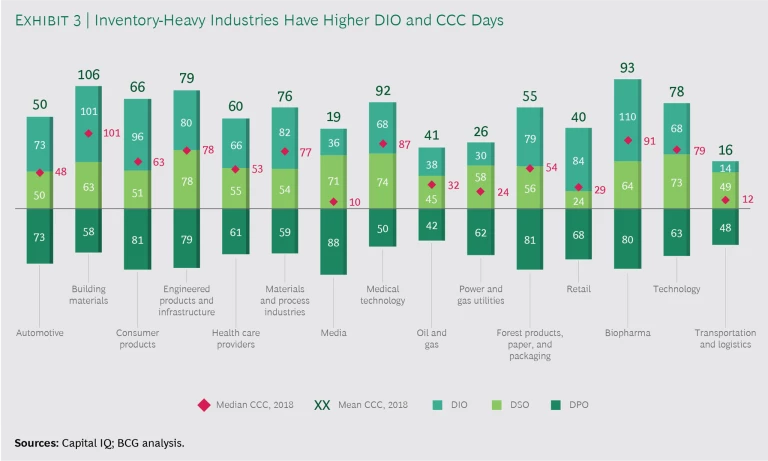
In contrast, 4 of the 15 sectors we analyzed—transportation and logistics, media, power and gas utilities, and oil and gas—are inventory-light, with very low mean DIO of 14 to 38 days. These sectors all had low mean CCCs of 41 days maximum in 2018.
These findings hold true across industry sectors, unless high inventory levels are offset by high payables days (as is the case for consumer products) or low receivables days (as is the case for the retail sector). In contrast, DSO levels are fairly stable across industries, averaging 59 days, meaning that the companies in our sample wait an average of two months before their sales turn into cash. The noticeable outlier here is the retail sector, because of the high proportion of brick-and-mortar business and hence of cash payments. As for payables (DPO), the spread ranges from a 42-day industry sector mean for oil and gas to 88 days for media, with a mean DPO of 69 days across all companies in the sample.
Clearly, the appropriate approach to optimizing NWC is highly industry-dependent and must factor in many structural differences and industry specifics if it is to be effective.
Maturity in NWC Management
When we look at absolute CCC levels and the spreads within industries, we see that some industries seem generally more mature in their NWC management than others. The automotive industry, for example, shows a high degree of automation and frequent lean management structures, which undoubtedly foster better NWC control mechanisms—even though the overall sector’s median CCC deteriorated by 2.6 days from 2013 to 2018. Likewise, the retail industry is structurally short of receivables compared with other industries, so companies tend to optimize their inventories and payables to create a clear competitive advantage. In fact, top retail performers show a very low CCC of just 9 days.
The appropriate approach to optimizing NWC is highly industry-dependent and must factor in many structural differences and industry specifics if it is to be effective.
Economic and Cultural Differences
National differences in NWC can also be ascribed to cultural and economic factors. For example, DPO in Northern Europe tend to be shorter than those in Southern Europe, where it is quite common—and socially acceptable—to pay after 90 days; in contrast, companies in Northern Europe tend to adhere to shorter payment terms. In addition, economic structures tend to vary, with some countries—such as Germany—being industry-heavy, while others are more service- or tourism-oriented. As a result, CCC and its components differ significantly among countries, just as they do among industries. Manufacturing- or production-heavy countries, for instance, generally have higher DIO compared with those that are more service-oriented. In addition to factoring in industry specifics, programs to optimize NWC should therefore account for the footprint of customers and suppliers when calibrating benchmarks in an international context.
Realizing NWC Potential
Although the potential to improve NWC clearly varies significantly between industries, it remains vast. But it demands much more than just wringing additional cash out of the business’s operations. It must also include a thorough rethinking of the company’s central operational elements—a process that begins with an in-depth analysis of operations and industry specifics. This process is crucial to developing a tailored approach—one that pursues the most effective initiatives and achieves the business’s full NWC potential.
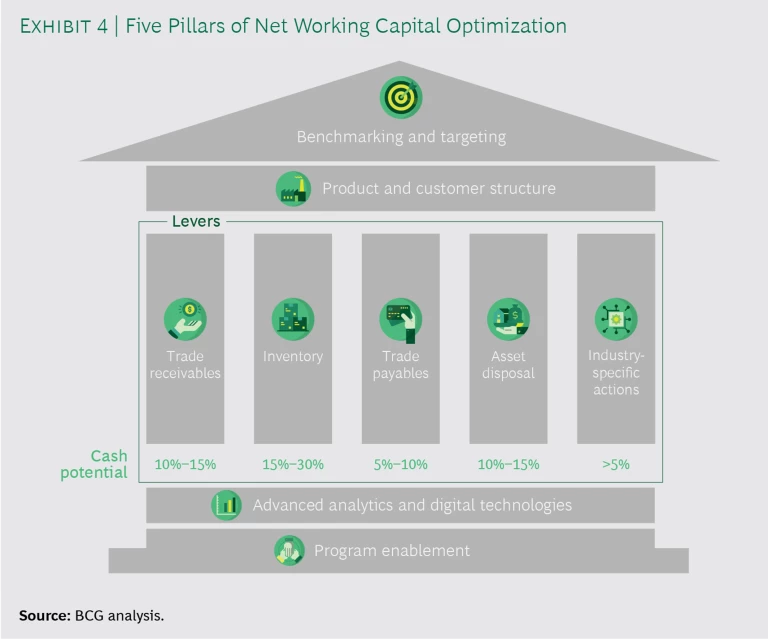
We recommend applying a structured framework that integrates all possible levers—of which there are over 100—into a single, well-defined approach. Such a process typically results in improvements in trade receivables of 10% to 15%, in inventories of 15% to 30%, in trade payables of 5% to 10%, and in asset disposals of 10% to 15%. In addition, industry-specific initiatives can bring further benefits that do not fall into those categories, such as a reduction in cash “trapped” in offshore accounts. (See Exhibit 4.)
Benchmarking and Targeting
Companies should first conduct a baselining exercise for their NWC components across geographies, business units, segments, and—if need be—products in order to identify both cash-burning and cash-generating areas. In addition, they should carefully segment and review their customer base to assess cash contributions on an individual basis. These exercises will allow them to identify key pain points as well as major areas for improvement, which may include any and all NWC components, depending on the company’s processes and business model.
In parallel, companies should set an overall ambition level based on external benchmarks, such as those derived from a BCG benchmarking database, and internal benchmarks from individual business units and segments of the company. They can also use a time-series analysis of current and historical performance to arrive at the company’s best historical performance.
Based on these analyses, companies can derive NWC targets broken down into regions, divisions, and customer segments.
Cash Generation
Companies can use their NWC targets to generate initial hypotheses regarding the most promising initiatives to pursue across trade receivables, inventories, trade payables, assets, and industry specifics. They can then cluster those with the biggest potential impact into categories—such as short-term versus long-term effects and one-time efforts versus ongoing efforts—and evaluate them for both financial benefit and ease of implementation.
Advanced Analytics and Digital
Companies should support their NWC programs with new digital tools, such as NWC dashboards, advanced analytics, machine learning, and operational apps, in combination with the vast amounts of data available within their ERP systems. There are several use cases for advanced analytics in NWC optimization programs.
Transaction Data. New data processing methods and analytical tools create opportunities for companies to move beyond a simple view of various accounts on specific reporting dates. Instead, they can use and analyze data from numerous transactions over a specific time period, allowing them to identify patterns in their receivables and payables. For example, they may uncover on an individual customer or supplier basis the exact points in time when orders were placed and cash was received or paid, measured as exact days to cash (DTC) instead of simple DSO and DPO. On the basis of all this data, companies can define a value pool and target it with appropriate initiatives along the entire order-to-cash and purchase-to-pay cycle.
Companies should support their NWC programs with new digital tools, in combination with the vast amounts of data available within their ERP systems.
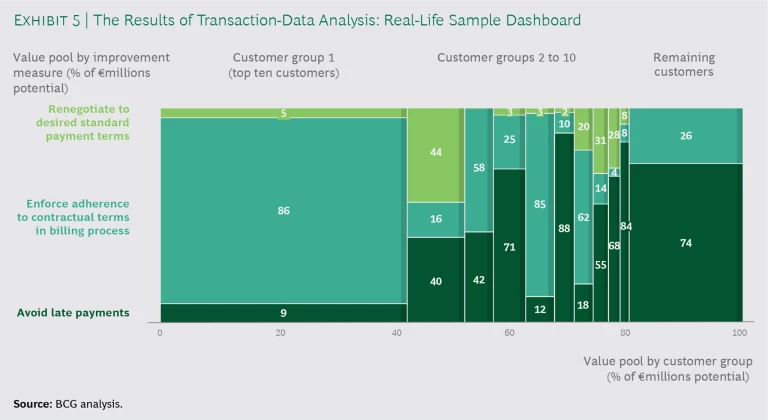
For example, one company recently analyzed the transaction data for its receivables from previous years on a customer-by-customer basis. It compared contractual payment terms with the terms entered into its IT systems, the terms stated on invoices, and finally, the actual days to cash. This allowed the company to renegotiate and standardize its payment terms, update them in its IT system, and ensure that invoices were sent out correctly. It also looked at the validity of early-payment discounts and used the analysis to end unjustified discounts. (See Exhibit 5.) A similar exercise can be done on the payables side, helping to avoid early payments to suppliers and optimize early-payment discounts.
NWC Dashboards. The optimal use of transaction data requires data generation, cleansing, and aggregation from multiple sources and therefore involves a good amount of effort. Companies should not regard their work with this data as a one-time exercise. Instead, they should use transaction data to continuously track the success of their initiatives and develop KPIs and value creation opportunities.
NWC dashboards (such as the one illustrated in Exhibit 5) are an excellent way to make use of the available data and display it in meaningful ways, such as with days-to-cash and late-payment overviews, overdue and dispute analyses, an early-payment monitor, and payment-run analyses—all tools that can help NWC managers do their jobs effectively. In the example cited above, for instance, the company was able to use a days-to-cash “cockpit,” or graphic illustration, to visualize its DSO potential by business, geography, customer, and initiative in order to prioritize areas for improvement.
Advanced Analytics and Machine Learning. Companies can use transaction data not only to spot potential value and track long-term impact but, with the help of advanced analytics and machine learning, to make predictions, such as which customers will be late payers. Patterns from the past can be used to predict behavior in the future. For example, one company found that a certain customer always delayed payment at the end of the quarter. Further investigation revealed that, for capital markets reporting purposes, the customer performed some end-of-quarter window dressing. To address the issue, the company simply changed the timing of invoices to minimize open invoices at the end of the quarter and began sending early reminders before invoices were due.
This is just one example of the many ways in which companies can use predictive modeling and combine it with concrete actions. Of course, the possible applications of advanced analytics and machine learning are not limited to accounts receivable but can generate benefits along the entire cash conversion cycle.
Operational Apps. While NWC dashboards help central teams monitor NWC levels, discover potential levers, and oversee improvements, operational apps can be deployed to help the business operate more efficiently and execute more measures locally. NWC management typically involves a broad range of people, from departments across the organization. Sales staff, in particular, will be tasked with approaching different customers to remind them of payments due. One way to facilitate this effort is to use an app that weekly informs the business which customers are overdue and why, or which customers may become overdue given the results of predictive modeling. Based on this information, the business can take concrete actions.
Program Enablement
Equally important, businesses should establish the right corporate mindset, one that makes NWC optimization a top priority across the organization—a priority that is clearly distinguished from, and balanced against, the company’s profit targets. This will require dedicated teams empowered to act by top management. Moreover, companies must communicate the new CCC targets, including them in incentive structures that make cash generation a part of total compensation.
Businesses should establish the right corporate mindset, one that makes NWC optimization a top priority across the organization.
Based on the newly defined targets and with the right teams in place, companies should perform an in-depth analysis of the value chain and industry factors that affect the CCC in order to develop the general initiatives into concrete, trackable measures with assigned timelines, responsibilities, and quantified effects. This step is crucial to creating a truly tailored approach.
Program enablement should also safeguard implementation and avoid a gradual erosion of impact. We therefore recommend setting up an “activist” project management office that not only tracks and reports on the status of the work but also challenges those responsible at each step, defines countermeasures in case of deviation from targets, and ensures cross-functional alignment and collaboration.
When to Take Action
Overall, net working capital optimization is a sensible approach in any corporate situation, but it requires a thorough rethinking of the company’s central operational elements. In our experience, such projects are best suited to situations in which funding will be needed in the short to medium term and external financing is not an option—or not the preferred choice.
Exemplary situations include the beginning of a strategic transformation program; the identification of a lucrative acquisition target; the expectation of organic growth; the advent of a challenging financing situation, such as a looming covenant breach; or a toughening business environment, with cash becoming an issue.
Every company has unique net working capital needs—and thus requires a unique approach to optimization. Benchmarking is extremely helpful, providing a range of relevant performance data for the industry and region. But only by combining this exercise with a close analysis of internal operations and specific business and industry characteristics will a company be able to find the most appropriate path—one that pursues the most valuable initiatives and helps it realize the full potential of its net working capital.


