
Agribusiness has faced a challenging environment for value creation in recent years. The 40 global agribusiness companies in BCG’s Value Creators sample generated an average total shareholder return of 7% annually from 2012 through 2016—lower than all but two other industry groups surveyed. (TSR is the annual percentage return to owners, which comes from capital gains plus any dividends.) This performance is a 180-degree turnaround compared with 2007 through 2011, when the agribusiness industry’s TSR was higher than that of every other industry surveyed.
What triggered this sharp reversal in performance? How can agribusiness companies regain momentum and create outsized returns for their shareholders?
For many agribusinesses, depressed prices for agricultural commodities have been the main factor impeding value creation. Corn prices, for example, have fallen by more than 50% since 2012. In the US, the collapse of commodity prices has driven down net farm income to less than half of the peak reached in 2013. The resulting pressure on farmers’ economics has reduced margins for farm inputs, such as seeds and equipment.
Fertilizer producers have been hit the hardest: after leading the agribusiness peer group in TSR from 2007 through 2011, these companies have seen falling fertilizer prices drive negative TSR. Processed-protein producers became the top TSR performers, as higher feed-to-price ratios for livestock promoted stronger revenue growth and higher operating margins. An increase in valuation multiples across industry subgroups reflects the market’s expectation that a cyclical recovery of commodity prices will boost performance over the long term. After a steep decline, M&A activity appears ready to rebound. The combined deal value of mergers pending approval in 2017 is more than that of all mergers completed during the previous ten years.
To sow the seeds of recovery in this challenging economic environment, agribusiness executives must recognize that creating value for shareholders goes hand in hand with creating value for farmers. Leading companies focus their R&D investments on innovations that drive fundamental improvements to farmers’ economics. They also develop integrated offerings that make it easier for farmers to choose the right combination of products and services. The top value creators manage their own costs aggressively by avoiding excessive investments in low-value areas and continually improving operational efficiency. These leaders also rigorously target M&A opportunities to achieve their strategic and operational objectives.
Agribusiness Performance Is Tied to Farmers’ Economics
Farmers’ economics are the starting point for assessing the fundamentals of the agribusiness industry. In many regions, rising costs and falling agricultural-commodity prices have combined to drive steep declines in net farm income. In the US, for example, many farmers of corn, cotton, and soybeans have seen total costs exceed the value of production in recent years. Farm indebtedness has risen sharply, forcing farmers to delay or refocus investments. Given projected increases in fuel costs and rising interest expenses on higher debt levels, the US Department of Agriculture forecasts that farmer spending on inputs (seed, fertilizer, and chemicals) per acre will remain flat in the coming years.
Many farmers will continue to operate at a loss, as few catalysts exist to lift commodity prices above their current depressed levels. Corn is a case in point. The long-term trend suggests that prices, adjusted for inflation, are settling at a floor. Consistent with this, analysts expect corn prices to remain range-bound at low levels in the near term. Favorable crop conditions in the US have resulted in strong yields and large amounts of existing stock, while forecasts for Brazil show early signs of record-breaking production in 2017. Demand for ethanol fuel, produced from corn, has been seen as promoting higher prices, but demand growth is likely to stay flat or decline.
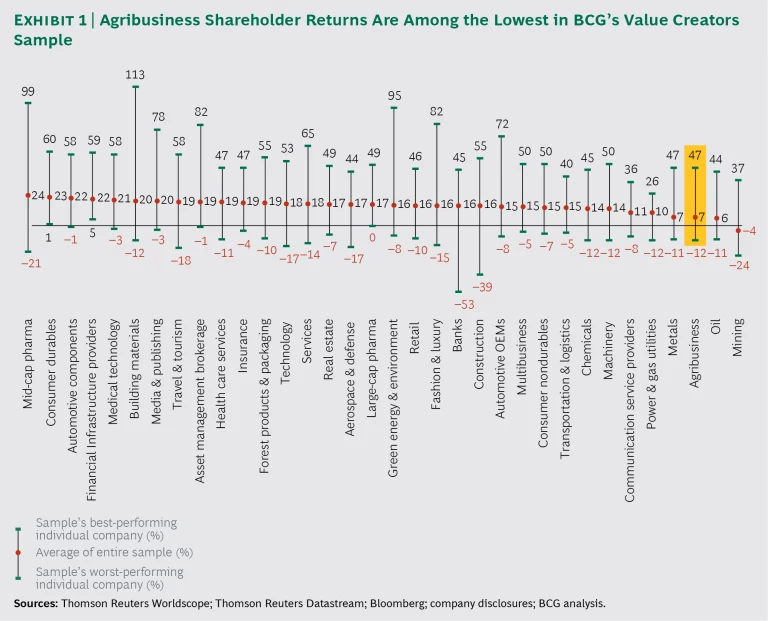
Given farmers’ financial stress, it is no surprise that many agribusinesses that sell to farmers have struggled to create value. As noted, the average annual TSR for agribusiness companies was 7% from 2012 through 2016. (See Exhibit 1.) During this five-year period, the S&P Global 1200 index gained 11% annually (the long-term historical average for equities is approximately 9%). Among the other industries surveyed in BCG’s annual Value Creators report, only the oil and mining sectors, similarly suffering from depressed commodity prices, had lower average annual TSR over that five-year period.
With no major shift in the industry’s economics on the horizon, what can agribusinesses do to create value for shareholders? As top-performing agribusiness companies understand, the answer lies in creating value for farmers.
Understanding the Sample
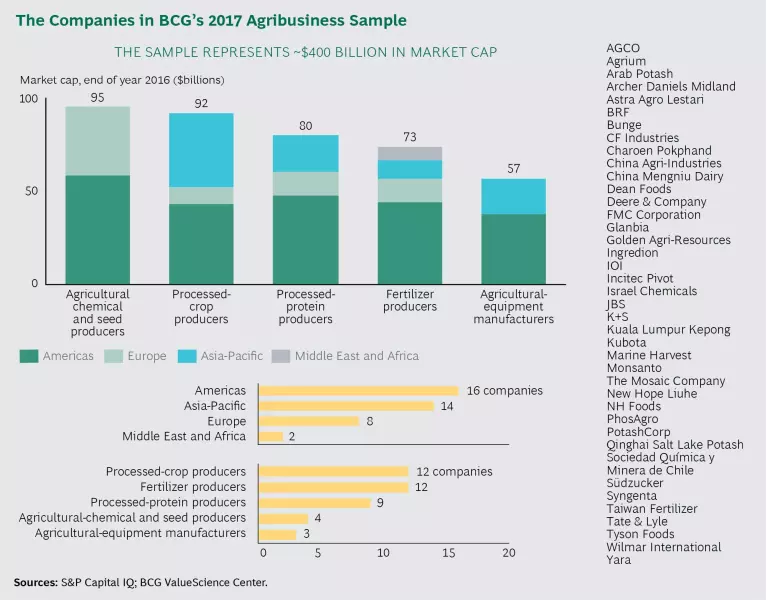
The BCG Value Creators sample of agribusiness companies consists of public companies that generate most of their revenues from the direct production of agricultural inputs (such as seeds) or outputs (such as processed meat). These 40 pure-play agribusiness companies include a mix of developed- and developing-market organizations with market capitalizations from $1 billion to more than $40 billion. (See the Appendix for a list of the companies in our sample.)
Because of the criteria used, the sample leaves out some important entities that play key roles in the agribusiness value chain:
- State-owned enterprises, such as Belaruskali and COFCO
- Private companies, such as Cargill, J.R. Simplot, and Koch Industries
- Diversified companies with significant agribusiness activities, such as DuPont, Dow Chemical, BASF, and Bayer
- Companies that do not create value primarily through agricultural activity, such as Hormel and Fromageries Bel, which have large consumer-focused businesses
- Cooperatives, including Fonterra, Land O’Lakes, Dairy Farmers of America, and CHS
- Farmers themselves: large- and small-scale producers of agricultural commodities
The sample is divided into five subgroups: processed-protein producers, agricultural-equipment manufacturers, agricultural-chemical and seed producers, processed-crop producers, and fertilizer producers. These subgroups are diverse in their business models. For instance, the agricultural-chemical and seed subgroup is R&D intensive, focused on discovering new traits, molecules, and formulations, while the fertilizer subgroup is more capital intensive, focused on achieving the best possible use of physical assets. The subgroups also have very different industry structures: the agricultural-chemical and seed subgroup is highly concentrated, for instance, while the processed-protein subgroup is far more fragmented.
Five-Year TSR Performance
BCG uses the lens of TSR to measure a company’s value creation over time. TSR can be expressed as a total or it can be broken down into its drivers—such as fundamental performance (a company’s profits and cash flows) and investors’ expectations (the valuation multiple applied to those profits and cash flows).
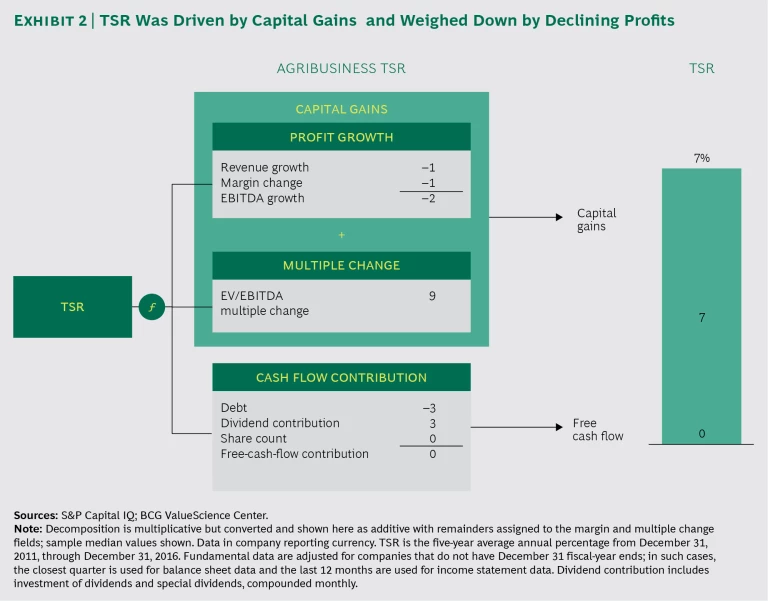
For the overall agribusiness sample, the valuation multiple—the ratio of enterprise value (EV) to earnings before interest, taxes, depreciation, and amortization (EBITDA)—contributed 9 percentage points to TSR from 2012 through 2016. The fundamental return (sales growth and margin change plus cash flow) reduced shareholder returns by 2 percentage points, producing the average annual TSR of 7%. (See Exhibit 2.) Negative sales growth and shrinking EBITDA margins reduced TSR for all subgroups, except processed-protein producers. Net debt increased by 67%, diluting TSR by 3 percentage points. The overall sample’s ratio of debt to EV increased from 0.2 to 0.3, while the ratio of debt to EBITDA—a common measure of company leverage—grew from 1.8 to 3.2.
The top ten agribusiness companies each had average annual TSR greater than 13%. These top performers provided shareholders with an approximately 3.5 times return on investment from 2012 through 2016, while the rest of the sample generated barely any return on investment. Sales growth and an increase in valuation multiples were the most important factors contributing to the TSR performance of the top ten, seven of which are processed-protein producers.
A note on methodology: for companies whose shares trade in a currency different from the one used for financial reporting, we converted all values to the reporting currency in calculating TSR. This methodology, while necessary, mixes the effects of corporate value creation with the effects of investors’ implied positions in currency exchange rates. Depending on exchange rates, the methodology may result in a company’s TSR being inflated or depressed. For example, PhosAgro, a Russia-based fertilizer producer, reports its financials in rubles but trades in US dollars. The company had an especially high average annual TSR of 35% owing to the ruble’s deterioration during the five-year period covered by our analysis. Reversing the methodology to convert financials to trading currency results in an average annual TSR of 19% for the company. Companies that report in US dollars but trade in currencies that have depreciated against the dollar have lower average annual TSR as a result of this methodology. These companies include Agrium, Golden Agri-Resources, and Wilmar.
Subgroup Performance
Among the five subgroups, only processed-protein producers outperformed the overall market in terms of average annual TSR from 2012 through 2016, while only fertilizer producers had negative TSR. (See Exhibit 3.) This performance reflects the dramatic shift in industry profit pools since 2011.
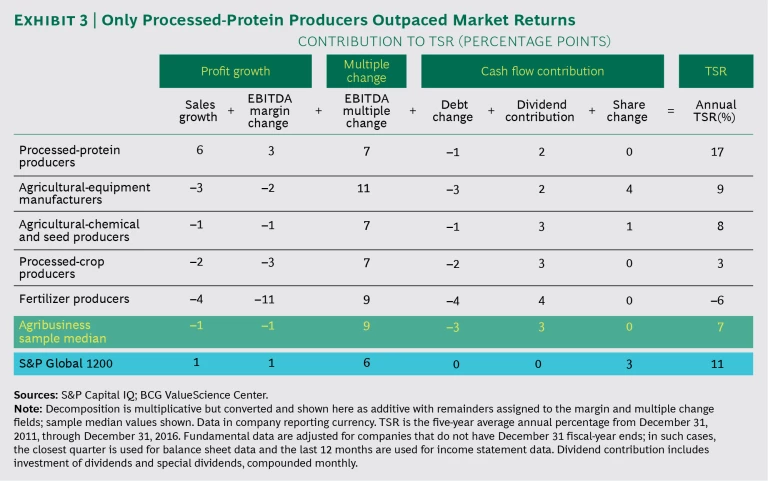
Processed-Protein Producers. The protein-processing group generated the highest return in the sample: 17%. This TSR was driven by the highest contributions from revenue growth (6 percentage points) and EBITDA margin improvement (3 percentage points) among the subgroups. These companies’ profit growth was due to protein prices having outpaced prices for animal feed. From 2012 through 2016, the ratio of output value over input prices rose by 66% for beef, 47% for poultry, and 15% for pork. Fish prices rose even more dramatically, with Norwegian salmon prices almost tripling. (See the sidebar “Value Creation in Aquaculture.”)
Value Creation in Aquaculture
Aquaculture—the cultivation of aquatic animals and plants—has been the fastest-growing food production sector over the past 20 years. Spurred by consumer demand for seafood, most notably in China and Russia, and steadily declining natural fish supply, the global aquaculture market is expected to continue growing at 4% to 5% per year over the next eight years.
Value creation in the industry has been price-driven in recent years. Record-high salmon prices have generated TSR of 45% to 60% since 2012 for salmon producers, such as Marine Harvest. Higher prices were caused, in part, by sea lice outbreaks in Norway and algae blooms in Chile, which decimated the global supply of salmon in 2016. Prices are expected to stabilize in the coming years, so aquaculture companies will likely need to improve industrialization, mechanization, and efficiency in order to promote value creation going forward. To enable long-term sustainability, companies must also address mounting consumer concerns over the environmental impact of fish farming.
Processed-protein producers include companies that produce meat, dairy products, and fish—three very distinct markets. Even within the meat category, there are significant differences in the methods and cost structures of chicken, pork, and beef production. But despite these differences, expenses for all protein processors are largely a function of the cost of animal feed. Agricultural commodities, such as corn and wheat, are the main ingredients of livestock feed. Thus, the decline in crop prices has helped protein processors thrive, and they are the only subgroup posting positive margin growth in our sample.
Global trends related to wellness and environmental protection will have a significant impact on protein producers in the coming years, as consumers continue to seek healthier proteins and protein alternatives. Tyson Foods recently became the first major meat company to seriously investigate protein alternatives, with an investment in Beyond Meat, a company that produces a vegan protein alternative. Although global food demand is increasing, protein producers must be prepared to adapt to shifting consumption patterns.
Agricultural-Equipment Manufacturers. The agricultural-equipment subgroup generated a 9% TSR. Despite negative sales growth and shrinking EBITDA margins, this subgroup’s EBITDA multiple contributed a sample-leading 11 percentage points to TSR—an indication that investors see better days ahead.
However, the recent sharp decline in agricultural commodity prices does not bode well for agricultural-equipment producers in the short term. Farmers tend to spend more on equipment when agricultural-commodity prices are high. But they can delay equipment purchases only temporarily, no matter how low commodity prices may be. Farmers’ somewhat inelastic demand for farm equipment explains why TSR for the subgroup has not shifted significantly over the past five years.
Kubota’s 23% TSR makes it an outlier among agricultural-equipment manufacturers. Revenue growth, driven by a weakening yen and a well-executed global M&A strategy, contributed 10 percentage points to this return, while margin expansion stemming from organizational restructuring accounted for an additional 5 percentage points.
The future performance of agricultural-equipment companies will depend in large part on the success of their innovation pipelines and on their ability to respond to disruptive digital technologies. Innovation in precision data collection and cloud-based storage and transfer protocols, as well as improved analytics capabilities, present both threats and opportunities, with the boundaries between agricultural-equipment companies and new competitors in construction machinery and robotic defense technology becoming more and more blurred. Faced with market uncertainty, companies must increasingly turn to innovation as a means to sustain growth.
Agricultural-Chemical and Seed Producers. EBITDA multiple and free cash flow contributed to this subgroup’s five-year TSR of 8%. The amount of cash returned to shareholders increased despite the sector’s heavy R&D expenditures. For example, since 2012, Monsanto has maintained its extensive R&D budget of $1.5 billion per year, while returning more than $12 billion to shareholders through dividends and share repurchases.
This subgroup’s TSR was in the midrange compared with the rest of the subgroups, reflecting these producers’ importance at various stages of the agricultural production chain. Farmers purchase seeds annually and apply agricultural chemicals both preemergence and postemergence. As a result, the demand for seeds and agricultural chemicals is less sensitive to commodity prices than the demand for other subgroups’ products.
Although the business models within this subgroup are diverse, the industry has seen a wave of consolidation, with three megadeals recently announced: Dow and DuPont, ChemChina and Syngenta, and Bayer and Monsanto. As we discuss below, if and when these mergers are completed, the newly formed companies will represent over two-thirds of the already concentrated agricultural-chemical and seed market.
The health of this subgroup’s R&D pipeline is critical to its success. New products must demonstrate significant benefits to farmers in terms of yield or cost reduction. Innovations should focus on applying predictive analytics to help farmers optimize inputs, reduce costs, and increase yields. Monsanto’s Integrated Farming Systems research platform, for example, offers proprietary prescription and decision-making algorithms to improve recommendations to farmers. These insights address some of farmers’ key concerns around crop protection, fertility, and water availability.
Processed-Crop Producers. The crop-processing subgroup generated only a 3% TSR. A 7 percentage point contribution from EBITDA multiple offset the dilutive impact of other factors. Two-thirds of the companies in the subgroup sample suffered from negative sales growth over the period.
Crop processors can be both buyers and sellers of agricultural commodities, so fluctuations in commodity prices have varying effects on them. When commodity prices are high, crop processors are able to charge customers higher prices to offset higher input costs. When commodity prices fall, as in recent years, price increases that were passed along to the customer may or may not stick. This illustrates the importance of innovation for crop processors, as high prices are justifiable for value-added products that have been enhanced through processing.
Ingredion had the subgroup’s highest average annual TSR: 21%. The high returns were supported by contributions from EBITDA margin and cash flows. Value-enhancing acquisitions and a growth strategy focused on specialty ingredients promoted margin expansion, while consistent dividend payouts and share repurchases returned cash to shareholders.
Archer Daniels Midland’s TSR of 13% was the second highest in the subgroup. The company has collaborated with a variety of partners to test new technologies for value-adding processes. For example, startup Ginkgo Bioworks is helping ADM develop custom strains of microorganisms used in the production of cultured ingredients.
Fertilizer Producers. Fertilizer prices have dropped by 40% to 50% since 2011, driving an annual average TSR of –6% for the fertilizer subgroup. The price declines began as China, the world’s biggest fertilizer consumer, capped fertilizer consumption growth at 1%, targeting 0% growth by 2020. As noted, depressed commodity prices have also weighed on farmer economics, constraining both volume and price growth for fertilizer producers. Revenues are down 26% since 2011, while input costs (cost of goods sold as a percentage of revenue) have increased by 3 percentage points, from 64% to 67%.
Given this painful set of figures, it is no surprise that negative profit growth dragged down fertilizer producers’ TSR from 2012 through 2016. Negative sales growth reduced TSR by 4 percentage points and shrinking EBITDA margins diluted returns by 11 percentage points. However, this subgroup’s EBITDA multiples contributed 9 percentage points to TSR, signaling that investors believe fertilizer prices will eventually rebound.
The pace of M&A activity has been slow in the past few years, but megadeals are on the horizon, such as the proposed merger of equals between PotashCorp and Agrium. M&A may well play a significant role for fertilizer companies as the industry consolidates to generate additional cost savings.
Although fertilizer prices typically exhibit a strong positive correlation with underlying crop prices, the cost of producing fertilizer varies depending on the nutrient type. There are three primary types of crop nutrients: nitrogen, phosphate, and potash. Each has distinct production processes, cost structures, and industry dynamics—and many companies produce more than one type of nutrient.
Nitrogen producers (such as CF Industries, Yara, and Incitec Pivot) use a chemical process for production; natural gas is their primary feedstock and cost driver. The combined effects of the shale gas revolution and the Great Recession led to a sharp decline in natural-gas prices in North America. While prices have remained low during the past five years, this has not sufficiently offset nitrogen producers’ decreasing revenues, resulting in a low TSR.
The cost structures of potash producers are complex and determined primarily by fuel prices, resource taxes, and labor costs. However, potash prices have declined dramatically over the past few years owing to a wave of increased production. Price declines also resulted from the breakup of groups such as Belarusian Potash Company, which had managed production to keep potash prices high. New production capacity continues to be developed for potash, which has hurt returns for potash producers. Several of these companies are among the worst performers in the sample, with negative TSR.
Phosphate producers have even more complex cost structures than those of potash producers. In addition to energy and labor costs and resource taxes, a large portion of the cost structure consists of chemical inputs, specifically nitrogen and sulfur. Many phosphate producers, including Agrium, Mosaic, and PotashCorp, also produce potash.
Coming Soon: The M&A Revival
M&A activity reached a record high in 2011 but slowed dramatically thereafter among the companies in our sample, and the average deal size declined. Deal premiums doubled, on average, dampening the prospects for M&A-led value creation. M&A activity was especially subdued in 2016, with many companies appearing to be taking a wait-and-see attitude pending the approval of four megadeals. (See Exhibit 4.)
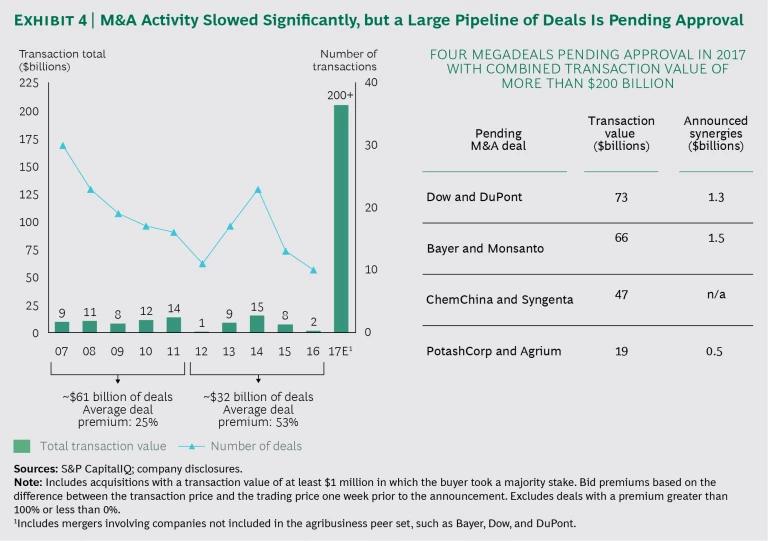
These proposed mergers have resulted in a large pipeline of deals (exceeding $200 billion in value) involving agricultural-chemical and seeds producers pending approval in 2017. Although three of the “Big Ag” players involved in pending deals—Bayer, Dow, and DuPont—were excluded from our TSR sample owing to their diversified businesses, it is important to understand what is motivating the industry’s largest players to join forces. Big Ag players have not escaped the effects of farmers’ constrained economics. Farmers’ price sensitivity has driven down revenues and margins, while R&D productivity has declined and R&D costs steadily increased. Faced with these challenges, the large players are combining in order to achieve a variety of objectives, including:
- Capturing cost synergies through increased scale and reduced selling, general, and administrative expenses
- Gaining the ability to provide a fully integrated seed-and-chemical offering to farmers
- Enabling growth through geographic expansion
- Increasing R&D effectiveness and reducing time to market for new offerings
If all three megadeals involving agricultural-chemical and seed producers are approved, the newly created companies will control nearly 70% of the global pesticide market, more than 60% of commercial seed sales, and 80% of the US corn seed market. Not surprisingly, the regulatory scrutiny has been intense in the US and Europe. The proposed combinations have raised questions about how greater market concentration would affect companies’ incentive to innovate and the prices they charge farmers for their products and services.
The outcome of the regulatory process will dictate how the broader market is affected. Given the requirement for divestitures, other large players (such as BASF) will have an opportunity to create value by acquiring strategic assets. For example, FMC Corporation’s market value soared by more than $1 billion (15%) on the day it announced its acquisition of a portion of DuPont’s crop protection business on favorable terms. In contrast, those companies that are unable to find the right M&A partner may miss a significant opportunity and find themselves at a competitive disadvantage.
Regulators are believed to be seeking guarantees to end customers from the consolidated entities in order to ensure that there will be minimal or no price increases. Such guarantees would protect farmers while placing further price pressure on agribusinesses. Similarly, regulators have pushed the merged companies to commit to minimum levels of R&D spending despite redundant products, which could lead companies to shift more R&D spending toward cutting-edge innovation in a quest for higher returns on investment. (See the sidebar “Placing Big Bets on Agtech.”)
Placing Big Bets on Agtech
Farmers’ depressed economics have not dampened enthusiasm for investments in agriculture technology, according to a recent BCG report. (See Lessons from the Frontlines of the Agtech Revolution, BCG Focus, October 2016.) This study of investment levels, priorities, and strategies included a survey of senior leaders at many of the world’s largest agribusiness companies and, for comparison, investment professionals at leading agtech-focused venture capital firms. We also conducted a detailed analysis of agtech patent activity since 2010. Among the key findings:
- In 2015, the combined agtech investments of agribusiness companies and early-stage investments of venture capital firms totaled an estimated $20 billion to $25 billion—an all-time high. This represents 4% to 7% of company revenues, depending on the agribusiness sector. Most respondents expected investment levels in 2016 to match or exceed those of 2015.
- Three-quarters of executives cited a technology that fosters data-enabled agriculture as a top investment priority. Building big data and analytics capabilities is the key focus for these executives.
- Executives reported that their company’s investment strategy is primarily defensive, evolutionary, and conducted in-house. A lack of internal capabilities was the most commonly cited obstacle to success.
The surge in agtech investment has brought the agriculture industry to the threshold of a new agricultural revolution. The major sources of revenues are changing, and new profit pools are being created. To take advantage of value creation opportunities in the next decade, agribusiness executives must understand the technologies that other players have prioritized and develop a strategy that leverages their companies’ unique competitive advantages.
They need the flexibility to pursue both offensive and defensive investments and must be open to taking nontraditional investment approaches.
Three areas are noteworthy:
- Biotechnology. In the coming years, breakthrough technologies in molecular biology will accelerate the development of genetically engineered traits. For example, the CRISPR/Cas system makes it possible to introduce mutations that are genetically indistinguishable from those resulting from natural breeding. Recognizing the potential, Bayer, DuPont, and Monsanto have invested in companies that are developing this technology.
- Precision Farming. Precision farming uses data at the level of the square meter or decimeter, or even of a single plant, to optimize the consumption of inputs and make adjustments to accommodate variable characteristics within and among fields. In the past decade, precision farming has already begun to revolutionize farming practices, and we expect its growing influence to promote improvements in variable-rate applications in seeding, fertilizing, and crop protection.
- Automation and Robotics. Airborne drones will play an increasingly important role in agriculture and may complement or replace other technologies, such as internet-connected sensors. Today’s drones can be used for land surveys and other data-gathering activities. Next-generation drones could support precision farming by analyzing conditions and identifying spots where more fertilizer might be needed to raise crop yields.
Weathering the Downturn
The forces pressuring agribusiness economics show no signs of abating in the near term, as commodity prices are likely to remain range-bound at depressed levels. The ongoing strain on farmers’ economics will promote an increasingly intense battle among agribusinesses for a share of farmers’ spending.
To emerge as top performers in this challenging environment, agribusinesses must take a farmer-centric approach to value creation that includes these elements:
- Base innovation decisions on farmer economics. The rise in commodity prices prior to 2012 promoted significant investments in innovation, which resulted in more yield-enhancing products and services than farmers need or can afford at current commodity price levels. Rather than focusing on yield, companies should prioritize innovations that will enable the largest and most demonstrable improvements to farmer economics. Agribusinesses must recognize that farmers are shifting their limited investments toward technological extremes. They are adopting either cutting-edge technologies (such as biologics) with demonstrated yield gains or low-cost, low-tech solutions (such as lime application). Some farmers are even opting to reduce or eliminate certain inputs. To make the right innovation decisions, agribusinesses must gain an in-depth understanding of how farmers’ costs can be fundamentally improved and use those insights to reassess their R&D portfolios and set new priorities.
- Develop an integrated product portfolio. Farmers face an increasingly wide array of options for products and services, offered by a growing number of vendors. By developing integrated offerings, companies can help farmers “cut through the noise.” The objectives should be to simplify farmers’ purchasing decisions and facilitate their selection of the optimal bundle of products and services.
- Focus on cost efficiency. To maintain margins, companies must manage costs aggressively and pursue continuous improvements in operational efficiency. Because such improvements often require making major cash outlays or taking on significant debt, companies must carefully assess efficiency gains against the potential balance sheet risks were global demand or prices to fall further.
- Pursue M&A to achieve value creation objectives. Companies with available cash should use M&A as a means to achieve strategic and operational objectives. As noted above, mergers can promote cost synergies, enable the development of integrated offerings, and improve the efficiency and scope of R&D programs.
Notwithstanding the agribusiness industry’s ongoing challenges, several long-run demand trends—including population growth, higher per capita calorie consumption, and the increasing use of crops in biofuel—will continue to support opportunities for value creation over the long term. The question is which companies will weather the near-term challenges, navigate through a crowded field of yield-enhancing technologies, and emerge as the strongest competitors. We believe it will be those that place farmers’ economics at the center of decision making. By sowing the seeds of recovery, these agribusiness companies will position themselves to reap a bountiful harvest for their shareholders.


