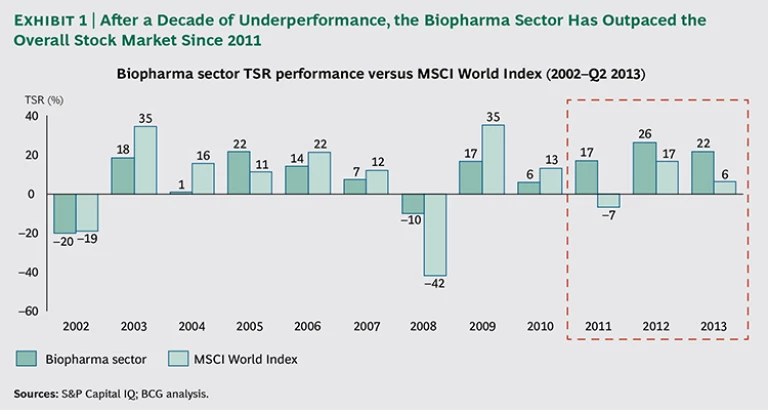
In the period from 2002 through 2010, the biopharmaceutical sector significantly underperformed the benchmark MSCI World Index, as measured by total shareholder return (TSR).1 The sector lagged in seven of those nine years, by as much as 18 percentage points—though, thanks to its defensive nature and strong dividends, it beat the overall market during the financial crisis in 2008 and 2009.
The explanation for such poor performance is well known. Many companies in the biopharma sector were richly valued in the early 2000s, as a consequence of unrealistic optimism about their growth prospects. In addition, their operating costs were high. When many of the industry’s blockbuster drugs began to lose patent protection, cost pressures and the need for increased R&D productivity drove critical scrutiny of biopharma companies, and investors lost confidence in the sector.
In 2008 and 2009, several biopharma companies began taking decisive measures to improve their operational and financial performance. Companies trimmed their R&D pipelines and rationalized their R&D models to become more productive. They reduced their costs, particularly in commercial and back-office functions, and pursued growth in emerging markets. In addition, the first major “patent cliff,” which occurred in 2011 and 2012, passed, and many biopharma companies were able to add promising new projects to their R&D pipelines.
Advances in discovery and development began to pay off; for example, drugs against targets revealed through genome-wide association studies (GWAS)—such as CFTR in cystic fibrosis and PCSK9 in dyslipidemia—began to reach the market. As a result, investors regained their confidence in biopharma companies, and the sector significantly outperformed the MSCI World Index from 2011 through 2013. (See Exhibit 1.)
Is this resurgence a short-term spike or a more sustainable shift in value creation performance? Although the biopharma sector is currently outperforming the market, biopharma companies’ performance continues to exhibit extreme variance. We conclude that value creation is fundamentally a matter of individual company efforts, rather than “riding the rising tide” of an attractive sector. For management teams, success in value creation lies within their own control and depends on truly effective strategic choices and flawless execution.
The Drivers of Biopharma Value Creation
To identify the specific actions that companies can take to ensure sustainable value creation at current levels, we analyzed the factors behind biopharma value creation from 2009 through the second quarter of 2013. The fundamental factors driving future health-care demand remain intact and include aging populations, increases in the prevalence of chronic diseases worldwide, and growth in gross domestic product (GDP) in emerging markets (leading to greater spending on health care). Furthermore, genomics and other tools are finally beginning to pay off, yielding a deeper understanding of targets and pathways that in turn is driving a greater volume of new and innovative therapies. As a result, we see considerable upside potential for the biopharma sector.
We also note that the shift to a value-based health-care environment marks a major change in how biopharma companies are evaluated by health care payers and investors. Payers and providers are on a common evolutionary path, moving from cost per unit or dose in a fee-for-service model to seeking greater value from medicines and procedures, often using big-data analytics and other initiatives that can compare treatments and analyze outcomes. These efforts create new challenges for biopharma products but also introduce transparency, creating opportunities for biopharma companies that can deliver real value against measurable outcomes. (See “What Value-Based Health Care Means for Pharma,” BCG article, March 2012; Progress Toward Value-Based Health Care: Lessons from 12 Countries, BCG Focus, June 2012; and “Competing on Outcomes: Winning Strategies for Value-Based Health Care,” BCG article, November 2013.)
In this report, we examine the value creation performance of 70 companies within the biopharma sector. (BCG has also completed similar analyses of the value creation records of the health-care-service and medical-technology
- Large-cap biopharma companies are those with global footprints, leading brands, and market capitalizations of more than $50 billion (as of June 30, 2013). These include established companies such as AstraZeneca, Pfizer, and Roche, as well as newer players such as Amgen, Gilead Sciences, and Biogen Idec.
- Midsize biopharma companies are those with market capitalizations from $10 billion to $50 billion. In general, these companies have already branched out into multiple therapeutic areas (TAs) but are not as large or diversified as the first group. Examples include Alexion, Regeneron Pharmaceuticals, and Vertex Pharmaceuticals.
- Emerging biopharma companies are those with market capitalizations of less than $10 billion and focus very narrowly on a small number of TAs—or just one. Examples include Ariad Pharmaceuticals, Medivation, and Pharmacyclics.
- Generics companies generate at least 60 percent of their sales from off-patent, generic medications. Companies including Hospira, Mylan, Ranbaxy Laboratories, and Teva fall into this category.
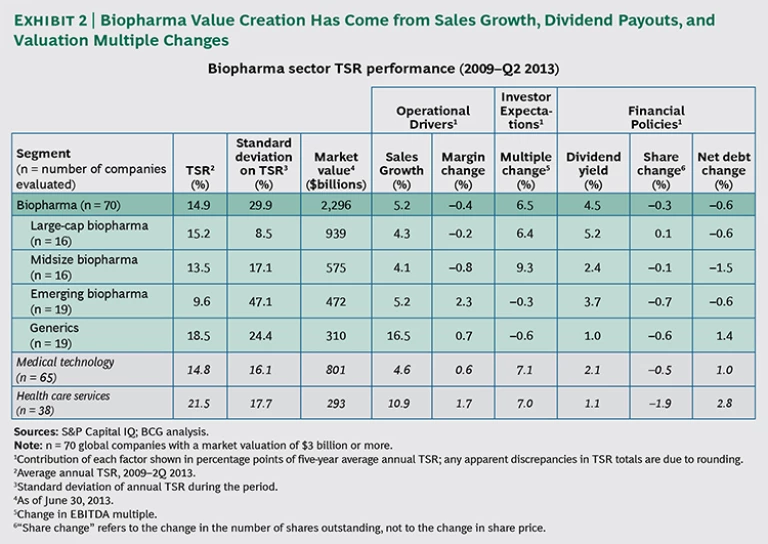
For each of these four segments, we looked at the key drivers of value creation over the nearly five-year period from 2009 through the second quarter of 2013. These drivers include operational factors (sales growth and margin change), investor expectations (change in valuation multiples), and financial policies (dividend yield, change in the number of shares, and change in net debt).
In the aggregate, the 70 biopharma companies that we analyzed generated average annual TSR of 14.9 percent from 2009 through the second quarter of 2013. Of that total, the biggest drivers for the overall sector were changes in the valuation multiple (contributing 6.5 percent), sales growth (contributing 5.2 percent), and dividend yield (contributing 4.5 percent). The remaining three drivers actually reduced TSR during this period. (See Exhibit 2.)
Key Drivers of Valuation Multiples
To better understand the drivers of investors’ future expectations, we also applied The Boston Consulting Group’s proprietary “smart multiple” methodology, which empirically identifies the drivers of valuation multiples—that is, how investors view the future prospects of
To conduct our smart-multiple analysis, we further divided the group of large-cap biopharma players into two subcategories based on their financial-management strategy and dividend policy: “mature” and “growth” companies. Large-cap mature companies are well-known, established players that pay attractive dividends to maintain investor interest. Examples include AstraZeneca, Eli Lilly, and Pfizer. Large-cap growth companies are those that are growth-oriented and pay little or no dividends. Of the group we analyzed, just four companies fit this profile: Biogen Idec, Celgene, Gilead Sciences, and Novo Nordisk.
What are the biggest drivers of valuation multiples for biopharma? Across all four segments, operational efficiency is a large contributor, specifically cash gross margin and
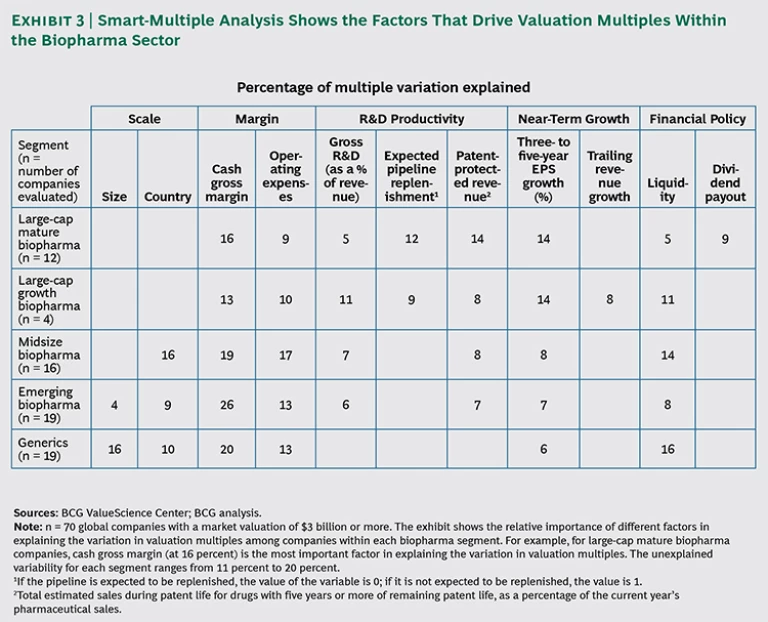
Looking at individual segments, several clear patterns emerge. First, although R&D pipelines are important for most segments, they are particularly critical for large-cap companies, where operating performance is usually stable. In this segment, investors are scrutinizing whether companies will follow up their current performance with continued growth, through new products soon to hit the market. (See Rising to the Productivity Challenge: A Strategic Framework for Biopharma, BCG Focus, July 2004.) Another key value driver for the mature large-cap biopharma companies is dividend payout.
For midsize and emerging biopharma companies, R&D pipelines are important, but other factors matter as well. As these companies grow, making the transition to stable, efficient enterprises is a key determinant of future performance, and so metrics such as cash gross margin and country of operation are
Generics companies have a similar set of drivers, but because R&D pipelines are not a factor, operational efficiencies are especially important to investors.
Two Distinct Periods of Performance
Although we analyzed the sector over a five-year period, dividing that observation time frame into two shorter periods provides useful insights regarding the sustainability of biopharma performance. (See Exhibit 4.)
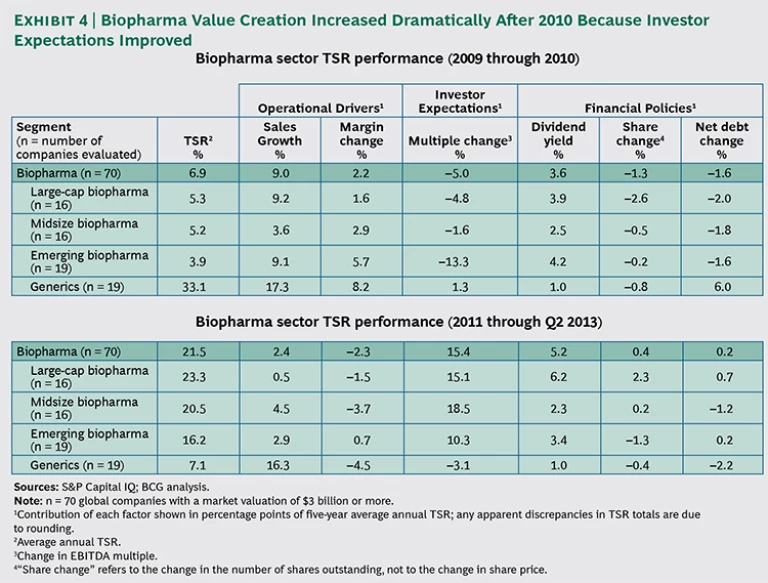
For the first period—from 2009 through 2010—the biopharma sector generated a relatively low average annual TSR of just 6.9 percent. In the second period—from 2011 through the second quarter of 2013—average annual TSR grew to more than 20 percent. The most important factors behind that improved value-creation performance were reducing cost bases, enhancing R&D pipelines, and expanding into emerging markets.
Large-Cap and Midsize Companies Benefited from Improved Pipeline Expectations
Pipeline strength is the key driver of improved large-cap- and midsize-biopharma performance. Over the past several years, these companies have been able to rationalize their R&D portfolios and accelerate R&D efforts. To some degree, they have leveraged genomics and other tools that are finally beginning to bear fruit, and we are seeing the beginning of the transition to personalized medicine.
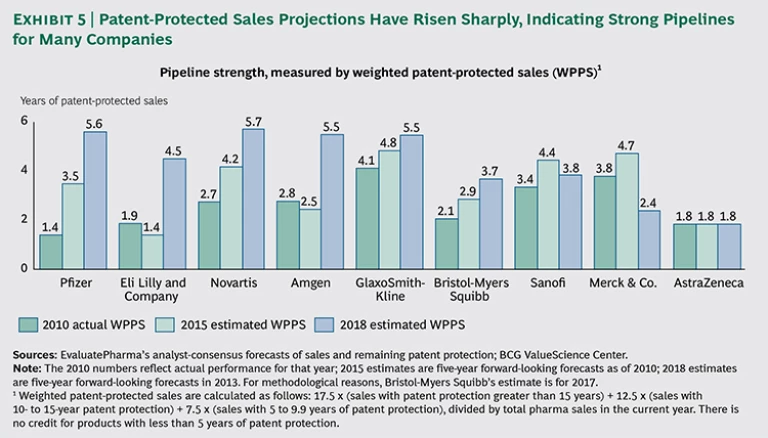
The more systematic approaches to understanding genomics have all been recent undertakings; GWAS, for example, was first used in 2007. Now, many promising new compounds pursuing targets identified using GWAS and other tools are in companies’ pipelines, and a few personalized therapies—such as Vertex’s ivacaftor and Pfizer’s crizotinib—have reached the market. As a consequence, biopharma portfolios contain many new value-generating products, and investors appreciate the potential. A good example of this trend is seen at Pfizer, whose pipeline-value expectations for 2018 are approximately four times higher than expectations were for the company’s 2010 pipeline. More-attractive pipelines, coupled with the expected end of the patent cliff, are driving stronger growth projections. This expected growth is leading to higher multiples, which have been a key driver of value creation among large-cap and midsize companies. (See Exhibit 5.)
Emerging Companies Remained Volatile
Emerging biopharma companies showed a marked increase in average annual TSR performance across the two periods, growing from 3.9 percent to 16.2 percent. Several emerging companies have brought highly innovative drugs to market in the past several years and thus delivered on their mandate.
However, emerging biopharma remains a risky environment. Companies in this segment had by far the highest standard deviation in TSR among the four segments (47.1 percent), meaning that they exhibited the greatest variation between the top and bottom performers over the entire five-year period. That was nearly twice the standard deviation of the next-highest group (generics companies). Of course, because emerging companies have smaller product and project portfolios, and those portfolios are often more innovative and more risky, results and valuations are inherently volatile.
Generics Showed Declining TSR Despite Steady Revenue Growth
In contrast to the improving results of other segments, generics companies have shown the opposite pattern, with average annual TSR declining from 33.1 percent in the first period to just 7.1 percent in the second. From 2009 through 2010, generics posted strong growth projections, driven by the many drugs scheduled to lose patent protection during the patent cliff of 2012 through 2014. While that cliff has not yet passed entirely, it is already factored into the stock price of these companies, and they are facing declining expectations from investors and corresponding reductions in their valuation multiples. Notably, generics posted strong sales growth across both periods, with the decline in average annual TSR coming primarily from reduced margins and decreased investor expectations. As with the more innovative biopharma companies in the period from 2002 through 2010, investors now question generics companies’ ability to generate adequate growth in the near-term future.
Imperatives for Biopharma Companies
What can biopharma companies do to make the increase in value creation over the past three years sustainable? Despite the fundamentals we noted previously that will drive demand—aging populations, increasing rates of chronic diseases, and growing emerging-market economies—several other forces will also reduce profitability and growth. In particular, pricing and reimbursement for medicines will show a complex dynamic given the shift to value-based health care. There will be a focus on cost-effective innovation.
We discuss specific actions for each biopharma segment in later subsections. However, several imperatives are clearly “no regret” moves that are relevant for all four segments, regardless of company size, maturity level, market, and other factors:
- Maximize efficiency and productivity. Many biopharma companies are proud of their recent efforts to improve efficiency. However, we consistently observe that best practices in other industries have not been fully exploited in the biopharma sector, and ultimately there are usually major opportunities to further increase productivity. Executives who have worked in lower-margin industries and who transition to biopharma are often astonished at the relative inefficiency of biopharma companies. The necessary changes to the biopharma sector’s commercial model will generate material cost savings, as will the rationalization of general and administrative costs, operations, and R&D. Focusing on efficiency and, at the same time, redeploying resources to the highest-value use is a critical enabler of superior value creation. Note, however, that efficiency should not be pursued at the expense of current and projected revenue growth.
- Drive near-term growth through commercial excellence for existing products. Brand renaissance efforts and customer-facing excellence will be critical to creating value from current products. A more specific approach to defining exactly where and how a medicine is best positioned versus competing products can generate a renaissance in the brand. Customer-facing excellence is necessary to optimize the productivity of commercial resources, making the organization truly customer centric. The shift in power from physicians to payers continues to accelerate, and competing on value to meet the needs of payers and organizations conducting health technology assessments will be increasingly critical to success. In addition, biopharma companies can enhance sales through life-cycle-management initiatives, to ensure that they are extracting all possible value out of their current commercial pipeline. (See Brand Renaissance: Five Ways to Win Commercially in Pharmaceutical Markets, BCG Focus, December 2011.)
- Keep the R&D pipeline focused. Companies should ensure that they have an R&D portfolio that is positioned to win in their TAs and markets of choice. This entails focusing on a sufficiently small number of TAs in which the company has a meaningful chance to differentiate its products from those of competitors, along with marked confidence in pipeline molecules’ mechanism of action. A lack of R&D focus is often based on insufficient scientific depth, which leads to poor decisions, such as which project to start or advance, or how to design clinical trials. For example, pursuing more than three or four TAs introduces significant complexity and fragmentation, resulting in insufficient resources and complex decision-making. To reach this objective, companies will need to terminate projects or programs to yield a targeted set of truly promising molecules aimed at markets in which they can clearly win, rather than continuing to fund research on undifferentiated or second-tier molecules. The intent must be to generate “first in class” or “best in class” medicines. (See “What Matters Most in Commercial Success: First-in-Class or Best-in-Class?” Nature Reviews Drug Discovery, May 2013; and “Does Size Matter in R&D Productivity? If Not, What Does?” Nature Reviews Drug Discovery, December 2013.)
- Prepare to excel in a value-based health-care environment. This entails being more patient centric in the go-to-market approach and focusing on demonstrating superior outcomes compared with competitors, through either the drug alone or a combination of the drug plus services. One example is Pfizer’s Getquit patient-motivation program coupled with its smoking-cessation drug varenicline; another is GlaxoSmithKline’s alli program, which provides lifestyle coaching on diet and exercise. In addition, payers will drive greater cost-effectiveness reviews, and regulators will continue to restrict approvals for drugs that do not demonstrate materially superior outcomes. There are many examples of these market trends, but too many biopharma management teams still believe that a “me too” product with commercial “push” will generate value.
- Actively communicate strategy to investors. Each company has investor segments with different requirements. Meeting all investor needs is not an effective approach; rather, management teams need to define the targeted investor segments and ensure that their strategy fits with the objectives of those shareholders (such as growth or stable dividends). For example, both Pfizer and Novartis are rationalizing their corporate portfolios by potentially divesting noncore units and focusing on the businesses where they can achieve a clear market advantage. Specifically, Pfizer divested its nutrition and animal-health operations and reorganized into three distinct business units—a move that enhances clarity for its investor base.
Management teams should also understand the requirements of different investor segments—particularly as biopharma companies mature. For example, growth-fund managers typically seek revenue and earnings-per-share (EPS) growth of 5 percent or more, make investments based on a three- to five-year time horizon, and are uninterested in dividends. By contrast, growth-at-a-reasonable-price (GARP) managers can tolerate slower revenue growth—as long as it exceeds overall GDP expansion—and they invest for longer periods of five to ten years. In exchange, however, GARP investors generally require dividend payouts (typically 2 to 3 percent).
Large-Cap- and Midsize-Company Imperatives
Revenue growth is critically important in the large-cap- and midsize-biopharma segments, and some companies have pursued growth through M&A. For example, Gilead Sciences acquired Pharmasset for $11 billion, and Amgen recently bought Onyx Pharmaceuticals for $10.4 billion. Both deals represent material sources of top-line and EPS growth, and both reinforce the acquirer’s position in a leading TA. In both cases, the combined entity was seen as greater than the sum of its parts, through both cost and revenue synergies. A good example is the Pharmasset drug sofosbuvir, for the treatment and cure of hepatitis C. According to analysts’ estimates, sofosbuvir had a net present value (NPV) of about $2 billion prior to the acquisition; after the acquisition, the March 2012 consensus NPV was $15.5 billion. That amount is higher than the price Gilead paid for all of Pharmasset.
Despite short-term EPS dilution, these transactions were significantly TSR-accretive. Yet many management teams still hesitate to pursue such transformative deals. In an environment of bullish expectations and high share prices, such deals are expensive, which means that they can dilute earnings in the short term. We have found, however, that short-term EPS impact is not the ideal metric to gauge the attractiveness of any transaction. Instead, management should apply a value creation metric when evaluating potential deals. If the transaction is a strategic move that truly drives value creation—transparently adding revenues or cost synergies to the combined entity—investors will respond favorably, even if the deal reduces EPS in the short term. That said, the rewards do not materialize automatically. They require both an effective investor-relations program that can tailor the right message to targeted investors and the right approach to smoothly and swiftly integrating the acquired company and its assets.
Emerging-Company Imperatives
Emerging-biopharma management teams must define their five-year strategic goals. Does management want the emerging company to become a fully vertically integrated global biopharma player? Or does it want to continue to innovate within a targeted set of TAs? The shift to value-based health care actually gives emerging companies a small advantage relative to their more-established competitors, in that they have less institutional inertia to overcome in reorienting to win in the new environment. They can determine the right business model, the right position in the value chain, and the right capability set for their strategic goals. However, they must actively assess the market and determine their ideal position.
Generics Company Imperatives
To pursue growth, some generics players are now expanding into more-differentiated biopharma markets. These include branded generics, technologies, and TAs that have traditionally entailed higher barriers to entry—such as oncology, respiratory, and ophthalmology—that often require more-complex delivery forms (such as patches, injections, and inhalable formulations and devices).
An important source of additional growth lies in the biosimilars segment, given that a number of the largest biologic drugs (such as infliximab and rituximab) will lose patent protection in the next few years. As many generics players are currently experiencing, the challenges and barriers to entry into this exciting new market segment are daunting. Placing bets wisely, investing in the right technologies and go-to-market models, and sharing the associated risks of entry through such measures as joint ventures will be key drivers of sustainable value creation from biosimilars.
In many cases, these growth strategies will require investments in new technologies, along with developing innovation capabilities that have traditionally been absent at many generics companies. These initiatives will also introduce technology risk in addition to the traditional legal and commercial risks that the generics segment has dealt with in the past. Yet given the current unattractive growth prognosis for generics—driven by a decline in the number and market potential of drugs coming off-patent, as well as the expansion of global low-cost competitors—many generics companies will likely decide that such initiatives are worth the risk.
In sum, the biopharma sector has rebounded significantly over the past three years, but the rebound has been uneven and attributable to an effective set of strategic actions at the individual company level. Those management teams that have addressed the key imperatives we define have performed well. Those that have not addressed them have underperformed. We see that situation continuing. In a dynamic market characterized by a shift to value-based health care, there are clear opportunities to create value for investors in a sustainable manner. However, management teams must build on their current momentum and take the right strategic, operational, and financial actions to generate a sustainable competitive advantage.
Acknowledgments
The authors would like to acknowledge the contributions of Joe Brilando from the BCG ValueScience Center in San Francisco, a research center that develops leading-edge valuation tools and techniques for M&A and corporate-strategy applications, as well as the contributions of Philippe Dehillotte and Kerstin Hobelsberger of BCG‘s Value Creators team.


