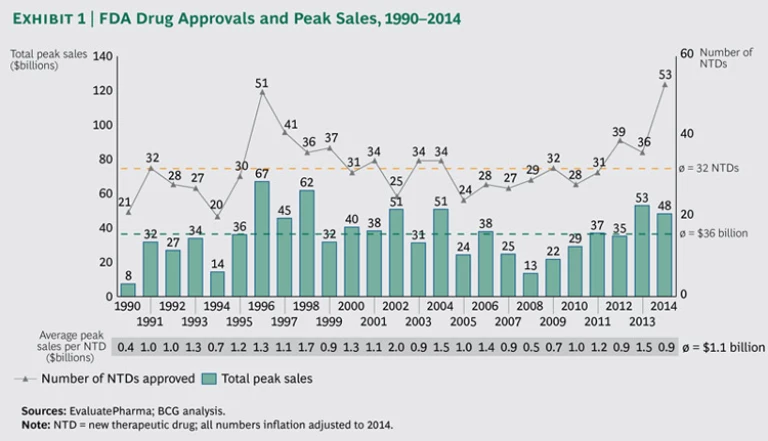
For decades, R&D productivity was on the decline in the biopharmaceutical industry. It reached its nadir in 2008, with the industry as a whole failing to earn a return on its R&D investments. The fortunes of the industry have since changed dramatically, and 2014 stands out as a record year in terms of approvals for new drugs
The FDA approved
The Highest-Value Drug Classes
In 2014, new drug classes as well as recently introduced drug classes led the way in value. In the former category, the FDA approved two highly anticipated PD-1 inhibitors to treat cancer: Opdivo, from Bristol-Myers Squibb, and Keytruda, from Merck. Reflecting widespread excitement about their treatment potential, these NTDs represent the first- and third-highest peak-sale values in 2014, at $7.1 billion and $4.4 billion, respectively.
Continuing the recent burst of innovation in anti-infectives, Gilead Sciences followed last year’s megablockbuster treatment for hepatitis C virus (HCV) infection, Sovaldi, with its HCV combination therapy, Harvoni (which accounted for $5 billion in projected peak sales). AbbVie was successful with its own HCV combination, Viekira Pak (expected peak sales of $3 billion), while GlaxoSmithKline introduced a triple-combination therapy against HIV that is expected to generate peak sales of $3 billion.
Also significant were multiple diabetes-treatment approvals: two SGLT-2 inhibitors (AstraZeneca’s Farxiga and Boehringer Ingelheim’s Jardiance), as well as two GLP-1 agonists (Eli Lilly’s Trulicity and GlaxoSmithKline’s Tanzeum). Collectively, these four diabetes drugs are expected to generate $4.7 billion in peak sales.
In terms of therapeutic areas, oncology generated the highest value at 32 percent (up from 26 percent in 2013), sending anti-infectives to second place at 28 percent. In the last three years, these two therapeutic areas have collectively accounted for the lion’s share of successful innovation, with more than 60 percent, or $82 billion, in expected peak sales.
Also over the past three years, the majority of approved NTDs (69 percent) and a similar share of NTDs that achieved peak sales (79 percent) originated externally. Successful partnerships, licensing, and collaboration are clearly as critical a competency as the ability to develop and commercialize drugs internally.
The Impact of the FDA’s Breakthrough-Therapy Designation
To help patients with serious or life-threatening conditions gain faster access to innovative treatments, the FDA introduced, in 2012, an expedited development and review process for promising treatments designated as breakthrough therapies (BTs). Thus, 2014 arguably represents the first year that the BT designation can be assessed for impact. While only 10 (or 19 percent) of the 53 NTDs approved in 2014 were BTs, their contribution to expected peak-sales value was impressive. Not only did BTs account for the five drugs with the highest estimated peak sales, but the aggregate peak sales of all ten BTs represented 53 percent, or $26 billion, of peak-sales value. Furthermore, the average peak-sales value of BTs approved in 2014 was $2.6 billion, compared with $.5 billion for regular, non-BT treatments—a fivefold difference.
While BT designation is neither an absolute indicator nor a guarantee of success, it is clearly a strong proxy for value. The BT process also shows that the FDA has been effective in allowing greater flexibility to encourage innovation where there is greatest need. This is undoubtedly good news for the industry and even better news for affected patients. However, time will tell if the incentive created by faster speed to market will be sustained or if we are just seeing a one-time “pull forward” in innovation.
Impact on R&D Productivity
To gain a better understanding of biopharma’s robust output in 2014, we looked closely at levels of R&D spending and their overall impact on R&D productivity. Consistent with the prevailing trend since 2008, total industry R&D spending remained flat at $140 billion. The industry’s R&D productivity ratio
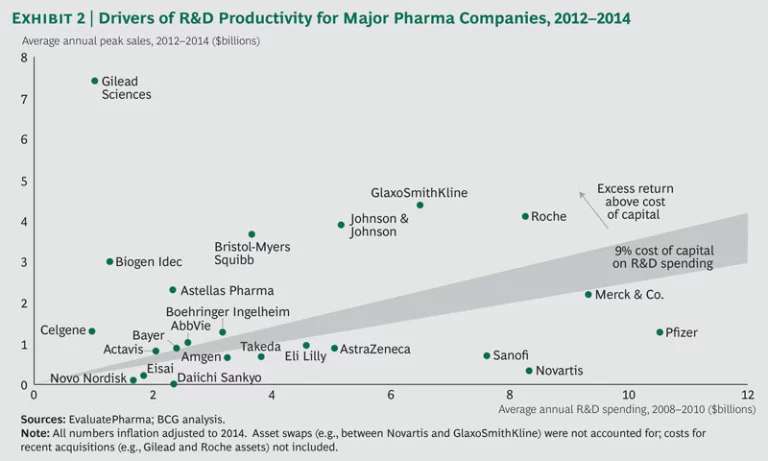
The performance of the top biopharma players shows a continued bifurcation, with roughly half the companies returning more than they spent on R&D. (See Exhibit 2.) Over the past three years, a select group of players, such as Bristol-Myers Squibb and Johnson & Johnson, have consistently sustained high performance. Meanwhile, previously underperforming companies have shown that it is possible to move up and turn around performance. Both AbbVie and Merck are good examples, given their recent approvals in HCV and oncology.
In 2014, strong output created real value for the biopharma industry. We see two underlying drivers that make us cautiously optimistic. First, the industry’s prudent but concerted effort to achieve more with a flat level of R&D spending appears to be working. More effective drug development, better prioritization, and improved decision-making all indicate that R&D productivity can indeed improve. (See Can R&D Be Fixed? Lessons from Biopharma Outliers, BCG Focus, September 2011.)
While greater R&D productivity is good news for capital markets, we are more buoyed by the promise of improved patient well-being, particularly in areas of high unmet needs. Significant investment in science, both in furthering our understanding of the basis of disease and in applying new platform technologies (fundamental technologies that can be leveraged across multiple drug candidates), is clearly bearing fruit. While competition, particularly in hot therapeutic areas such as diabetes and oncology, will make it tougher for individual players to win, the ultimate beneficiary of the continued investment in innovation will be patients. A healthy biopharma industry—with R&D productivity at its core—is the necessary enabler for the industry to deliver on its promise to tomorrow’s patients.


