Although the engineering, construction, and services (ECS) industry continues to lag substantially behind the broader market, a doom-and-gloom outlook is by no means warranted. Notable successes emerged in 2015, showing that value creation is possible and signaling important opportunities for many companies in the years ahead.
Today’s most intriguing value creation opportunities relate to the new digital technologies that support the work of ECS companies. In this report, BCG’s fourth annual study of shareholder value creation in ECS, we introduce the ECS Technology Index—a portfolio of 17 publicly listed technology and IT companies that participate in the industry. Recognizing the exciting growth opportunities for these companies, the market has rewarded them with valuation multiples that exceed those of ECS as a whole, a portfolio of S&P 500 technology companies, and the overall S&P 500. This points to the potential to create shareholder value by spinning off proprietary technologies into standalone companies.
In this year’s report, which examines value creation in the industry from 2011 through 2015, we have expanded the size of the total sample of ECS companies to 80 in order to better reflect the geographic scope and business diversity of industry participants. Some players—companies in Japan and China (from a country perspective), infrastructure construction companies (from a business model perspective), and a handful of other standout performers—beat the odds and maintained their consistently high performance in 2015. Beyond being in the right place, or having the right skills, at the right time, many of these companies have pursued strategies to maximize their advantages in the challenging environment.
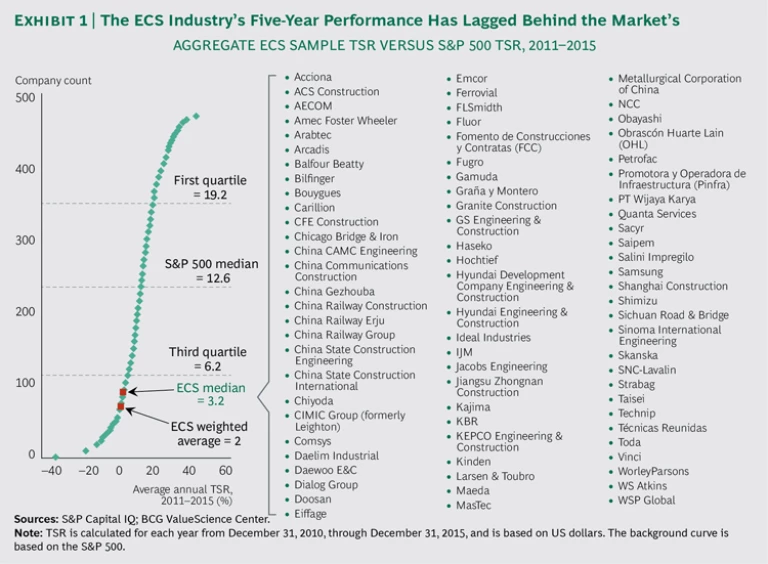
These pockets of success coexisted with signs of distress, however. The industry’s median five-year average annual total shareholder return (TSR) of 3.2% put ECS yet again in the bottom quartile of S&P 500 companies, as growth was unspectacular and valuation multiples declined. In 2015, unlike in other years during the industry’s sluggish recovery from the Great Recession, M&A activity was not a route to value creation. The number of ECS deals was half the 2014 level, even though overall M&A activity was at a postrecession high, and the industry’s median multiple trailed that of the S&P 500. Moreover, ECS companies that serve the energy industry continued to suffer the ripple effect of low oil prices as their clients pulled back from growth initiatives. Such companies may be finding that the low-growth environment has undercut their efforts to improve TSR through greater discipline with respect to operating costs and capital.
The following are among the report’s key findings.
Japan and China are robust markets for ECS value creation.
- Japanese companies’ average annual TSR of 14% in the five-year period from 2011 through 2015 is generated by extremely strong margin increases and cash flows. This performance has propelled Japanese companies’ ascent in the TSR ranking from no representation in the top quartile in 2013 to six companies in 2015.
- Chinese companies’ average annual TSR of 8% is primarily the result of strong revenue growth in the past five years. Companies based in China and Hong Kong have increased their presence in the top quartile, from two companies in 2013 to six in 2015.
Infrastructure construction companies continue to outperform.
- Infrastructure construction companies had a median TSR of 8% from 2011 through 2015. Although this performance was not stellar relative to other industries, it was the highest of the ECS’s four business types: design and engineering (D&E); process engineering, procurement, and construction (process EPC); infrastructure construction; and concessionaire.
- TSR varied widely within this group. The top performers tended to generate their strong TSR from margin recovery (an increase in margins from low to nearly average), and this effect was magnified by high levels of debt.
Companies in developed markets are struggling.
- Developed-market companies had an average annual five-year TSR of −1.3%, a result of limited revenue growth and eroding margins.
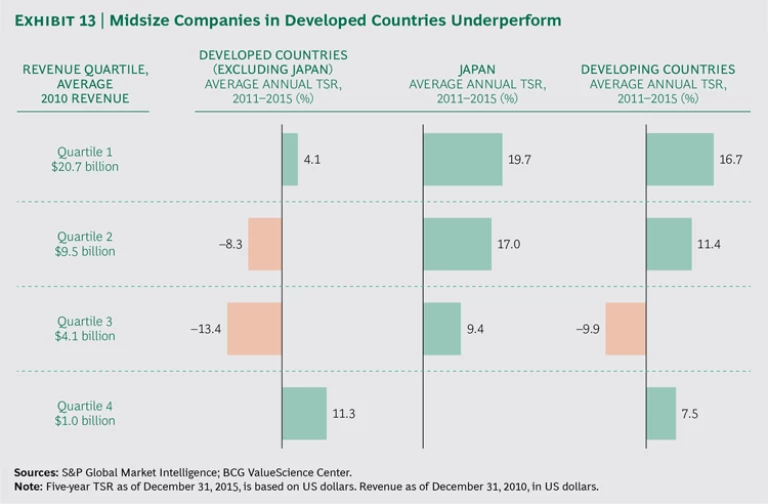
- The largest and the smallest companies in developed markets (excluding Japan) outperformed the midsize companies. The largest appear to be enjoying the advantages of scale, while the smallest may be capturing the benefits of high margins in niche skills.
Process EPC companies fell from the top quartile.
- In contrast with previous years, process EPC companies are absent from the top quartile this year. These companies provide services to process industries (for which the primary production processes are continuous or relate to a batch of indistinguishable materials), such as chemicals and oil and gas.
- Process EPC companies that serve the oil and gas and mining industries remain under pressure as producers in those areas cut capital expenditures and delay energy-related investments or change their mix of investments in response to the continued slump in oil prices.
ECS technology companies represent an intriguing bright spot, substantially outperforming the ECS industry as well as the S&P 500 since 2010.
- Companies in BCG’s ECS Technology Index have valuation multiples 1.5 times greater than those of the ECS industry as a whole.
- These ECS tech companies also have higher multiples than those of the balanced portfolio of the S&P 500 information technology index.
- For traditional ECS companies, the superior multiples of ECS tech companies point to an opportunity to create shareholder value by spinning off proprietary technologies into standalone companies.
To generate value in today’s market environment and over the long term, ECS companies need to build endurance by pursuing the right combination of success factors.
- To ensure continued growth as the investment landscape evolves, companies will need to consider where and how to expand their geographic reach.
- Companies should seek to diversify their portfolios with high-margin, niche skills (such as tunneling and dam construction).
Strategic acquisitions can enable entry into attractive geographic markets or high-margin businesses.
- Efforts to contain costs continue to be essential and should be pursued in conjunction with initiatives to capture higher revenues.
- Companies will need to achieve the right mix of projects with respect to size, regions, skills, and cash profile. A focused portfolio, especially with respect to project size, might be easier to manage than a diverse one.
- By adopting digital technologies, ECS companies can increase labor productivity, reduce costs, improve quality and safety, and create significant shareholder value.
- The success factors to pursue will depend on a company’s strategic starting point, with respect to locations and specialties, as well as its competitive context.
The winning ECS companies will follow five imperatives for value creation.
- Analyze the performance of each business unit and customer segment in the portfolio.
- Think about capabilities through the lens of comparative advantage.
- Pursue cost and process discipline in conjunction with growth initiatives.
- Pursue M&A opportunities strategically.
- Look for growth opportunities in technology.
In the midst of a challenging market environment, ECS companies should not lose sight of the attractive opportunities for value creation. As this report highlights, these opportunities are within reach for companies that apply deep market insights to define and implement the right strategies for sustained, profitable growth.
A Sluggish Recovery Demands Endurance
For companies in the engineering, construction, and services (ECS) industry, building endurance is essential to creating value year after year in their perennially challenging market environment. By making the right moves to strengthen their competitive position over the long term, leading ECS value creators have demonstrated that it is possible to achieve and sustain profitable growth.
The Boston Consulting Group’s 2016 ECS Value Creators study, the fourth annual review of shareholder value creation in the industry, identified those outstanding performers as well as the underperformers. It also revealed some important opportunities for companies that learn how to overcome the challenges in their industry.
The study is part of BCG’s annual Value Creators series, which provides rankings of the world’s top value creators on the basis of average annual total shareholder return (TSR) over a five-year period, distills managerial lessons from their success, and highlights trends in the global economy and capital markets. (See Creating Value Through Active Portfolio Management: The 2016 Value Creators Report, BCG report, October 2016.)
The need for endurance in ECS was apparent in 2015. Even as the industry’s relative performance improved during a lackluster year for the global economy, its recovery from the Great Recession continued to be sluggish and erratic. Our study found that, yet again, the industry underperformed on fundamental measures: revenue growth was slow, and margins and valuation multiples declined.
In the aggregate,
HOW WE CALCULATE TSR
We use total shareholder return to quantify and compare companies’ value creation performance. TSR, an objective measure of the value a company creates for investors, allows for the disaggregation of results into multiple factors.
Readers of BCG’s Value Creators series are likely familiar with our methodology for quantifying the relative contribution of the sources of TSR. The methodology uses a combination of revenue (sales) growth and margin change as an indicator of improvement in fundamental value. It then uses the change in the company’s valuation multiple to determine the impact of investor expectations on TSR. The improvement in fundamental value and change in the valuation multiple determine change in a company’s market capitalization and the capital gain or loss to investors. Finally, the model tracks the distribution of free cash flow to investors and debt holders in the form of dividends, share repurchases, and repayments of debt in order to determine the contribution of free-cash-flow payouts to TSR.
The most common TSR metric we use in this report is five-year average annual TSR, which reflects year-over-year TSR smoothed out over five years. In this year’s report, we calculated average annual TSR on the basis of US dollars in all relevant analyses. For some analyses in previous reports, we used each company’s native currency. In some cases, the change from native currency to US dollars has resulted in lower absolute TSR figures, largely because of the US dollar’s recent strength; however, the change has not materially affected the relative positions of the ECS industry or of ECS subsegments.
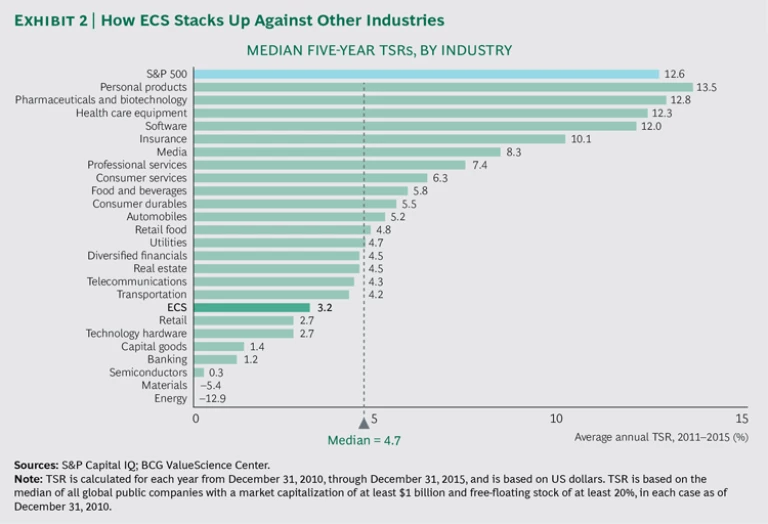
The ECS peer set’s median five-year TSR of 3.2% ranks 18th of the 25 industries BCG tracked. (See Exhibit 2.) This is a slight improvement from last year’s ranking of 23. However, performance declined for both the ECS industry and the market as a whole: while the industry’s median TSR dropped from 7.0% in 2014 to 3.2% in 2015,
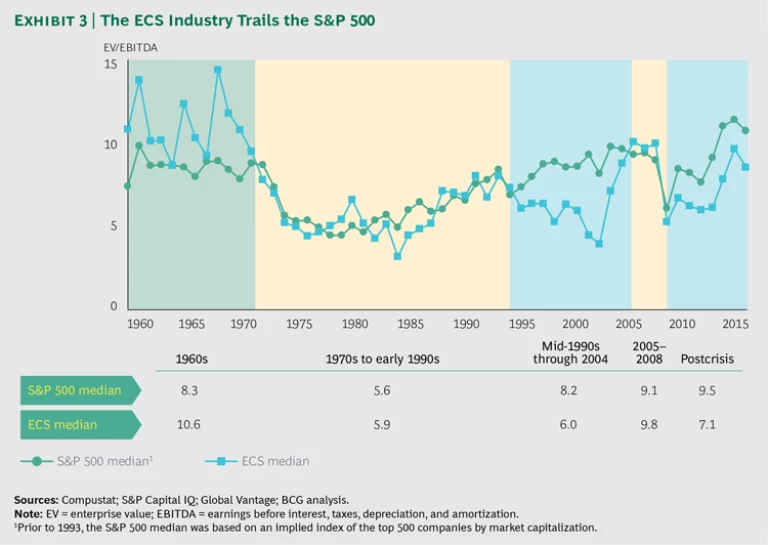
The decrease in returns across industries resulted, in part, from a less optimistic outlook. In the US, the median valuation multiple (the ratio of enterprise value to EBITDA) for the S&P 500 fell from 11.4 in 2014 to 10.7 in 2015. Valuation multiples in ECS continue to be lower than those of the broader market. Indeed, we see no indication of a return to the boom times of the 1960s, when the ECS industry’s median valuation multiple was consistently higher than that of all industries. (See Exhibit 3.)
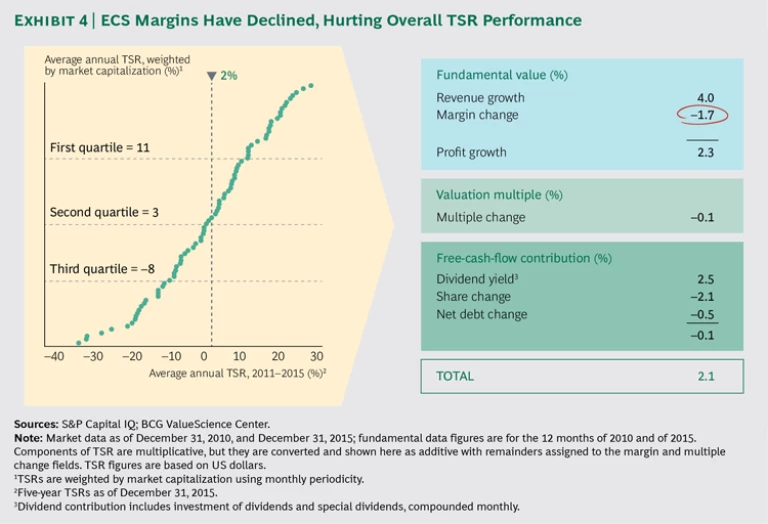
The industry’s TSR continues to be propped up by dividends and moderate revenue growth. (See Exhibit 4.) Once again, profit growth has not kept pace with revenue expansion.
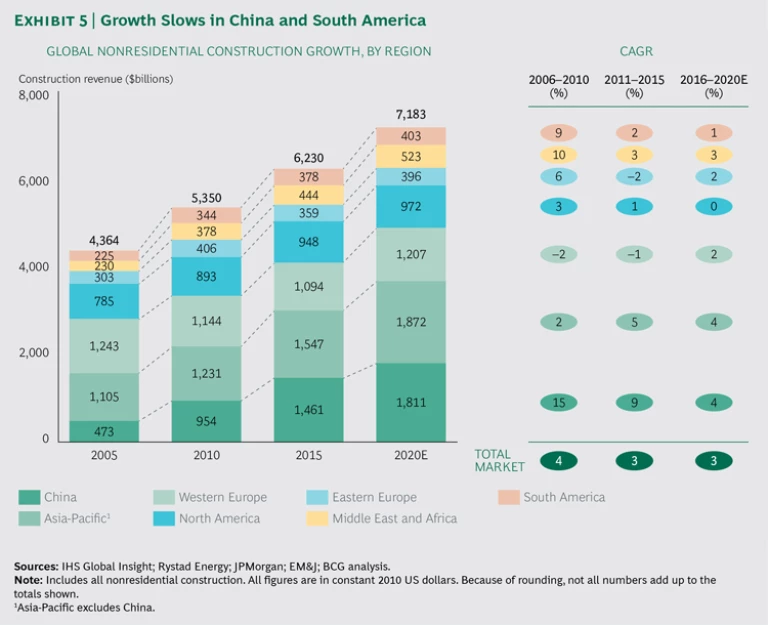
In all regions of the world, ECS players have faced challenging market dynamics. From 2011 through 2015, the nonresidential construction markets in Eastern and Western Europe experienced negative growth rates, creating significant headwinds for those companies. (See Exhibit 5.) Growth rates in China, Asia-Pacific (excluding China), and the Middle East and Africa, which had been impressive, have slowed significantly since 2011. Even so, growth in these regions is stronger than it is elsewhere.
Nearly all ECS subsegments are experiencing steady growth, although at low to middling rates (most have a CAGR of less than 5%). (See Exhibit 6.) Growth rates have been volatile in the mining and oil and gas subsegments in response to fluctuating commodity prices.
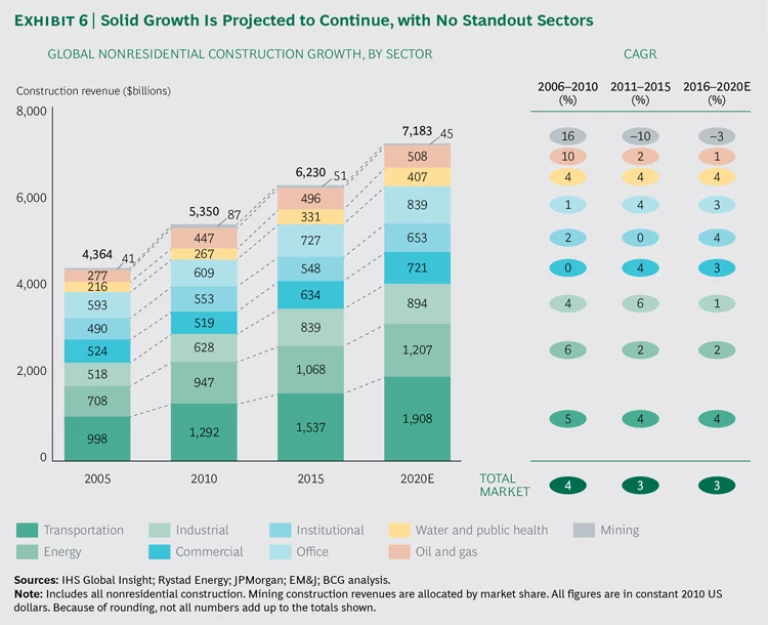
The ECS market is expected to grow at a compound annual rate of 3% from 2016 through 2020, consistent with the rate from 2011 through 2015. Growth is expected to accelerate in developed markets and decelerate in developing markets, although developing markets will still outpace developed markets. Volatile oil prices will continue to promote uncertainty in the oil and gas subsegment. The industrial subsegment, which has been enjoying somewhat stronger growth than the overall industry, is expected to experience slower growth through 2020.
Taken together, these results point to many challenges and uncertainties for ECS companies. But we see no shortage of opportunities. As we will discuss, the most promising are in digital technologies, as evidenced by the many businesses springing up to provide the digital services that are reshaping the operations of companies across the industry. Our new ECS Technology Index—a portfolio of 17 publicly listed technology and IT companies that participate in the industry—which we introduce later in the report, can help traditional ECS companies formulate strategies to make the most of new digital offerings and capabilities.
Spotlight on the Top Performers
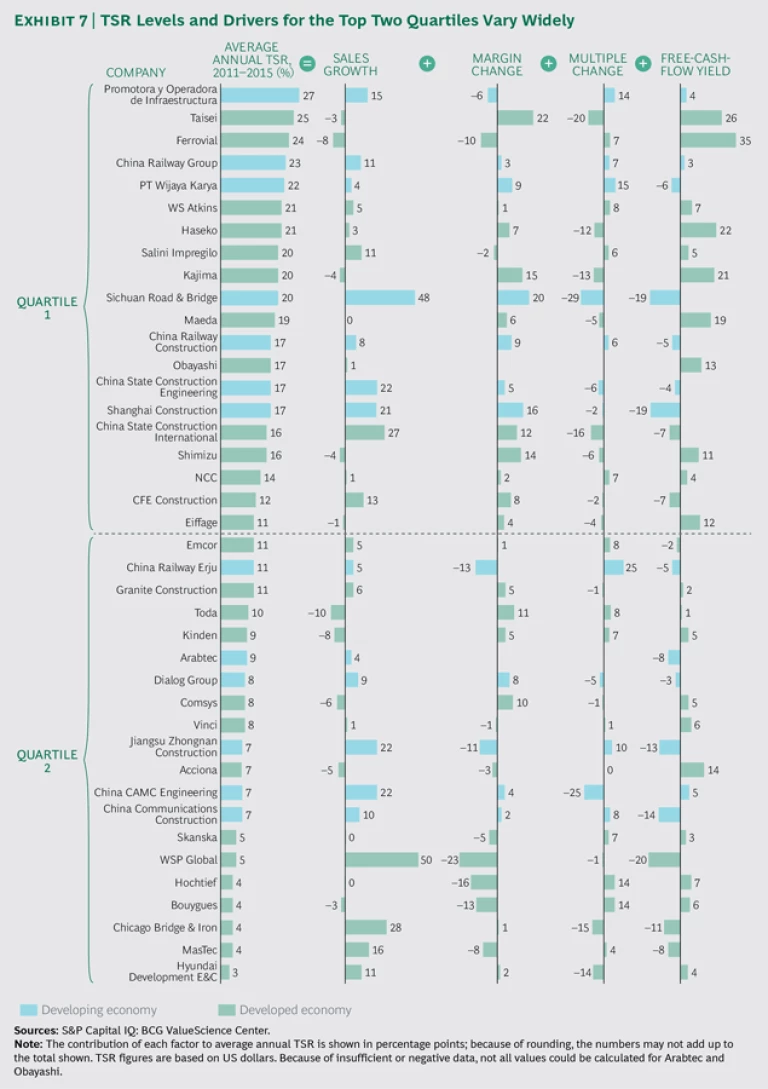
Despite the industry’s sluggish performance, some ECS companies stand out as value creators, as they have in previous years. Nearly two-thirds of the top-quartile performers in this year’s sample (those whose five-year average annual TSR exceeded 10%) were also in the top quartile last year. This consistency indicates that many of the industry’s leading companies have found a formula for sustained high performance. But these formulas vary widely: our analysis shows that each company in the top two quartiles assembles the components of TSR in its own way. (See Exhibit 7.) The top performer in 2015 was Promotora y Operadora de Infraestructura (Pinfra), a Mexican concessionaire, with a TSR of 27%.
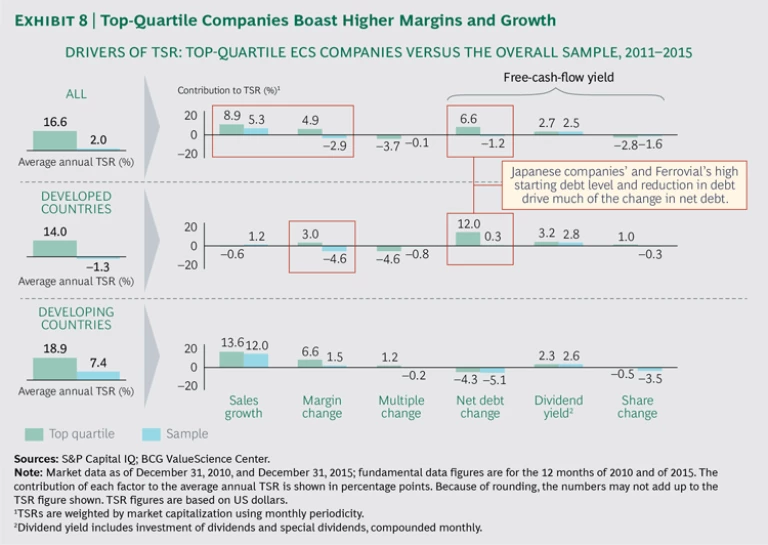
The performance of top-quartile companies has been the result of strong revenue growth and margin improvements, consistent with trends over the past decade. However, as we will discuss below, the formula for superior performance varies by region: top companies in developing countries have continued to enjoy relatively robust revenue growth, whereas the winners in the developed world have focused on enhancing margins. (See Exhibit 8.)
From a country perspective, Japanese and Chinese companies have dramatically increased their presence in the top quartile. From a business model perspective, infrastructure construction companies stand out for their ascent to the top quartile.
Japan and China Are Robust Markets
We found a significant variation in five-year average annual TSR among countries. Japan and China stand out as particularly advantageous environments for ECS businesses. (See Exhibit 9.)
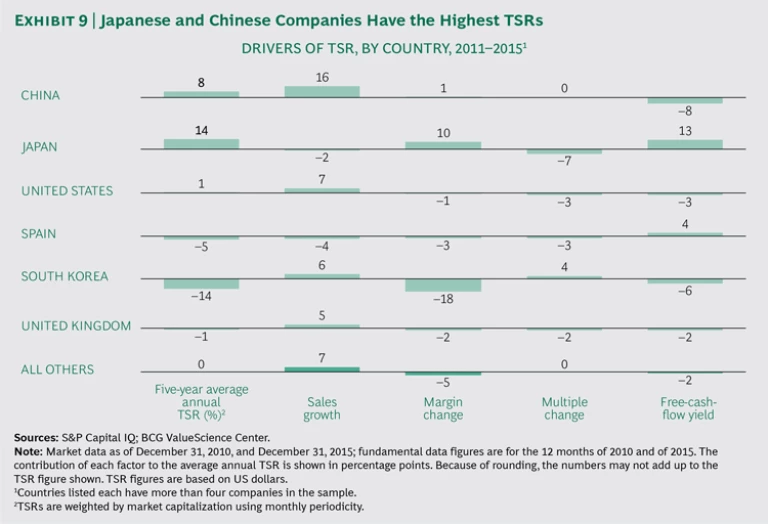
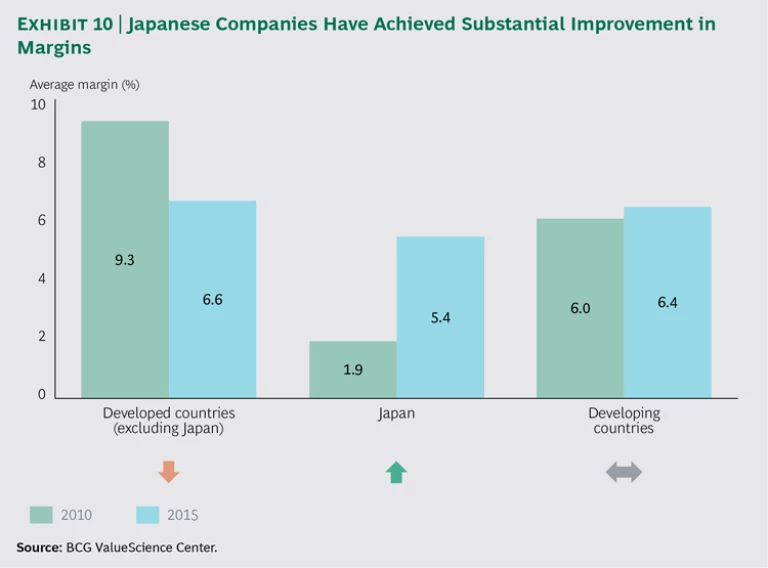
Japanese companies’ average TSR of 14% is generated by extremely strong margin increases and cash flows, which generally result from operational efficiencies or a favorable business environment. From 2011 through 2015, Japanese companies’ average EBITDA margin rose from 1.9% to 5.4%, much closer to the margins of companies in other developed countries. (See Exhibit 10.) This performance has propelled Japanese companies’ ascent in the TSR ranking from no representation in the top quartile in 2013 to six companies in 2015. As we discuss below, the rising stars include five infrastructure construction companies. Strong local companies, such as Taisei, have captured business arising from infrastructure investments aimed at recovering from the 2011 earthquake and tsunami and preparing for the 2020 Tokyo Olympics.
We believe that the Japanese government’s expanded commitment to public-private partnerships (PPPs) has played a role in the strong performance of the country’s ECS companies. Since 1999, the Japanese government has encouraged the participation of private companies in developing public infrastructure. During the past several years, the government has doubled down on this effort by expanding the scope of PPP regulations and increasing funding. Recent PPP projects include the selection of a Japanese-French consortium to operate Osaka’s two airports.
Chinese companies’ average TSR of 8% is primarily the result of strong revenue growth. Construction revenues grew at a compound annual rate of 9% from 2011 through 2015, as shown in Exhibit 5. Companies based in China and Hong Kong have increased their presence in the top quartile, from two com-panies in 2013 to six in 2015. These top performers, such as China Railway Construction and Shanghai Construction, augmented their strong revenue growth with margin increases.
Infrastructure Construction Outperforms
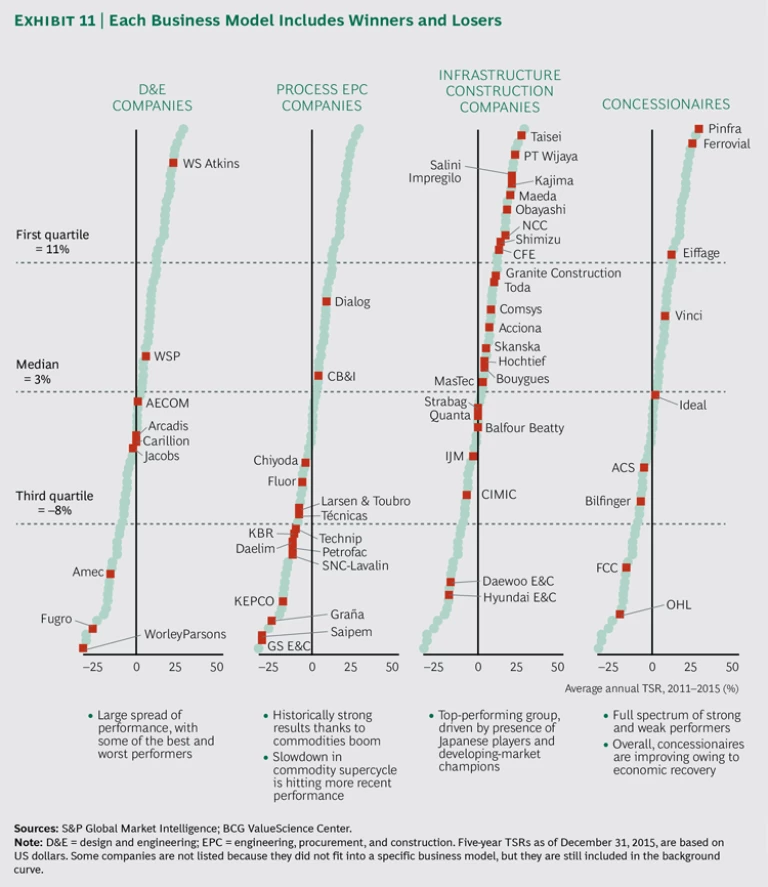
As usual in ECS, business models played a meaningful role in shaping the TSR of individual companies. We categorized each company according to its dominant model: design and engineering (D&E); process engineering, procurement, and construction (process EPC); infrastructure construction; or concessionaire. In companies that follow multiple models, we assessed publicly available information to identify the prevailing model. We found that each model includes winners and losers. (See Exhibit 11.)
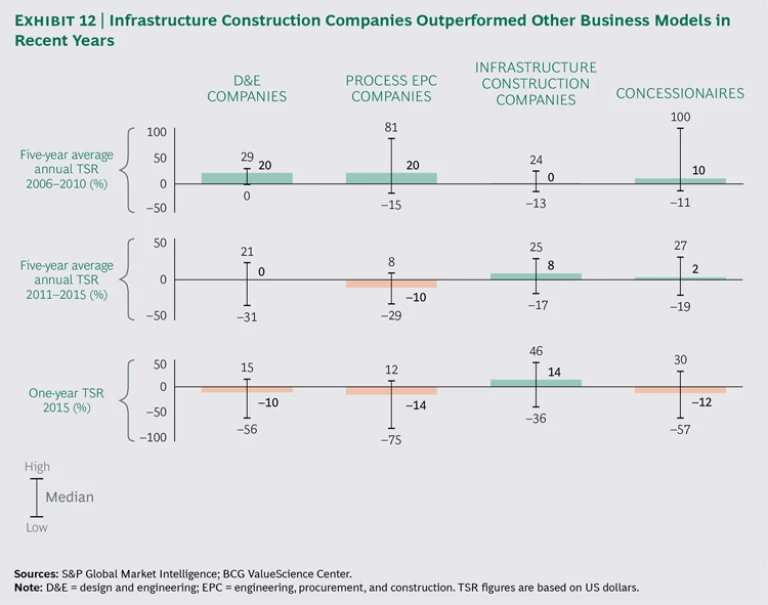
Consistent with last year’s findings, infrastructure construction companies outperformed in 2015. (See Exhibit 12.) Just under half (9 out of 20) of the top-quartile companies are in this category. Overall, infrastructure construction companies had a median TSR of 8%, the highest of the four business types. Notably, these companies did not experience strong revenue growth. Their outstanding TSR performance is attributable to their ability to limit margin erosion as well as to their strong multiples and cash flows.
Japanese infrastructure construction companies contributed significantly to these results, accounting for five of the nine infrastructure construction companies in the top quartile. These companies not only take advantage of growth opportunities in their local markets but also expand internationally and control margins and cash flows—a combined approach we will return to when discussing the best practices for building endurance in ECS.
A Closer Look at the Underperformers
Maintaining our country and business model perspectives, we found that two interrelated categories of ECS companies have faltered in the past year: those in developed-market countries and those with a process EPC business model.
Developed-Market Companies Struggle, Especially Midsize Players
As shown in Exhibit 8, developed-market companies had an anemic average five-year TSR of −1.3%, with limited revenue growth and eroding margins. The top performers experienced less margin erosion and achieved superior free-cash-flow yields than the others. However, even those companies—including Salini Impregilo, Ferrovial, and NCC—were not immune to the overall stagnation in revenue growth. They improved their financial situation through better management of their balance sheets and cash flows.
Among companies in developed countries (excluding Japan), the largest and the smallest in terms of 2010 revenue generated higher TSR from 2011 through 2015 than the midsize players. (See Exhibit 13.) Large companies appear to have benefited from scale advantages. As we will discuss, many small companies (including WS Atkins and Salini Impregilo) pursued niche areas, which are characterized by high margins and limited competition.
Despite the relatively strong performance of large companies overall, shocks to the commodity market have severely hurt two large Australian companies, CIMIC Group (formerly Leighton, an infrastructure construction company) and WorleyParsons (a D&E company). And many large process EPC companies—such as Fluor, Petrofac, Saipem, SNC-Lavalin, and Technip—have suffered from the ripple effects of low oil prices.
Process EPC Companies Fall from the Top Quartile
In contrast with previous years, process EPC companies are absent from the top quartile this year. Of the seven companies that fell out of the top quartile in 2015, three are in this category.
Plummeting oil prices have been especially hard on process EPC companies. Following a price drop of more than 46% for crude oil in 2014, prices fell an additional 30% in 2015. To make money over the long term, producers need oil prices in the range of $75 to $100 per barrel, but it is not clear how and when prices will rebound to that level from the current $40 to $50 per barrel. To cope with sharply lower revenues and limited access to new financing, producers are cutting capital expenditures and delaying energy-related investments or changing their mix of investments. These moves are placing considerable pressure on process EPC companies that serve the oil and gas and mining industries. If these companies respond by selling noncore assets and outsourcing noncore activities, new opportunities could open up for investors and service providers.
The Building Blocks of Endurance
Among the companies in our sample, five stand out as role models of endurance. (See “Role Models of Endurance.”) On the basis of our study of these high performers and others in the top quartile, we have identified six key building blocks of endurance:
- Choosing the right locations for profitable growth
- Including high-margin, niche skills in an integrated portfolio
- Pursuing M&A strategically
- Redesigning processes for cost efficiency
- Creating a focused project portfolio
- Fully embracing digital technology
ROLE MODELS OF ENDURANCE
Five top-quartile companies stand out for their consistently high performance in our ECS Value Creators study. Here, we present basic information about these companies and explore the factors that promote their performance.
- WS Atkins is a UK-based D&E and project management company with 2015 revenue of approximately $2.4 billion. About half the company’s revenue comes from the UK and Europe, but Atkins also operates in North America, Asia-Pacific, and the Middle East. The company’s strategic focus areas are energy, infrastructure, and transportation, complemented by a recently launched end-to-end advisory business. In 2015, rail tunneling contributed 25% of revenue, with 38% of this work in the UK and Europe. The company’s five-year TSR of 21% is the result of margin improvements, multiple expansion, and cash flows. Atkins’s core competencies position the company to benefit from the surge in UK government infrastructure investment, resulting in high multiples. Atkins continues to be the only D&E firm in the top quartile, and unlike many ECS companies in the UK, it has seen consistently high performance: its five-year TSR far exceeds the averages of −8% for D&E companies and −7% for ECS companies in the UK.
- Ferrovial is a Spanish integrated construction and concessionaire company with 2015 revenue of approximately $10.8 billion. It operates business units devoted to civil construction, toll road and airport concessions, and services. The company’s five-year TSR of 24% is generated largely by best-in-class cash flows and multiples. As in recent years, Ferrovial’s TSR is among the highest for concessionaires. While its asset rotation strategy has improved its cash position, the company’s success is also due to a growth strategy in carefully selected markets, well-coordinated synergies among business units, and a focus on operational and financial excellence.
- Pinfra, a Mexican concessionaire with 2015 revenue of $575 million, focuses mainly on toll roads but also operates a diversified construction and materials company. The acceleration of Mexico’s economy has increased traffic on the highways that Pinfra already operates and has created demand for new highway projects. Current and anticipated revenue growth (estimated at 16% year-over-year) from those projects generates Pinfra’s five-year TSR of 27%, the highest in our ECS sample.
- Salini Impregilo is an Italian concessionaire and industrial construction company with 2015 revenue of approximately $5.2 billion. In 2013, Salini, a family-owned company, took over Impregilo, a larger rival. The success of the combined company is promoted by strong cash management, a strategic approach to geographic expansion, and expertise in the high-margin, niche industries of tunneling and dam construction. About half of the company’s new business in 2015 related to tunneling projects for railways and underground transit systems and dam construction, with additional projects in roads and highways, nonresidential buildings, and marine engineering. Salini Impregilo’s five-year TSR of 20% is delivered by strong revenue growth and free-cash-flow yields.
- Taisei, a Japanese infrastructure construction company with 2015 revenue of approximately $15.3 billion, focuses primarily on projects in civil engineering, building construction, and real estate development. The company has experienced an exceptional five-year TSR of 25%, produced by cash flows and increased margins. Margins rose from 2% in 2010 (below the market) to 6% in 2015 (on par with the market).
For each company, success requires finding the most effective combination of these building blocks given the company’s starting point and competitive context.
Choosing the Right Locations for Profitable Growth
To ensure continued growth as the investment landscape evolves, companies—including those who enjoy success in their home markets, or local champions—will need to consider where and how to expand their geographic reach. During the next five years, construction growth is expected to slow in China and South America, while some European and Asian markets that have been sluggish in recent years are expected to pick up steam. For example, the UK government’s infrastructure investment is expected to grow by 3% annually during the next five years, following no growth from 2011 through 2015.
Local champions in markets where the government ramps up infrastructure investment can achieve significant improvements in revenue, margin, and cash flow, especially in markets that are difficult for foreign players to enter. Local companies are more likely to win large projects if foreign competitors do not bid on them, and, because the winning bids will probably be higher, margins will be, too.
Japan is a case in point. Foreign direct investment (FDI) as a percentage of GDP is significantly lower in Japan than in the other large ECS markets. This gives Japanese companies a considerable advantage in competing for major domestic projects. Moreover, the many projects related to the earthquake and tsunami recovery and the 2020 Olympics have driven up construction prices, leading to robust profits for local companies.
Among the Japanese companies benefiting from these circumstances is Taisei. The infrastructure construction company has capitalized on its advantaged position and strong reputation in the Tokyo area to win Olympics projects, including the construction of the centerpiece of the games: the stadium.
Such local champions may find it tempting to focus their business development efforts on cash-rich local markets. However, their financial security at home may put them in a strong position to enter foreign markets. Indeed, to stay competitive in the changing global market, ECS companies must decide whether to expand abroad and, if so, how to select new markets.
Companies can gain strong positions in surging foreign markets by making strategic acquisitions of local champions. For example, Salini Impregilo, an Italian concessionaire and industrial construction company, has built itself into a global player by using its strong cash position to acquire companies that give it a foothold in several markets, including Central Europe and Latin America. In 2015, 78% of new orders came from outside Europe, and the company has active projects on six continents. The recent acquisition of Lane Industries, one of the premier US highway contractors, enhances Salini Impregilo’s ability to expand in the US.
Similarly, Ferrovial has chosen its markets carefully. The Spanish integrated construction and concessionaire company has solidified its financial position by strengthening its presence in a few well-established core markets while slowly and deliberately expanding its global footprint by focusing on countries with high infrastructure needs, sound legal and regulatory environments, and established financial markets. Ferrovial’s business is concentrated in Spain, the US, Canada, Poland, and the UK. Additionally, the company is developing a stable presence in Australia through its services and construction contracts, the award of a toll road concession, and its recent acquisition of Broadspectrum, a contract services provider. Ferrovial’s deep understanding of the countries where it has a strong presence allows it to generate a stable flow of business at relatively low risk.
Including High-Margin, Niche Skills in an Integrated Portfolio
Given the low-growth environment, margins have become more important in generating TSR. As a result, companies specializing in high-margin, niche skills (such as tunneling and dam construction) that have significant entry barriers are well positioned to become the ECS industry’s top players. These entry barriers include the need for specialized equipment, as well as personnel with the extensive experience required to minimize project risk and maximize the probability of success. Like companies with advantages in particular countries, those that have the right equipment and expertise will have a critical advantage over potential entrants, thus improving revenues and margins.
For example, one of the core competencies of WS Atkins, a UK D&E and project management company, is rail tunneling, a highly technical and complex engineering specialty. During the past few years, the company’s rail-tunneling projects in the UK and the Middle East have been a steady source of revenue. Tunneling has several attributes of a high-margin skill, including a limited number of rivals. In markets such as the UK, which is highly competitive and has many foreign players, companies can use such expertise to preserve margins. Indeed, Atkins’s consistently high TSR is generated by strong margins and cash flow.
For many top tunneling companies, this skill is only one aspect of their business. This suggests that adding tunneling expertise, or a similarly valuable niche skill, to an integrated portfolio, such as through an acquisition, can improve performance. However, high-margin, niche capabilities typically generate limited revenue, so it may be difficult for very large companies to justify the investment required to obtain and manage such capabilities. And small players generally lack the resources to acquire them through M&A.
Midsize companies, however, could be well positioned to add high-margin, niche capabilities—the opportunities for revenue growth are meaningful to them, and they have the resources to build or acquire such skills. Moreover, by adding them strategically, midsize companies could demonstrate new avenues of growth to investors in the short term and support profitable growth in the longer term. In doing so, these companies could receive a boost to TSR. As shown in Exhibit 13, companies in developed countries, excluding Japan, in the middle revenue quartiles trail those in the top and bottom quartiles in TSR and have negative five-year median TSRs.
Pursuing M&A Strategically
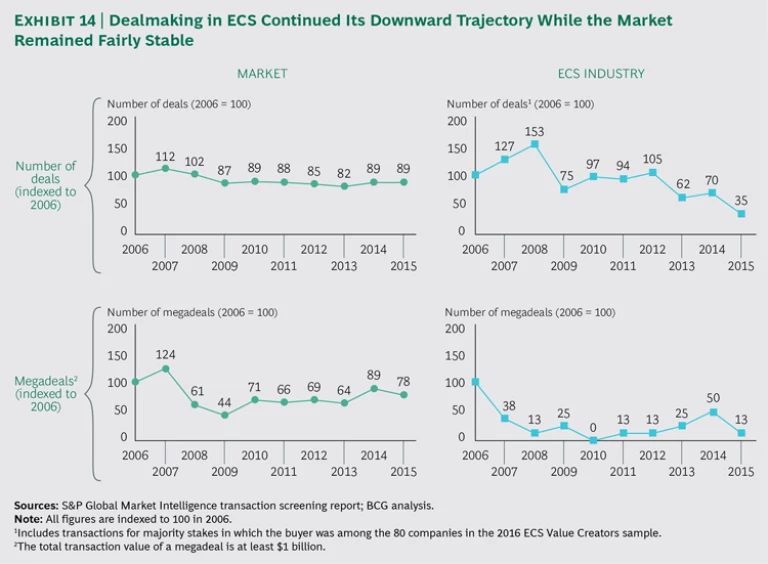
After several years of robust M&A activity in the ECS industry, the pace of dealmaking has decreased substantially. In 2015, the number of M&A deals by ECS companies in our sample declined by 50% from 2014 and by 67% from the postrecession high set in 2012. (See Exhibit 14.) The 2015 figure is, by far, the lowest it has been in the past decade. Moreover, in 2015, the number of “megadeals” (those with a total transaction value of at least $1 billion) involving ECS companies declined by approximately 75% from the postrecession high set in 2014. These sharp declines occurred even as the number of M&A transactions across industries remained near postrecession highs.
What explains the sudden drop in M&A activity among ECS companies? One potential answer is M&A fatigue. Almost three-quarters of the companies in our sample (57 out of 80) engaged in M&A activity from 2012 through 2014. Many of them have been involved in deals in multiple years. They most likely curtailed their dealmaking in 2015 to focus on integrating their purchases.
Even as companies seek to capture the value from past deals, they should be on the lookout for acquisitions that can enable entry into attractive geographic markets or high-margin businesses. Despite last year’s sharp drop in M&A activity in ECS, valuation multiples point to the need for a selective approach rather than a buy-at-will mindset. Although the median valuation multiple for ECS fell to 8.6 in 2015 and trails that of the S&P 500, it is still higher than in all but five years since 1975 (from 2004 through 2007 and in 2014).
Redesigning Processes for Cost Efficiency
As we discussed in last year’s report, companies must pursue process efficiencies to sustain wide margins. (See 2015 ECS Value Creators Report: Opportunities amid Uncertainty, BCG report, August 2015.) The imperative for ECS companies to improve the bottom line is likely to persist for the foreseeable future. Potential avenues for minimizing costs include achieving superior performance with respect to pricing and bidding, procurement, operational effectiveness, and organizational streamlining and rightsizing.
It is important to note, however, that the top-performing companies in our sample have produced their high margins by both increasing revenues and containing costs. This points to the importance of pursuing process efficiencies in conjunction with, not to the exclusion of, growth initiatives. Cost containment should focus on non-value-adding activities, and the savings should be reinvested in revenue-producing activities.
Creating a Focused Project Portfolio
As ECS companies turn their attention to enhancing margins and cash flows, they must carefully manage their portfolios to achieve the right mix of projects with respect to size, regions, skills, and cash profile.
A company’s business model and strategy should guide its mix of projects. A focused portfolio may be easier to manage than a diverse one, especially with respect to project size. Managing both small and large projects is difficult because the optimal tools, processes (including for sales and business development), and culture are different for each type. And the performance of the portfolio is likely to suffer. Companies in developed countries with high TSR focus on either small or large projects, while midsize companies have seen TSR decline. To improve their performance, midsize companies should consider a portfolio that combines a stable base of midsize projects in their home countries with larger projects abroad. The midsize projects at home will entail lower risks and probably have lower margins, while the larger projects abroad will be high risk but have the potential for a higher return.
Ferrovial has achieved consistently high TSR by applying the capabilities of its business units in a coordinated fashion to its portfolio of large, complex projects. While each business unit has its own P&L accountability and financial targets, Ferrovial analyzes opportunities at the group level, looking to maximize synergies across units, especially in complex projects that differentiate the company from competitors. Ferrovial supports these efforts by fostering a culture of operational excellence and innovation, with a clear focus on risk management and cash flow generation.
Fully Embracing Digital Technologies
To reap the benefits of digitization, ECS companies need to shape their digital transformations. Leaders should focus on several concrete steps:
- Build teams that include new digital competencies. Become a magnet for “digital natives” in the talent pool. Set up a central innovation or BIM department to institutionalize digital initiatives and expand the digital knowledge base more quickly. Large companies should appoint a chief technology officer.
- Establish the technological foundation. Identify and prioritize the most relevant digital technologies on the basis of their maturity levels and the business and market needs they address. Invest in the required software and hardware tools and IT infrastructure. Gain access to, or ownership of, the relevant data generated during the construction life cycle.
- Disseminate digital skills across the company. Assess the changes required for the workforce at large, taking digitization into account in strategic workforce planning. Upgrade and provide training for the relevant digital skills, bearing in mind that decentralized information and augmented reality will enable lower- skilled workers to perform some complex tasks. Establish a company culture that is conducive to innovation and to the improvement of digital skills. Include all dispersed divisions and teams in the transformation.
- Complement digital capabilities through third parties. Collaborate with suppliers, competitors, and project owners to accelerate learning and compensate for any lack of internal resources. A liaison with a startup, such as the collaboration between the construction giant Bechtel and the drone pioneer Skycatch, can help a large company benefit from digital advances quickly.
In addition, ECS companies should adjust their business models in response to new opportunities and challenges. BIM and other new technologies will increase integration across all phases of the value chain, thereby creating the need for more-integrated forms of project delivery and alliance models. This, in turn, will call for broader life-cycle competencies (from design through engineering, construction, and operations and management), which can be realized, for example, by diversifying horizontally through M&A. For D&E companies, the emergence of comprehensive collections of design modules (known as object libraries) will commoditize simple tasks, while the ability to conduct work streams simultaneously will facilitate distributed engineering and offshoring. For construction contractors, using BIM to design and simulate projects more accurately and catch inconsistencies earlier will reduce the relevance of change requests as a revenue stream.
Combining the Building Blocks Effectively
The winning ECS companies will thoughtfully combine most of these building blocks. For each company, the right ones to pursue will depend on its strategic starting point, with respect to locations and specialties, as well as its competitive context. In a recent discussion with BCG, Atkins described how it has applied four of the building blocks to deliver its high TSR.
Locations. To decide where to invest, Atkins first looks at the locations where it is already operating, but at less than full scale, and then considers the markets where it believes there are good opportunities for growth. For example, the company has a long-term goal of expanding its strategic footprint in North America. The energy industry—nuclear energy, in particular—seems to offer attractive opportunities there. The company is also exploring possibilities in Southeast Asia, where, driven by urbanization, infrastructure spending is high. Early in 2016, Atkins established a foothold in Africa by acquiring Howard Humphreys East Africa, a multidisciplinary consultancy based in Tanzania and Kenya.
Skills. Atkins has a very broad portfolio. In recent years, its acquisition strategy has supported the growth of its skill sets. Recent acquisitions include:
- Confluence Project Management, expanding Atkins’s project and program management capabilities and its presence in Southeast Asia
- Nuclear Safety Associates, adding expertise in nuclear safety, design engineering, and security services
- Houston Offshore Engineering, adding expertise in the design of offshore floating platforms for the oil and gas and offshore- wind-power markets
- The projects, products, and technology division of EnergySolutions, a US company that specializes in managing nuclear sites, adding decommissioning capabilities and accelerating the company’s overall nuclear strategy
Strategic M&A. Atkins requires absolute clarity on the objectives of any merger, including the sources of value, the growth strategy, and how and when it can capture the upside. It also requires a strong familiarity and fit with the target’s culture before making the deal.
Processes. Atkins applies thorough internal controls to ensure that it takes on projects that provide the right balance of risk and profitability. And stakeholders throughout the organization participate in decision making.
The company has set public, multiyear goals to increase margins to 8%, a top-quartile target. To achieve this, it adheres to a variety of internal processes:
- Operational Excellence. The company pursues operational excellence throughout the enterprise, with a distinct emphasis on optimizing the financial delivery of its projects.
- Organization Structure. Atkins has reorganized its UK business and adopted an expertise-based “technical professional organization” structure in its North American business. It has also increased the use of global design centers as a source of competitive advantage and quality resources.
- Portfolio Optimization. Atkins continually reviews its business portfolio in an effort to focus on higher-growth, higher- margin activities and divests businesses that do not support its objectives. Examples include the sales of its business in Poland, its UK highways services operations, and a construction management unit in North America.
- Industry and Regional Focus. The company prioritizes industries, such as energy, and regions, such as Southeast Asia, in which its can grow organically and inorganically at attractive margins.
Five Imperatives for Value Creation
Local champions and ECS companies specializing in high-margin, niche skills are well positioned for strong value creation. These companies should strive to protect their advantages while diversifying their portfolios in terms of regions and skills in order to promote growth.
Executives of less-advantaged ECS companies should consider the following five imperatives in devising their value creation agenda:
- De-average the portfolio. Have we analyzed the performance of each business unit and customer segment? Do we know which are delivering acceptable returns and which are underperforming?
- Think about capabilities through the lens of comparative advantage. In which capabilities does our company outperform others? In which markets do we have a subscale or commoditized offering? To what extent have we filled our portfolio with low-margin or high-risk projects just to keep employees busy? Are these projects undermining our ability to bid for more-attractive projects?
- Pursue cost and process discipline in conjunction with growth initiatives. Do we focus our cost-containment efforts on areas not related to revenue growth (for example, overhead rather than revenue- producing employees)? When we reduce the costs of low-value areas, do we ensure that the savings are reinvested in growth areas?
- Make strategic deals. Are we prepared to take advantage of the slowdown in deal activity and the relatively low valuation multiples to pursue M&A strategically? Have we considered how adding capabilities or entering new regions can increase our “shots on goal” (that is, position us to win more high-priority projects) and enhance our mindshare with customers?
- Look for growth opportunities in technology. How can we tap into and exploit opportunities to create value through ECS technologies?
For the ECS industry, the years since the Great Recession have been marked by a sluggish and uneven recovery. To be sure, our 2016 ECS Value Creators study found that some companies have benefited from being in the right place, or having the right skills, at the right time. However, relying on good luck is not a sound basis for creating and sustaining value over the long term. As our study also found, investors reward companies that demonstrate the ability to move beyond their starting position by pursuing the success factors we have described. To join the ranks of the top value creators, ECS companies will need to prioritize the right building blocks and determine how to maximize their advantages in the challenging environment.
Acknowledgments
The authors wish to acknowledge the contributions of Fabio Cantatore, Nick Houston, Stephanie Hurder, and David Taube. The authors also thank David Klein for his assistance in writing this report and Katherine Andrews, Mickey Butts, Gary Callahan, Kim Friedman, Abby Garland, Amy Halliday, and Sara Strassenreiter for their contributions to its editing, design, and production.


