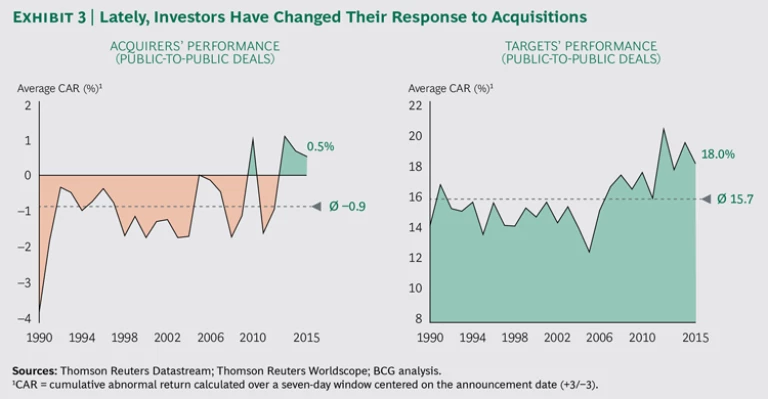
Following a strong 2014, the year 2015 will go into the books as a record for global M&A deal making. But in the long run, it may also be remembered as the year in which a sea change in investors’ appetite for deals became apparent. Capital markets have long greeted acquisition announcements with skepticism—and with good reason. Research, including our own, has consistently shown that most deals destroy value. But, as we explore in the following pages, markets in recent years have behaved differently than in the past and started bidding up shares of acquiring companies—by an average of 0.5% in the seven-day window around the announcement. In the current market environment, at least, investors are showing more trust in, and higher expectations for, dealmakers.
There’s a sound reason for this shift. Our research on, conversations with, and work for global companies and investors has found that in an extended period of low growth and inexpensive financing, markets see deal making (both acquisitions and divestitures, assuming they are well planned and executed) as one of the few available avenues to grow value. The Boston Consulting Group's 2015 M&A report confirmed that companies that do their homework and practice disciplined postmerger integration can indeed acquire their way to growth in both earnings and shareholder returns. (See “Should Companies Buy Growth?,” BCG article, October 2015, and “From Acquiring Growth to Growing Value,” BCG article, October 2015.) Our 2014 report reached a similar conclusion about divestitures.
Companies can indeed transact their way to value creation, but it takes practice and a commitment to M&A as a strategic lever of the same sort as innovation or geographic or market expansion. In the accompanying articles that make up this year’s report, we explore the success of “portfolio masters”—companies that consistently reshape their corporate portfolios, using both acquisitions and divestitures as an essential component of their strategy. (We define portfolio masters as companies that execute at least five major transactions, buying or selling, over a five-year period.) (See “Are M&A Deal-Making Skills Value-Creating Skills?” and “How Portfolio Masters Make M&A Work for Shareholders,” both BCG articles, August 2016.) For these companies, M&A is a viable—and proven—value creation strategy.
From Record Heights to an Uncertain Outlook
It’s hard for any market to maintain double-digit growth rates for long, even when the fundamentals are acting mostly in its favor. Following a strong 2014 and a heated 2015, when M&A activity approached record territory, the announced volume and value of deals subsided sharply in the first half of this year, with global deal values contracting 27% compared with the first half of 2015. That said, the second quarter of 2016 saw a 14% increase in activity over the first three months of this year. Looking out from its new heights, the market appears unsure where it is headed.
General market uncertainty and increased volatility may be good reasons for companies to take a cautious approach to transactions (even though certain types of dealmakers actually thrive in this type of environment, as we show in detail elsewhere in this report). (See “How Portfolio Masters Make M&A Work for Shareholders,” BCG article, August 2016.) Corporate caution and market unpredictability are fueled by a number of factors, including the following:
- An unclear economic and political future for the European Union, resulting in part from the UK’s vote to exit the bloc.
- Significantly higher volatility in equity markets, complicating execution of IPOs as part of an M&A “dual track” strategy and making share-based deals in general less predictable.
- A tightening of regulations to thwart so-called inversion deals (transactions that enable companies to reduce tax burdens by establishing new domiciles overseas).
The number of deals—and big deals—that have been aborted or withdrawn is substantial: the failed Pfizer-Allergan transaction, the terminated Halliburton–Baker Hughes merger discussions, and the canceled divestment of Philips’s lighting equipment business unit to Chinese investor GO Scale Capital are only a few examples.
Still, first-half 2016 M&A levels are on a par with ten-year averages, and there is plenty of disagreement among practitioners as to whether the recent slowdown represents the beginning of a significant drop-off in activity or just a temporary pause in a market with plenty of momentum left.
As always, geopolitical events are a wildcard. In our view, most (if not all) of the fundamental drivers of M&A activity in 2014 and 2015 are still in place—low GDP growth, cheap money, available cash, and the need for growth among companies and for returns among private equity (PE) players. Deal making remains broadly active across industries and geographies. In some regions, such as China, outbound deal activity levels rose above historical levels in the first part of 2016.
Regardless of whether we are facing a breather or a more serious break in the action, there are compelling reasons for more companies to look more seriously into M&A—on both sides of the transaction—as a powerful tool for value creation, as we explore in depth in the 2016 M&A report.
Firing on All Cylinders: M&A Activity in 2015
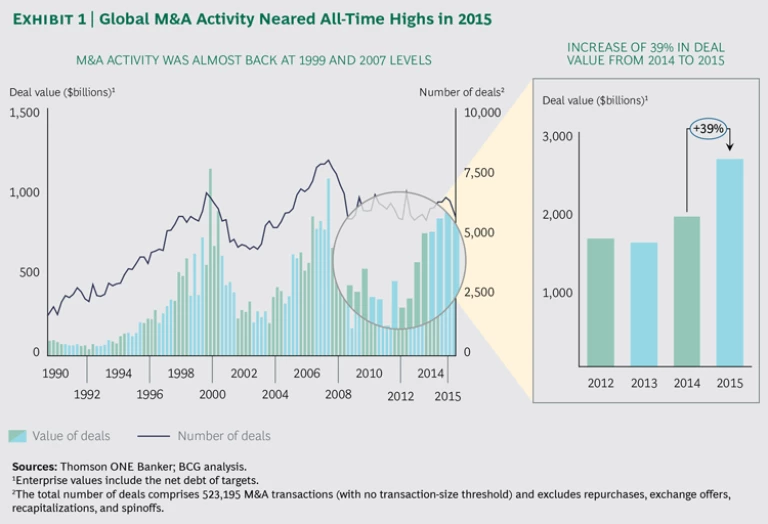
Total M&A activity in 2015 returned to levels last seen in the “new economy” peak of 1999 and the pre-Lehman bankruptcy era of 2007. Global deal value increased by almost 40% last year on top of 2014 growth of more than 20%. (See Exhibit 1.)
Growth in 2015 was strong across almost all sectors, with a number of industries showing high double- or even triple-digit percentage increases. (See Exhibit 2.) These included health care (102% year-on-year growth), consumer and retail (53%), and media, entertainment, and telecommunications (48%). The only major sector showing a decline was energy and power, reflecting the industry’s continuing struggle with low fossil fuel prices, regulatory pressures, and a long-term trend toward a more sustainable energy mix.
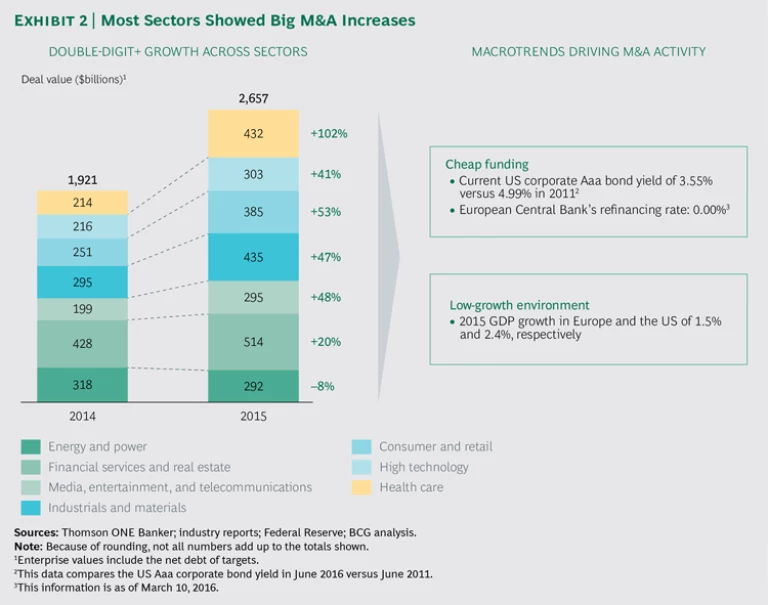
The continued low-growth environment in 2015—a 1.5% GDP increase in Europe and a 2.4% rise in the US, for example—contributed to the overall M&A boom, as did inexpensive funding (thanks to continued quantitative easing programs by central banks). In such circumstances, M&A has become a popular way for many companies to search for growth when organic growth opportunities are limited.
In health care, for example, a number of large-scale transactions marked another round of industry consolidation. Beyond cost savings, the motivations behind multiple megadeals included building out product portfolios (Teva-Allergan) and strategic realignment (the Sanofi–Boehringer Ingelheim asset swap). Tax efficiencies were also a deal driver for part of the year until the US government moved to stop inversion transactions involving US companies.
Large-scale consolidation (such as Anheuser-Busch InBev’s acquisition of SABMiller and the Heinz-Kraft merger) was behind M&A growth in consumer goods and retailing. Companies in this sector also pursued smaller transactions in order to acquire new capabilities—especially in the areas of digital innovation and e-commerce.
Two principal drivers were behind activity in the high-tech sector: technology companies expanding their offerings toward integrated systems (Dell’s acquisition of data storage company EMC is one example of this) and nontech players acquiring technology companies in order to augment their product offerings and their internal capabilities. In fact, nontech acquirers appear to have at least three motives in snapping up digital assets. One is the acquisition of new technology platforms in order to expand their core business—one example being clothing maker Under Armour looking to boost sales by gaining access to a digital fitness network, MyFitnessPal. A second is to gain control of a strategic technology. German automakers Audi, Daimler, and BMW paid $3.1 billion for Nokia’s maps business (“Here”)—a key technology for self-driving cars. The third is the desire to improve operations by using technology to enhance productivity—the rationale behind tire manufacturer Saehwa Imc’s acquisition of Cube Tech, a 3D printing company.
The value of M&A deals increased significantly in all major regions. Deal value in North America jumped 47% to $1.4 trillion in 2015, fueled by a 53% growth in domestic M&A and a big rise in cross-border transactions, many originating from Asia (a 32% increase over 2014). China was especially active: for example, Qingdao Haier acquired GE’s appliances business, and Tencent Holdings bought video game maker Riot Games.
M&A activity in Asia-Pacific grew by 60% to $539 billion. Transactions in Europe, which totaled $568 billion, showed the smallest increase, only 18%. Europe-based acquirers lost their appetite, in particular, for targets in their neighborhood. The total year-over-year value of intra-Europe deals contracted by 5% to $315 billion, while Europe-originated acquisitions in North America increased by roughly one-third. The shift toward North America could be seen as a flight to a “safe haven.” Political instability in parts of Europe and unresolved questions regarding economic and political integration in the European Union may continue to push European buyers to look for targets in more stable environments with better growth prospects.
Shifting Investor Perceptions Toward M&A
There seems to be a shift in investors’ views of M&A. We would argue, however, that it is temporary and based on current macroeconomic conditions rather than a longer-term sea change.
The typical paradigm for years was that while sellers earned an attractive takeover premium on the deal, the average acquirer’s stock fell on concerns of poor strategic fit, deal complexity, or doubts about synergy realization. In the past three years, however, despite high and rising preannouncement valuation levels and generous acquisition multiples, the cumulative abnormal returns of both targets and acquirers have been positive. (
As highlighted in our recent investor survey, investors are looking for new value-creation strategies in a world of low GDP growth and limited opportunities. (See “In a Tough Market, Investors Seek New Ways to Create Value,” BCG article, May 2016.) Strategic acquisitions are more often than not seen as the most effective value-creating use of capital, even despite lofty acquisition multiples.
High Valuations and Strong Momentum
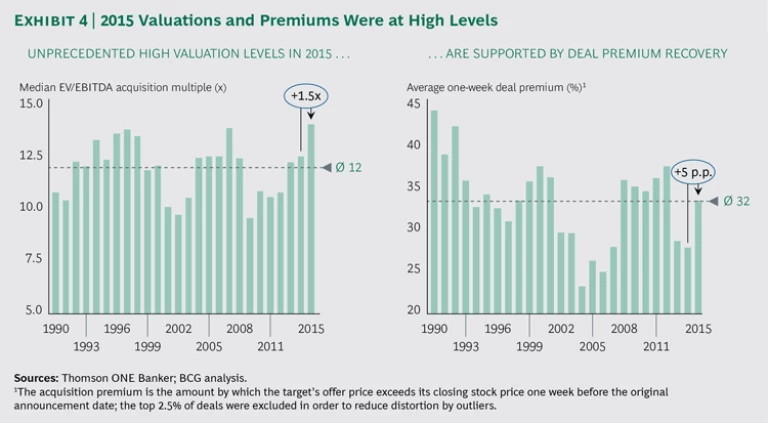
Valuation levels were at all-time highs in 2015, with the median deal fetching an enterprise value (EV)/EBITDA multiple of 14—an increase of 1.5 points over 2014 levels and well above historical averages of about 12. (See Exhibit 4.) Multiples paid in 2015 were even higher than those at the peak of the dot-com bubble and just before the financial crisis. The simultaneous increase in deal premium of 5 percentage points approached the historical average of about 32% and was a key driver of the multiple expansion as sellers increasingly demanded higher takeover premiums to let go of their shares. This premium expansion meant that sellers in 2015 reaped a higher share of a deal’s expected synergies, which puts an added burden on acquirers both to assess potential synergies accurately and to make sure that they realize them fully once the transaction closes.
It’s important to note that the overall increase in valuation levels is not the result of a shift in M&A activity toward higher-multiple industries such as high technology. The 2015 valuation levels reflect a general upswing in numerous sectors. In fact, EV/EBITDA multiples in the majority of sectors climbed well beyond 2007 precrisis levels. (See Exhibit 5.) Median health care multiples, for example, ended 2015 at a record level of approximately 20 times EBITDA (3.7 points higher than 2014)—clear evidence of the significant synergy potential investors associate with large-scale mergers in this industry. The typical high-tech firm was acquired for 18 times EBITDA—up 1.2 points from the relatively high values in 2014 and 2.5 points over multiples in 2007. In 2015, a technology company with $500 million in EBITDA would have had an acquisition enterprise value $1.25 billion higher than in 2007.
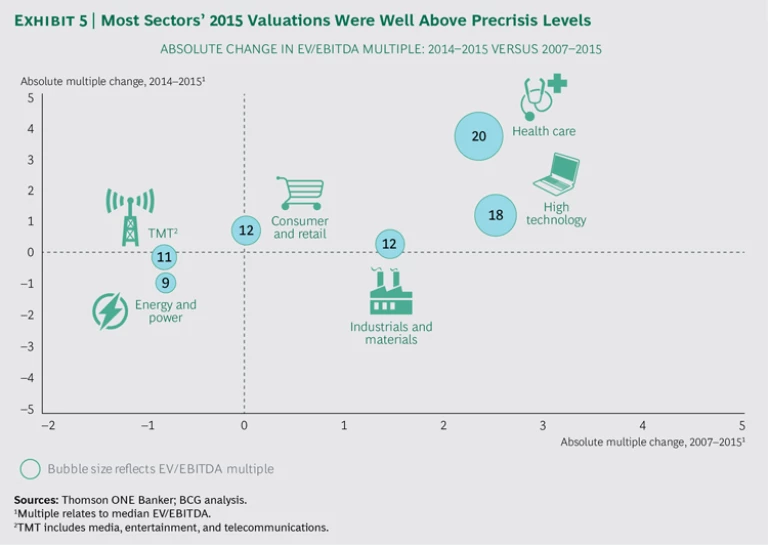
The only sector showing a decline in valuation levels in 2015 was energy and power, reflecting the industry’s continuing struggle against low fossil fuel prices, regulatory pressures, and a long-term trend toward a more sustainable energy mix. The typical energy and power company in 2015 traded at approximately 9 times EBITDA—a full point lower than in 2007.
Is a Bubble Forming?
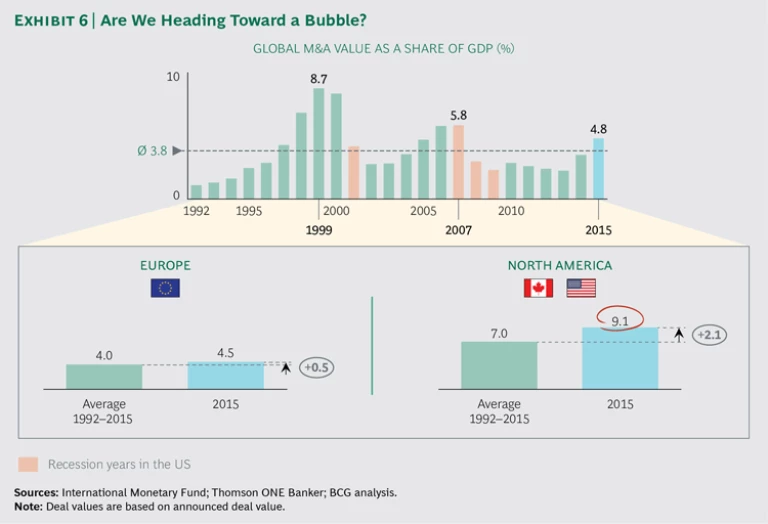
Taken together, the combination of trends and indicators in 2015 had the signs of a classic bubble preparing to burst. Global M&A value as a share of GDP had been rising steadily for the past three years and, at the end of 2015, stood at 4.8%—one full percentage point above its long-term historical average. Similar developments, albeit at even higher levels, were precursors of the technology bubble’s bursting in 2001 and the financial crisis of 2008. (See Exhibit 6.)
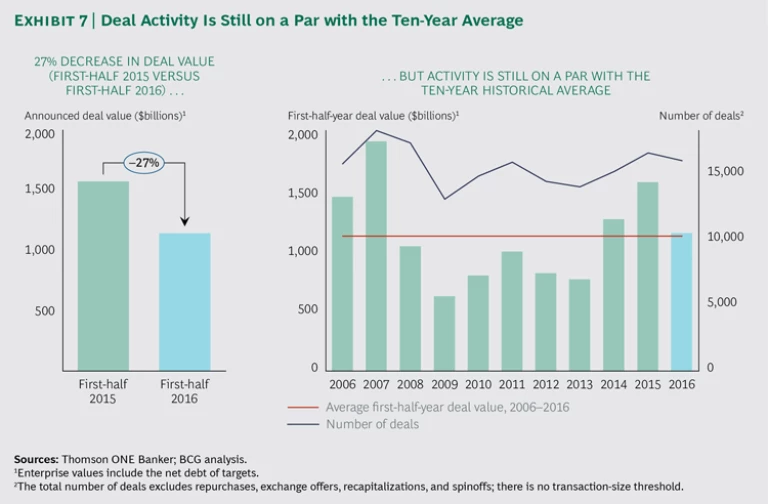
And, in fact, M&A value contracted in the first half of 2016 by more than 25% compared with the first half of 2015. That said, deal activity is at a par with ten-year historical averages, and the jury is still out on whether there are similarities to previous M&A market collapses. (See Exhibit 7.) The second quarter of 2016 saw a 14% uptick in activity from the first.
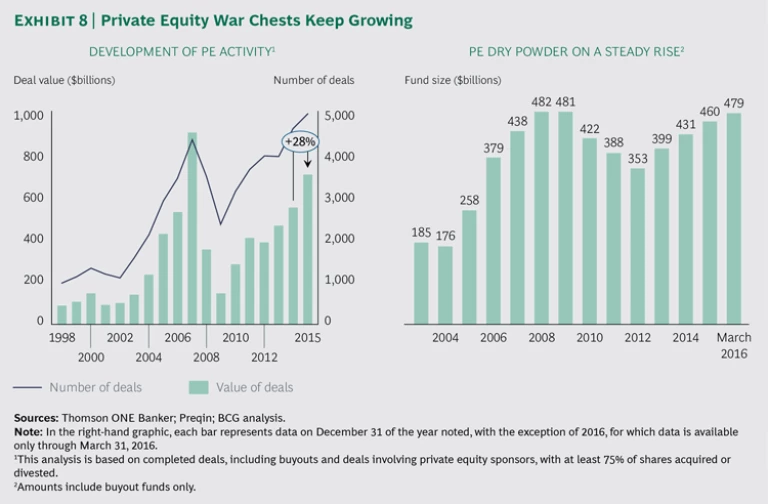
Going forward, we see two underlying factors supporting continued M&A activity. First, while PE buyers were highly active in 2015, their war chests also continued to grow, and they still face the need to put their money into play. (See Exhibit 8.)
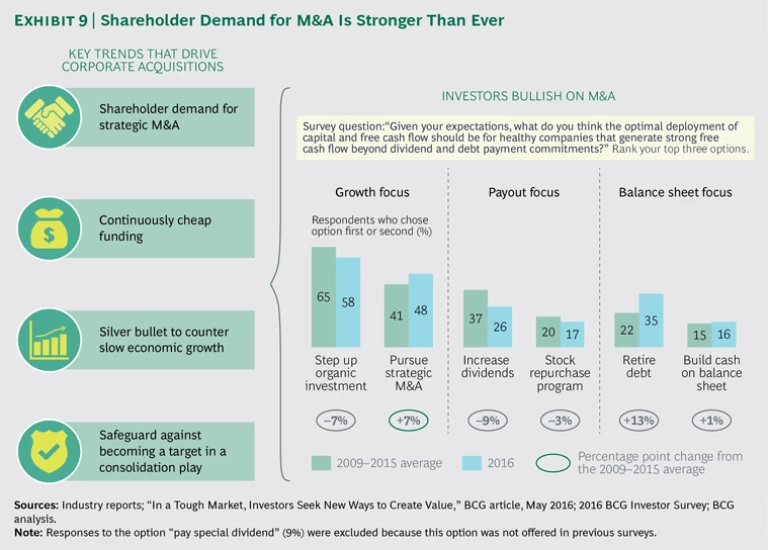
Second, investors are pushing corporate leaders to pursue strategic deals. (See Exhibit 9.) More investors than ever see strategic M&A as an attractive way to deploy capital in the current low-growth, cheap-funding environment (48% in our 2016 investor survey versus a 41% average among our 2009 through 2015 investor surveys). At the same time, in a clear sign of the times, fewer investors than ever prefer increasing investment in organic growth.
Irrespective of whether overall M&A market activity remains at current levels, slows through 2016, or bounces back in the second half, so long as debt funding is relatively cheap and economic growth is low, M&A deals will flow. And while some investors appear to be taking a balanced and cautious approach in these circumstances, others are likely to see this time as an opportunity to make bids for carefully selected and well-tracked assets. One such example is the proposal by SoftBank of Japan to acquire British chipmaker ARM in the aftermath of the UK’s “Brexit” vote and the related weakness in the British pound.
Other companies will continue with their strategic agenda despite the market backdrop—see Bayer’s bid for Monsanto or Microsoft’s proposal to acquire LinkedIn, for example. The first six months of 2016 have also highlighted (again) that China is a force to be reckoned with. ChemChina’s $43 billion bid for agrochemical company Syngenta, HNA Group’s proposed $6.3 billion acquisition of IT distributor Ingram Micro, and Midea’s $4.5 billion tilt at industrial-robot-maker Kuka are just three examples among many that illustrate the magnitude of China’s outbound M&A appetite.
No matter where the market goes, the core question is whether firms are generating superior returns for shareholders from the transactions that they pursue and at what level of risk—a factor often neglected in boardrooms when it comes to M&A decision making.
Paderborn University
This report would not have been possible without the partnership of Paderborn University, the University for the Information Society, which has a strong foundation in computer science and its applications. Paderborn’s chair of international accounting, Sönke Sievers, focuses on research relating to information processing in financial markets and valuation. In addition to academic research, he intensively collaborates with business partners to advance knowledge in the fields of corporate finance, accounting, and mergers and acquisitions.
Acknowledgments
The authors are grateful to Kurt Schulze, Axel Werries, Anton Kashyrkin, Eugene Khoo, and Sharon Ng for their insights and their support on the research and content development of this report. They would also like to thank Boryana Hintermair for coordinating the publication of this report, David Duffy for his assistance in writing the report, and Katherine Andrews, Gary Callahan, Kim Friedman, Abby Garland, Pamela Gilfond, and Sara Strassenreiter for their contributions to its editing, design, and production.


