From 2002 through 2012, the mining industry created considerable shareholder value. The Boston Consulting Group analyzed 42 companies and found that they delivered an average total shareholder return (TSR) of about 16 percent each year—double the returns of the S&P 500 for the decade. The top ten performers delivered an average annual TSR of about 35 percent—twice the average return of the companies in our sample.
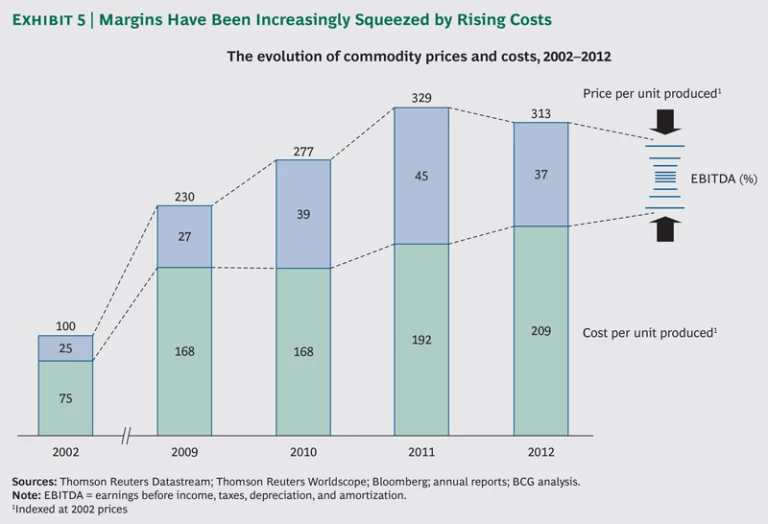
Yet the picture from 2009 through 2012 stands in stark contrast to the decade as a whole. Commodity prices—accountable for 12 of the 16 percentage points of annual TSR during the decade—fell, on average, by 5 percent annually. At the same time, operating costs continued to rise. For the companies in our sample, from 2002 through 2012, unit costs rose at a compound annual growth rate of about 11 percent, growing by as much as 14 percent from 2010 through 2011. As margins were squeezed, shareholder returns suffered.
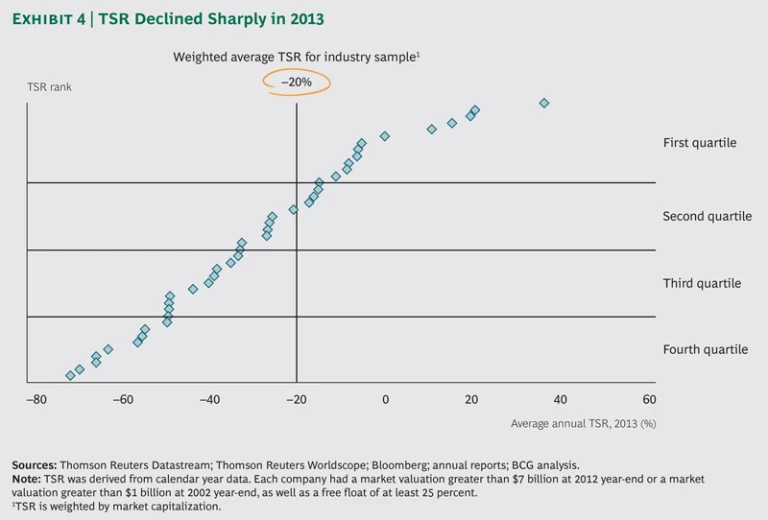
By the end of 2013, the combination of falling commodity prices and rising operating costs had caused the average annual TSR to plummet to –20 percent. Together with diminished investor expectations, these forces have put the industry under tremendous pressure. Given the persistent economic uncertainty, growth in demand is unlikely to resurge in the near term.
In this harsher, less certain economic environment, some mining companies have already undertaken efforts to reduce operating and capital costs. However, achieving healthy returns and enabling long-term success requires a steadfast focus on productivity.
The culmination of several months of research and analysis, this report describes a holistic approach to productivity that includes improving the effectiveness of management systems, the efficiency of physical assets, and the people dimensions of mining operations. The insights and lessons the report contains are drawn from BCG’s extensive work with top companies around the globe, within and outside the mining industry. Companies that embrace what we call the productivity imperative will discover ways to use the current environment to their advantage and emerge leaner and better prepared for future growth.
The Decade in Retrospect
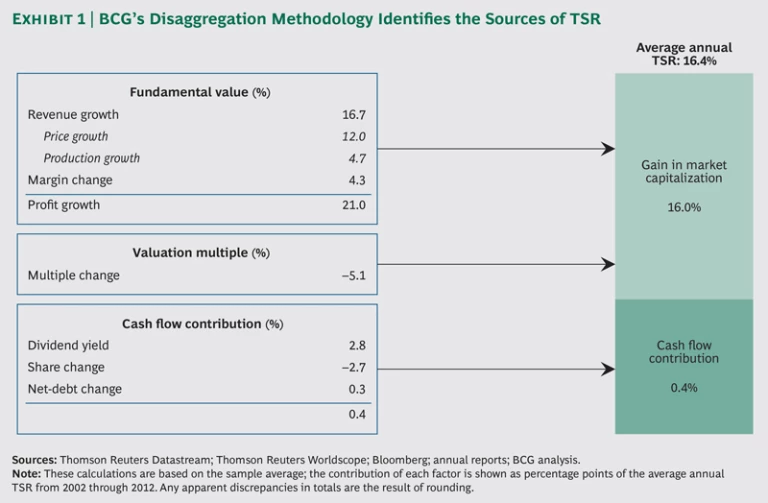
For investors, mining was a lucrative industry during the decade from 2002 through 2012. The Boston Consulting Group analyzed 42 companies for this third annual Value Creation in Mining report and found that they delivered an average annual total shareholder return (TSR) of about 16 percent—8 percentage points more than the S&P 500. Investors who staked their money on the top ten companies were rewarded with a stunning average annual TSR of about 35 percent—more than double the average return of all of the companies in our sample. In other words, a dollar invested in a top-ten company in 2002 would have been worth $20 by 2012; a remarkable result indeed. Certainly, commodity prices provided a strong tailwind, contributing 12 percentage points to TSR. The remaining increase came from factors that each company had the ability to influence: notably production growth as well as dividend yield. (See “The Components of TSR” and Exhibit 1.)
THE COMPONENTS OF TSR
Total shareholder return is the product of multiple factors. Readers of BCG’s Value Creators series are likely familiar with the BCG methodology for quantifying the relative contribution of the various sources of TSR. (See the exhibit below.) The methodology uses a combination of revenue (that is, sales) growth and change in margins as an indicator of a company’s improvement in fundamental value. It uses the change in the company’s valuation multiple to determine the impact of investor expectations on TSR. Together, the improvement in fundamental value and the change in the valuation multiple determine the change in a company’s market capitalization and the capital gain (or loss) to investors. Finally, the methodology tracks the distribution of cash flow to investors and debt holders in the form of dividends, share repurchases, and repayments of debt in order to determine the contribution of cash flow payouts to a company’s TSR.
The important thing to remember is that these factors all interact—sometimes in unexpected ways. A company may grow its revenue through an acquisition and yet create no TSR, because the new acquisition has the effect of eroding the company’s gross margins. And some forms of cash contribution (for example, dividends) have a more positive impact on a company’s valuation multiple than others (for example, share buybacks). Because of these interactions, we recommend that companies take a holistic approach to value creation strategy.
The Best and the Rest
The top ten companies delivered stellar TSR primarily because of superior growth in valuation multiples (which accounted for slightly more than half of the outperformance) and heftier cash-flow contributions (which explain most of the remainder). Digging deeper, we find three types of superior performers among the top ten. (See Exhibit 2.)
- Profitable Growers. Companies in this category rapidly brought new mines into production and expanded existing sites while maintaining or even increasing their profit margins. These organizations avoided the trap of pursuing growth at any cost. They maintained their valuation multiples and delivered a steady cash-flow contribution, becoming significant players in the mineral sectors in which they compete. Shareholders have benefited handsomely.
- Cash Flow Managers. Less focused on growth than profitable growers, these outperformers pursued value by enhancing margins, reducing debt, and paying strong dividends. They avoided major expansions, forgoing accelerated growth but avoiding rampant increases in capital intensity and the difficulties that many megaprojects experienced.
- Multiple Enhancers. Like profitable growers, multiple enhancers enjoyed a steady cash flow, but much of their outperformance was derived from the increase in valuation multiples. A range of factors contributed to this rise, including a reduction in debt over the course of the decade.
Companies in the bottom quartile of TSR performance also saw revenues rise—by 14 percent annually. But much of this increase came from higher commodity prices rather than production growth. At the same time, the profitability of existing operations remained subdued until late in the decade, which meant that additional funding was needed to pay for growth projects or acquisitions. These companies had to issue more equity and debt, as well as keep dividends low. Together, these practices reduced TSR by 7 percentage points each year. Declining investor confidence further drove down valuation multiples, reducing TSR by another 7 percentage points. The bottom quartile of our sample delivered, on average, an annual TSR of only 4 percent from 2002 through 2012—similar to the yield of a ten-year U.S. Treasury bond, but with far greater volatility.
A Reversal of Fortune
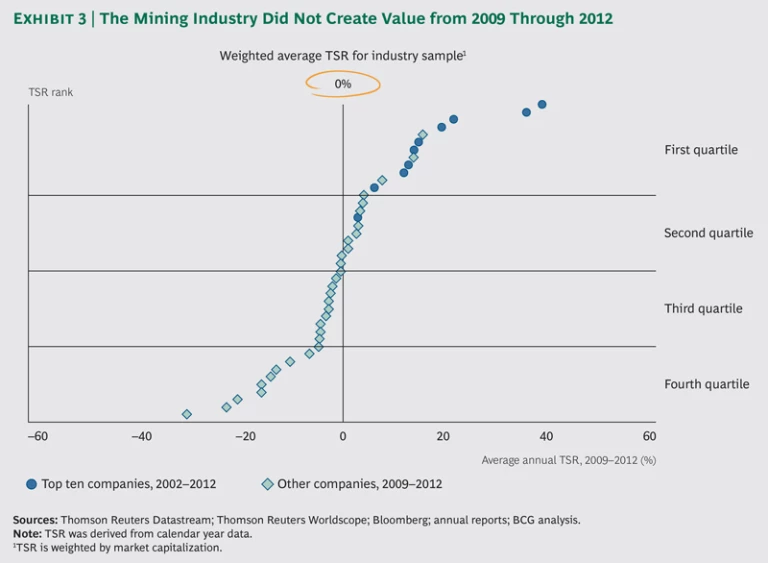
On the whole, the period from 2002 through 2012 was one of stellar value creation. Toward the end of the decade, however, mining companies suffered a reversal of fortune. From 2009 through 2012, TSR was flat; the sector created no value in this period. (See Exhibit 3.) Not even the top ten were immune to the shocks. The average annual TSR of these companies fell by more than half, from a high of 35 percent to 15 percent, although they performed better than average.
The deterioration was particularly noticeable after 2009. From 2010 through 2012, the top ten delivered a TSR of –1 percent—higher than the sample average of –11 percent, but a far cry from prior years. Investor expectations declined sharply.
The deterioration accelerated in 2013, with the average TSR declining to –20 percent. (See Exhibit 4.) Companies mining gold were especially hard hit; they lost half their value during the year, producing an average TSR of –51 percent. In addition to high operating costs, these metal producers experienced ongoing difficulties with their major projects. Despite concerns over growing supply and weaker demand, however, the copper mining companies in our sample were among the best performers in 2013, relatively speaking: their TSR declined by only 10 percent on average. Coal companies, meanwhile, performed comparably to the overall sample, even amid lower coal prices.
Commodity prices, once an important contributor to TSR performance, acted as a significant headwind, with sharp reductions in the prices of coal and various ores, including iron ore. The price of gold, resilient for most of the decade, weakened in 2013, as did that of silver. Although the markets appear to have stabilized somewhat, it is clear that companies can no longer rely on rising commodity prices to create value.
Rising Costs, Declining Productivity
Declining commodity prices weren’t wholly to blame for the heightened pressure on companies’ margins and cash flow by the end of 2013. Operating and capital costs spiked considerably over the decade. From 2002 through 2012, unit operating costs rose at a compound annual growth rate of about 11 percent; in some years growth was even greater. Though operating-cost increases abated to 9 percent by 2012, commodity prices that year also began to fall. (See Exhibit 5.)
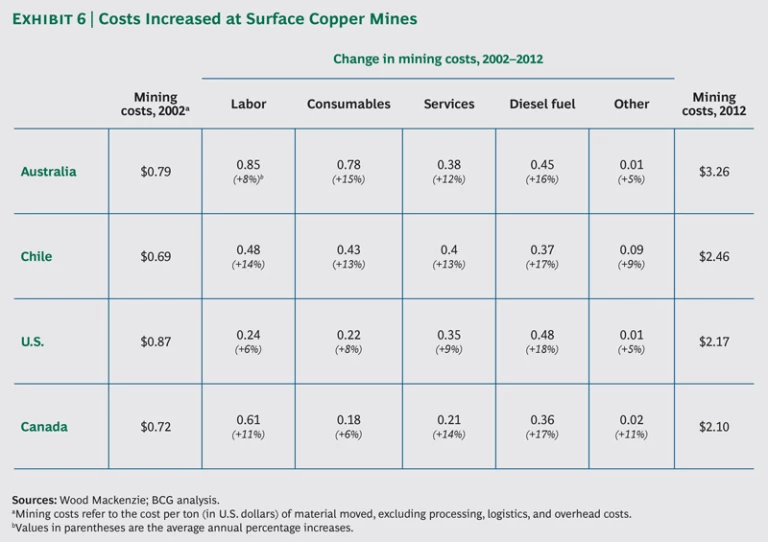
Consider the unit operating costs (expressed in U.S. dollars per ton of material moved) of surface copper mines in Australia, Canada, Chile, and the U.S. These costs rose by 10 to 15 percent each year during the past decade. (Underground mines in Australia, Canada, and Chile experienced a similar increase.) In other words, surface copper mines’ unit operating costs were 2.5 to 4.1 times higher in 2012 than they were in 2002. The costs at copper mines in Australia increased the most, followed by the costs at copper mines in Chile. In Australia, the increases were driven by labor costs and consumables. (See Exhibit 6.)
Although cost inflation—increases in the unit cost of labor, consumables, services, diesel fuel, and other items—contributed significantly to margin and cash flow pressures, our analysis suggests that declining productivity also played a role. Factors such as deteriorating ore grades have certainly impaired productivity. However, there are a number of other factors within management’s control that can be improved. We explore these in the next chapter.
M&A Misfires
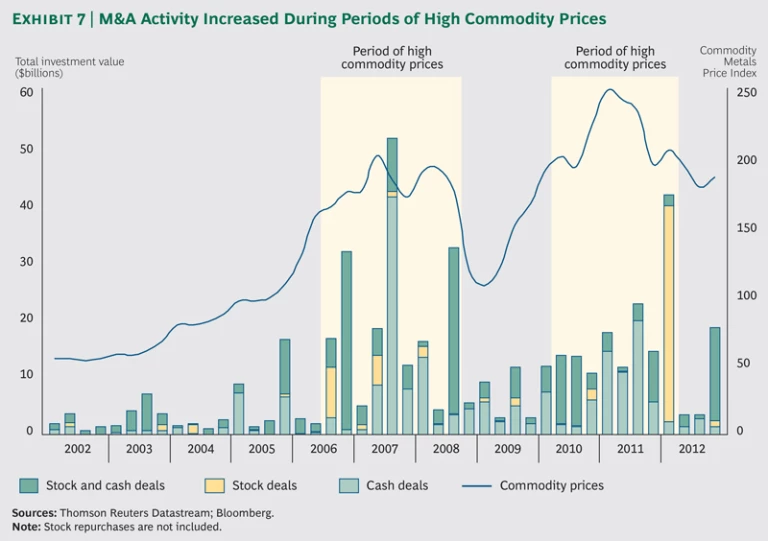
Ill-timed acquisitions added to some mining companies’ performance difficulties throughout the decade. Several companies bought assets at the top of the commodity cycle when prices were at their highest, and many did so through cash deals. (See Exhibit 7.) A large proportion of the $60 billion in write-downs from 2012 through 2013 were related to acquired assets.
Many companies are now seeking to divest assets at an apparently low point in the commodity cycle. Their motivations include wanting to reduce debt, preserve credit ratings, abide by dividend commitments, and streamline portfolios. Yet despite the entry of new types of acquirers such as private-equity firms, some of which are run by former mining executives, deal volumes remain relatively low. One reason is the disparate expectations of buyers and sellers. Sellers that are not desperate for cash are holding on to these assets rather than selling them at fire-sale prices.
Risk and Return: The Challenges of Scale
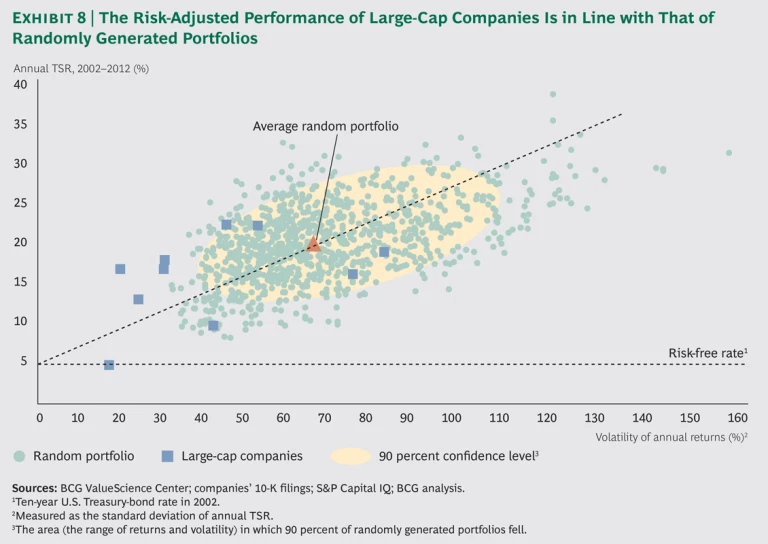
One would expect that scale and diversification might correlate with higher TSR. Yet this was not the case from 2002 through 2012. On average, large mining companies fared no better than the industry as a whole. Although their stock prices were relatively resilient in 2013, outperforming the overall sample, the large-cap companies, on average, produced long-term risk-adjusted returns on a par with the rest of the industry sample.
This discovery emerged through a
On average, the large-cap companies generated a level of risk and return comparable to what we would expect in a random portfolio. In other words, there was no evidence that the large-cap companies outperformed or underperformed a random portfolio.
Individually, four of the large-cap companies delivered TSR 3 to 6 percentage points below that of a randomly generated portfolio of sample companies at a similar level of risk. The other six earned above-average TSR at a similar level of risk. (See Exhibit 8.)
Of course, the results reflect the direct effects of scale and diversification along with other factors, such as commodity exposure, execution capabilities, and the impact of M&A. But this is also true of the random portfolios. Regardless, the results suggest that size and diversification do not necessarily guarantee competitive advantage. Large-cap companies that have breadth and depth should look for opportunities to use their exposure to different minerals, multiple locations, and an extensive value chain. For these companies, it is worth reassessing what the true sources of competitive advantage can and should be.
Four Critical Lessons
No industry is immune to business cycles, and mining has by its very nature traditionally been a boom-and-bust sector. By counting on rising commodity prices to carry them over the past ten years, many companies were susceptible to poor TSR performance when prices began to weaken.
Looking ahead, the prospects for the mining industry are less predictable than in prior years. More than ever before, performance should not remain so dependent on the vagaries of commodity prices.
From the experience of the high and low performers of the past decade, we can draw four critical lessons for miners:
- Use the right performance measures. Output, revenues, market capitalization, and other size-based measures all miss the point. Without a focus on value creation—captured by metrics such as TSR, net present value, and return on capital employed—it is impossible to know whether value is being created or destroyed.
- Identify and pursue profitable growth opportunities. Companies must take a disciplined approach to portfolio management, have a deep understanding of the value creation potential of each growth opportunity, and avoid focusing only on production growth.
- Give back to shareholders. When the opportunities for profitable growth are scarce, dividend distribution may be a wiser alternative.
- Enhance productivity. A steadfast focus on productivity is critical for achieving healthy returns and enabling long-term success. This is what we call the productivity imperative.
The Productivity Imperative
“There is significant opportunity to reduce costs and improve productivity. . . . We need the engine delivering to its full potential.”
—CEO of a major mining company, July 2013
Successful mining executives have already shifted their strategic focus from expanding capacity to improving productivity. They understand that productivity is linked to value in more than one way.
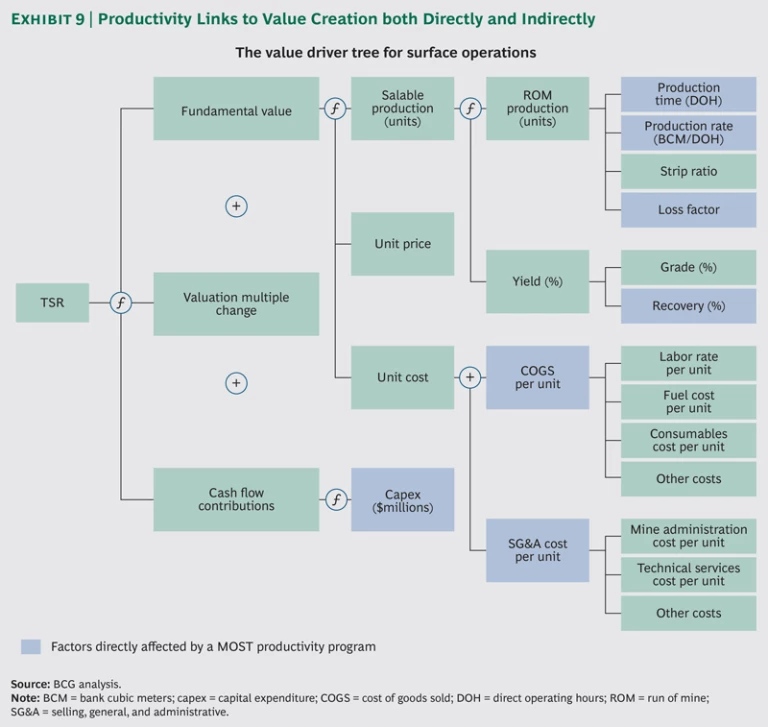
It’s a given that productivity creates fundamental value. Reducing unit costs (through efficiencies) and increasing production volumes (by removing bottlenecks and undertaking similar initiatives) contribute to the growth of earnings before interest, taxes, depreciation, and amortization (EBITDA). But there are other, less direct ways that productivity links to value. Specifically, disciplined capital allocation—strictly managing cash and working capital, reducing the sustaining capital required for fleet renewals, and carefully targeting capital investments. (See Exhibit 9.)
Yet, securing tangible and lasting productivity enhancements turns out to be more complicated than it first appears. The basic ideas behind productivity might seem straightforward, but many companies have found them challenging to implement. Virtually every mining company has some type of productivity improvement program in place, but such programs achieve mixed results. Often, improvements quickly fizzle because executives lack a long-term productivity vision, they are unable to instill the necessary new behaviors in line management and operators, or they can’t overcome the organizational silos and ingrained culture that so often impede learning and change.
By contrast, the productivity efforts of successful companies optimize not only their internal operations—within and across functions, processes, and systems—but also their external interactions with suppliers and customers. These companies understand the organizational and cultural changes that must be implemented and how to make the changes sustainable.
To help mining companies realize major advances in productivity improvement, BCG developed a holistic approach that is maturity based, optimized, sustainable, and transformational. It is thus known as MOST.
The Logic Behind MOST
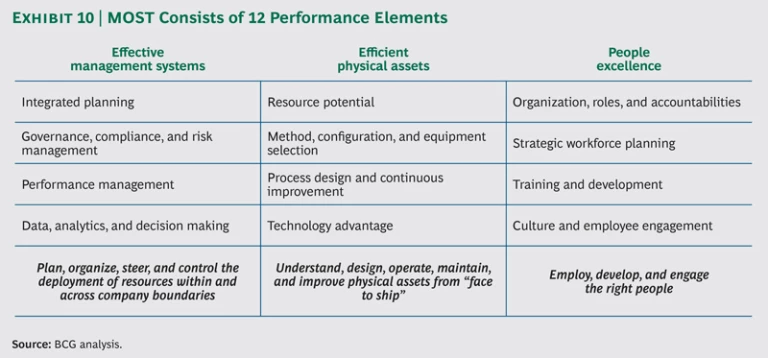
MOST is a diagnostic and improvement framework that is built on our experience with more than 150 projects worldwide over the past five years. Companies determine the maturity level of the organization, and managers then optimize a productivity program by assessing the operation on three performance dimensions: the effectiveness of the management systems, the efficiency of the physical assets, and the level of excellence of the people. (See Exhibit 10.) MOST applies proven principles of change management—such as learning by doing, teaching the right skills and how to use the right tools, and emphasizing culture and behavior—so the modifications companies make are sustainable. And because MOST is anchored in a strategic rather than tactical view of the asset, the framework enables companies to transform their operations. In other words, company leaders determine the role that a given operation plays in their overall portfolio and use MOST to ensure that the operation’s productivity initiatives align with that role.
Through MOST, companies typically realize improvements of 10 to 20 percent in key operational metrics such as throughput, unit cost, and productivity. In some cases, the results are significantly higher. For example, two coal mines used MOST and saw a 45 percent increase in development rates and nearly a 60 percent increase in longwall cutting hours.
Each of the three performance dimensions that compose MOST are made up of four performance elements—a dozen in all.
Achieving efficiency in physical processes is the usual emphasis of traditional productivity programs; those that focus on removing production bottlenecks or implementing lean production are classic examples. But to have efficient physical assets also requires gaining a better understanding of the resource’s potential; reevaluating the mining method, configuration, and equipment selection; and gaining a technology advantage through targeted investments that increase throughput and decrease costs.
MOST recognizes that real and sustainable gains are equally a function of people excellence: all the elements that combine to create a motivated, accountable, and appropriately skilled workforce. (For more on the relationship between behavior and culture and business performance, see High-Performance Culture: Getting It, Keeping It, BCG Focus, June 2013.)
These two dimensions—efficient physical assets and people excellence—are fostered by effective management systems. Such systems boast integrated planning; good governance, compliance, and risk management; performance management; and accurate data and analytics and timely decision making.
Why Maturity Matters
Improvement programs need to be tailored not only to an operation’s strategy but also to its developmental stage, level of sophistication, and degree of stability. Therefore, customizing a program is done by assessing each of the 12 performance elements of a mining operation according to its maturity level. There are four levels:
- Foundational. This indicates a disjointed and unstable operation that has only basic technologies and capabilities. Typically, a mine at this level would first need to look at stabilizing its operation.
- Proficient. This designates an operation that is partly stable and optimized within silos or to steps in the value chain, such as within the digger or truck fleet or the processing plant. Optimization is not system-wide; the operation performs selectively at feasible output levels. A proficient operation might focus on process design and optimization across production steps.
- Best Practice. This indicates a stable operation that is optimized across the value chain according to lean principles. An operation at this level might focus on enhancing its technology platform, fundamentally reconfiguring its operations, or implementing advanced analytical techniques through the use of conventional, established approaches.
- Breakthrough. This designates a world-class operation with leading-edge technology and top people. For example, a breakthrough organization would use autonomous machines rather than human-operated equipment. An operation at this level would also redefine first-rate performance benchmarks.
MOST suggests diagnostic tools and improvement programs appropriate to an operation’s maturity level. MOST applies a triage approach to remedying performance, targeting the least mature elements—the weakest links—first. To illustrate, let’s look at a manganese mine—a textbook case of an operation at the foundational maturity level that was plagued by skyrocketing costs.
Putting MOST to Work: A Case Study
A high-grade mine that produced manganese for local and export markets had been hit hard by labor and contractor cost increases, just as commodity prices began to tumble. From 2008 through 2012, labor costs experienced annualized increases of 21 percent—ballooning to 31 percent of the operation’s cost base. Service and maintenance contractor costs rose by 19 percent year over year. Together, labor and contractor costs made up 50 percent of the company’s cost base.
Reining in these spiraling costs was a formidable challenge for an operation that had little experience with continuous improvement. The common performance-management practices it used—such as transfer pricing—encouraged siloed behavior, which compounded the challenge. Furthermore, management believed it was already doing everything possible to operate efficiently. Without hard data to prove otherwise, management’s instinct was that the problem lay elsewhere.
Frustrated by a lack of easy answers, however, management agreed to take a fresh look at the issue using the MOST framework. The first step entailed a detailed diagnosis: analyzing capacity, determining the business’s primary value drivers, and performing cost breakdowns. The team examined each element within the MOST framework to identify those areas in greatest need of attention. For example, in assessing how efficiently physical assets were utilized, we found that the average number of faces blasted per month was 19 percent below the target and varied widely from month to month and from location to location. Equipment was also underutilized. Looking at the effectiveness of management systems, the team discovered that a proliferation of small contracts was adding unnecessary cost. Only 10 percent of the contracts accounted for the lion’s share of contract expenses (84 percent), yet the company was devoting a disproportionate amount of resources to administer the remaining 90 percent.
These inputs provided concrete evidence that pointed to the nature and sources of the cost problems. This information would help the team suggest targeted solutions. In concert with this quantitative analysis, management underwent belief audits, in which managers identified the issues they perceived to be problems and enumerated opportunities for boosting production as well as for reducing costs.
No transformation can happen without management’s buy-in and learning. So the company’s MOST program included two key components. The first comprised workshops for brainstorming and testing ideas. The second was an effort to engage senior and middle managers in order to facilitate buy-in, accelerate implementation, and help ingrain the new ways into the company culture. Through lean principles, the management team realized that there were indeed many opportunities available for boosting asset efficiency, as well as for beefing up management systems such as planning.
The mine’s productivity program consisted of six types of initiatives:
- Increasing output, initially through approaches such as takt mining, campaign mining, and the development of specific faces; and ultimately, through
strategic development2 2 Takt is the maximum time allowed to complete an operation within a recurring process. - Boosting operational efficiency by improving planning, reducing reactive maintenance, and cross-training employees to handle different jobs; and eventually, by adopting a pull system to draw inventory from working faces
- Optimizing sourcing and contract management by eliminating the duplication of work, maintaining the scope of a project, and revamping contractor incentives; and ultimately, by moving core production in-house
- Boosting organizational efficiency, specifically by streamlining processes and handoffs, establishing clear KPIs, and revising the organizational structure
- Reducing energy and consumables costs by monitoring fuel use and changing explosive suppliers; and eventually, by creating a continuous improvement process for reducing consumption
- Enhancing outbound logistics, chiefly by adding automation to achieve more consistent performance
Initiatives were sequenced over a three-year period and assigned interim goals. Within six months, the company aimed to build a cost-minded culture, and after one-and-a-half years into the program, management hoped to reach its target cost levels.
The operational efficiency initiatives replaced ad hoc orders with more regular, reliable cycles of work. This increased the number of faces blasted daily by more than 12 percent. Improved equipment-maintenance schedules helped boost equipment utilization. And contract sourcing and management initiatives slashed contractor costs by 19 percent.
All told, these efforts will increase EBITDA by 42 percent over the program’s three-year life. Throughput initiatives will account for two-thirds of the newly created value, and cost- saving efforts will account for the remaining one-third. A staged approach to implementation has allowed the payoffs to accrue from the get-go: 33 percent of the value was realized immediately, and 83 percent was recognized halfway through the three-year program. The program paid for itself in its first three months.
Conclusion
Incremental actions can yield only incremental results. Achieving a step change in performance calls for bold actions—thinking outside the box, rather than being constrained by past or current practices. Technology advances, changes in market conditions, other operations, and even practices within other industries spawn new ideas that can have a powerful impact on improving operations.
A holistic approach to productivity takes such concerns into account. Above all, it is designed around the asset’s strategy and works best with well-defined financial and operational targets. Companies can be assured that the interventions they choose are based on the methodical, data-driven process of the MOST framework, rather than on random choices or gut instinct.
Key Questions for Mining Executives
The following set of questions is designed to help mining executives reflect on their current approach to value creation and consider ways in which they might improve their productivity efforts.
“Pressure Testing” Your Value-Creation Strategy
- Does your organization have a comprehensive value-creation plan that incorporates and balances business, financial, and investor strategies?
- Have you explicitly prioritized your capital-allocation options, and do you know how investors will react to each one?
- What are likely to be the biggest hurdles to achieving your value-creation objectives in the next one to three years? What do you expect the challenges to be in the next five to ten years?
Enhancing Your Productivity Efforts
- How mature are the operational areas of your business? Are they at the foundational, proficient, best-practice, or breakthrough level? Which areas are most in need of improvement?
- What is the “size of the prize”—that is, the value creation delivered to shareholders—if you achieve productivity improvements?
- Do you currently have a formal productivity program? If so, how comprehensively does it address management systems, physical assets, and people?
- Have clear links been established between productivity improvements and value creation for each of your operations?
- Have program results met or exceeded your expectations? If not, why not?
Acknowledgments
The authors would like to acknowledge the contributions of the following global experts in corporate development and mining: Stephen Amery, Philippe Dehillotte, Hady Farag, Kerstin Hobelsberger, Grant McCabe, Ross Middleton, Sonja Repcik, and Dale Schilling.
The authors would also like to thank the team at the BCG ValueScience Center, a research center that develops advanced valuation techniques for M&A and corporate strategy applications.
