
BCG has a solution to help you steer ahead in the shipping container industry.
Nearly 90% of world trade relies on shipping, yet the industry faces significant efficiency challenges. Companies must have access to the most accurate and detailed shipping container data—and the most advanced analysis of that data—if they are to understand how demand and supply will evolve.
BCG’s Container Demand and Supply Forecaster Tool offers both. It allows companies to assess multiple scenarios for how supply and demand might evolve and to determine the impact on, and strategic imperatives for, the business.
What Does the Tool Do?
BCG’s Container Demand and Supply Forecaster Tool crunches thousands of econometric and shipping data points to help clients use vessel space as efficiently as possible, save time and money, and identify growth opportunities. The proprietary tool taps 20 years of data on trade and macroeconomic indicators and forecasts demand across major trade lanes through 2025.
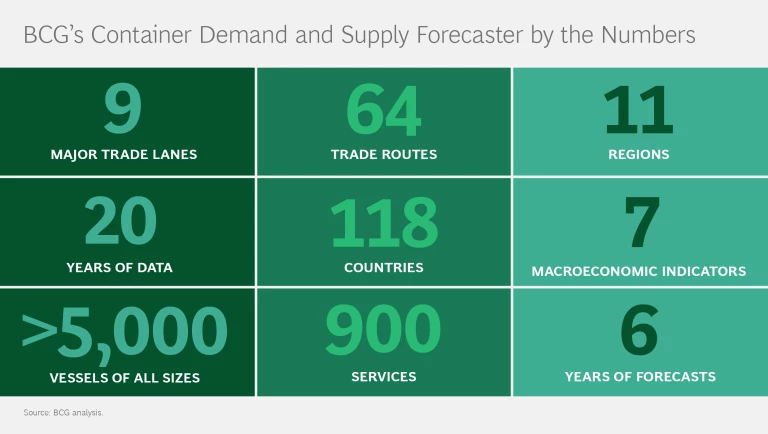
Major trade lanes include those related to Africa, transatlantic, Asia-Europe, Latin America, Oceania, intra-Americas, Indian subcontinent and the Middle East (ISC-ME), transpacific, and intra-Asia.
Macroeconomic indicators include GDP and its various components, along with other econometric measures, such as industrial production indexes and unemployment rates.
Commodities covered include machinery and electrical equipment, chemicals, energy and mining, transportation equipment and parts, textiles, and leather and apparel.
Why Does Your Shipping Business Need the Tool?
Clients that partner with BCG find that our Container Demand and Supply Forecaster Tool, analysis, and models enable them to:
- Gain a better understanding of the trends in—and outlook for—demand and supply of container vessels
- Analyze demand and supply trends to identify potential disruptors—and understand the implications of those disruptors on specific trade routes
- Use customizable macroeconomic indicators to predict how business will evolve in individual regions and trade lanes
- Determine which commodities will drive container demand in the near future
- Unlock opportunities for growth by using scenario-based modeling across optimistic, pragmatic, and conservative trade outlooks
- Gauge the impact of global disruptions, such as the COVID-19 pandemic and trade shifts between nations, on container trade—and inform the best business response to these evolving situations
How Does the Tool Work?
BCG’s shipping data tool uses a three-pronged approach:
Data Preparation
The tool considers historical trade data and econometric variables such as GDP, industrial production indexes, and unemployment rates. The data is cleaned and normalized, and a regression model is created for selected countries that are the leading contributors to global container trade demand.
Scenario Creation
The tool allows users to create various scenarios based on global uncertainties, affording the flexibility to select different econometric growth patterns.
Forecasting
Selected econometric scenarios are incorporated into the model, which generates container trade forecasts for the selected routes.
Meet Our Shipping Container Tool Experts
For more information about the tool or our transportation and logistics consulting, please contact:


BCG’s Featured Shipping and Logistics Insights

Forecasting the Future Is Key to Staying Ahead

Focus
February 2, 2018
Carriers that approach a digital transformation with the right ambition, resources, and scale can achieve a step change in their digital capabilities within 18 months.
The shipping industry needs a better methodology for handling economic downturns, especially when predicting global shipping volume and forecasting shifts in trade lanes.
BCG tapped its Container Demand and Supply Forecast Tool to assess the impact of the US-China trade war on global container trade in this article in ShippingWatch, an online journal on the maritime industry.
RELATED EXPERTISE
Industry
BCG’s bold transformation programs address shipping companies’ strategic, commercial, cost, and organizational challenges. Learn more.
Industry
BCG’s logistics and freight consulting team works with companies specializing in sea forwarding, freight forwarding, contract logistics, road & air freight, and cargo.