Scanning the Demand Horizon
We must free ourselves of the hope that the sea will ever rest. We must learn to sail in high winds.
—Aristotle Onassis
In our March 2015 report, The Transformation Imperative in Container Shipping, we drew on our analysis of events in 2014 to forecast choppy seas for an industry buffeted by powerful forces. In particular, we noted the persistent overcapacity that had been eroding shareholder returns despite reasonably high volume growth. We also proposed a way in which container carriers could make the transformations necessary to succeed in an increasingly volatile and complex environment.
Our analysis of developments that unfolded in 2015 affirms that the industry still faces daunting challenges. Until then, global volume growth of containers shipped worldwide had been decent: from 2010 through 2014, 4.5% annually. It was overcapacity that presented the primary threat to shareholder returns. In 2015, for the first time, the industry faced weak demand, surprising all observers.
For this report, our aim was to understand whether this trend will prove cyclical or become a new normal. We conducted in-depth analyses of demand-side developments during 2015, reviewing those that affect major global trade routes, or trades, and key drivers of container demand. To gauge whether the trends we’re seeing will prove temporary or permanent, we considered how demand drivers could change in the next several years. Finally, we assessed moves that carriers, or container liners, can explore to defend their competitive position and further sharpen their edge.
One thing is clear: in this seascape, container-shipping companies that can continue to drive change stand the best chance of steaming ahead of their less progressive peers.
From High Hopes to Deep Disappointment
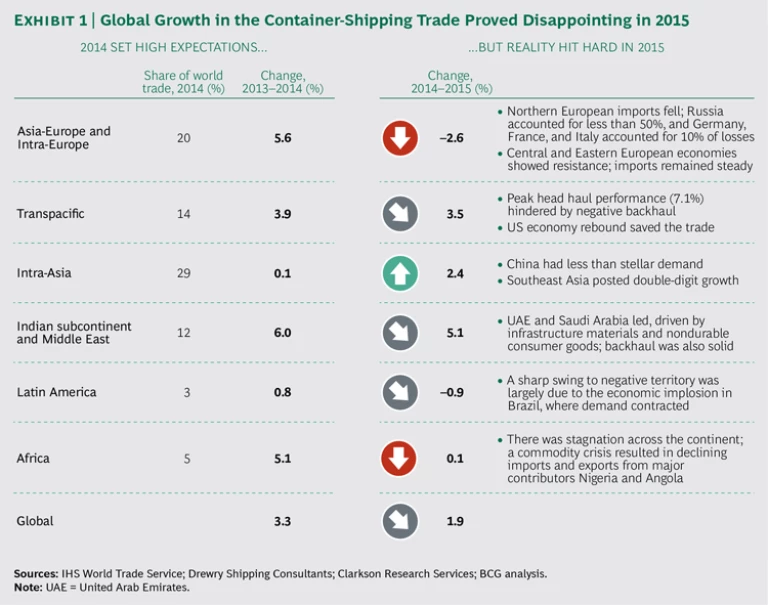
By the end of 2014, container demand showed signs of picking up, demonstrating average year-on-year global growth of 3.3% compared with 2013. Several individual trade regions—particularly
But then reality hit—and hit hard. By the end of 2015, annual global growth in the container-shipping trade was just 1.9%. (See Exhibit 1.) The disappointing outcome stemmed largely from a disastrous year for the Asia-Europe trade, combined with the failure of more promising trades to achieve brisk-enough growth to offset other trades’ losses. Asia-Europe registered a dismal decline of 2.6%. Growth for the Indian subcontinent and Middle East—while a relatively impressive 5.1%—wasn’t enough to compensate. Intra-Asia saw 2.4% growth, boosted by brisk trade throughout Southeast Asia, and Transpacific registered 3.5% growth. But again, these gains weren’t enough to compensate for the big losses. Latin America, for its part, saw a 0.9% drop, while Africa remained flat at 0.1%.
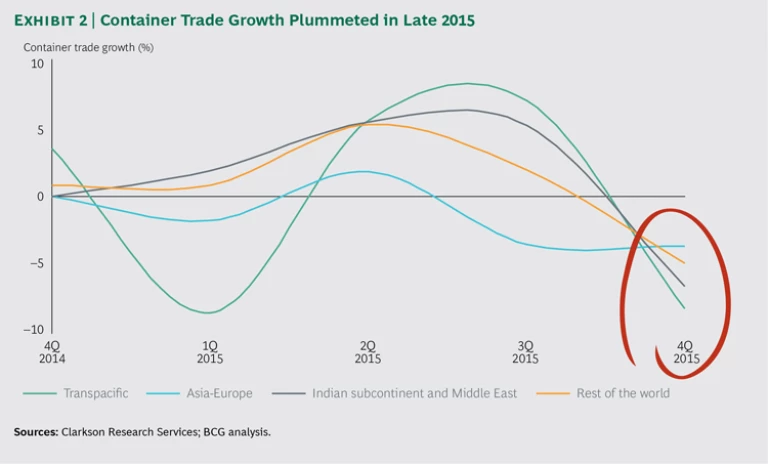
In the last quarter of 2015 alone, global container trade sank by 5.4%, with all trades suffering a drop—even those that had enjoyed increases earlier in the year. (See Exhibit 2.) Meanwhile, backhaul, driven mainly by reduced demand in industrial imports to China, dragged down most trades, registering a 0.4% drop during 2015.
As demand lost momentum, the global fleet nevertheless expanded, with liners rushing to add 62 new ships above 10,000 20-foot-equivalent units (TEUs) in a bid to boost scale and reduce slot costs. The fleet growth rate peaked from 2014 through 2015 at 8.6%, a significant jump over the 6.3% seen from 2013 through 2014. This growth only worsened the overcapacity already afflicting the market, pulling freight rates down to new lows. Indeed, the Shanghai Containerized Freight Index tumbled from 1,000 at the beginning of 2015 to below 700 by year-end.
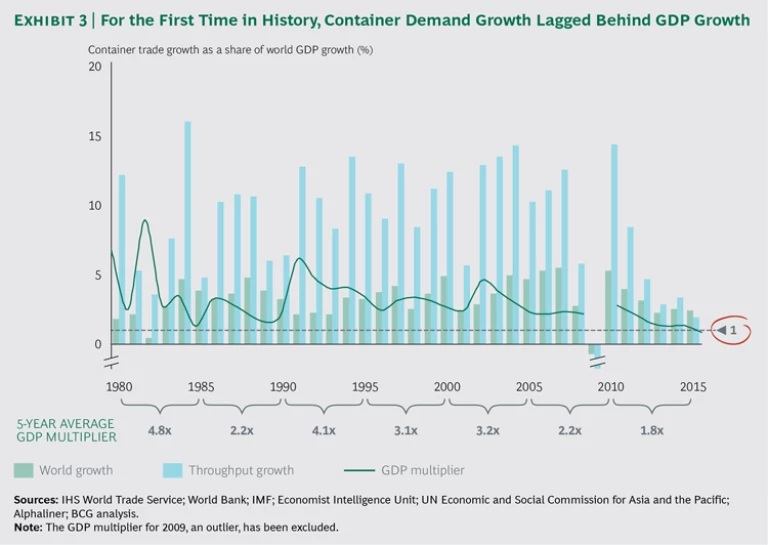
In 2015, for the first time in history, container demand growth lagged behind global gross domestic product growth, producing a GDP multiplier of less than 1. (See Exhibit 3.) This development raised questions: Was 2015 merely an anomaly, or was it a manifestation of a troubling new normal that’s here to stay? Will the GDP multiplier be the most useful KPI for tracking? Although it’s a well-known metric, it is a backward-looking multiplier, measuring only what has already happened. To make savvier decisions, shipping companies need to consider more forward-looking trends that illuminate developments in trade volumes. Later in this report, we examine 15 such trends in greater detail and consider their implications for specific trades.
A Closer Look at the Trades
What do these developments imply? For the major trades, how will container demand evolve through 2020? To explore possible answers, we analyzed the performance of key trades that collectively represent more than 80% of total container trade worldwide: Asia-Europe, Transpacific, Intra-Asia, Indian subcontinent and Middle East, Latin America, and Africa. Because trade is fundamentally demand driven, we looked at developments in the forces that affect demand, such as industrial and consumer demand, as well as other forces that affect trade, including currency and structural changes in major economies. For each trend, we assessed whether the trend is temporary or a symptom of more enduring change.
Asia-Europe: Shrinking Imports
This trade saw imports from Asia into Northern Europe shrink by 3% from 2014 through 2015. (See Exhibit 4.) The contraction was triggered by a number of forces. Russia accounted for more than 50% of the volume loss, suffering a recession that was provoked by the sharp drop in oil prices and EU and US trade embargoes. Russian GDP growth fell from 0.4% in 2014 to –3.7% in 2015, and by the end of 2016, GDP growth will likely have dropped an additional 1.2%. What’s more, the Russian ruble declined against other currencies, eroding Russia’s purchasing power and thus its ability to import goods. Consequently, imports contracted, diminishing container demand for all commodities.
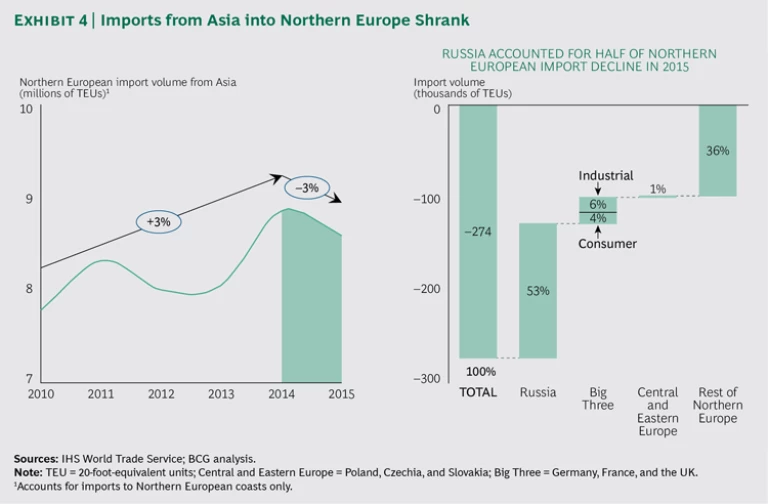
Sluggish European industrial demand in the EU’s Big Three—Germany, France, and the UK—accounted for 6% of the drop in import volume from Asia into Northern Europe.
Industrial export volumes from Europe to China also decreased. European manufacturing output is driven by overseas reexports, primarily to the US and China. With the slowdown in China’s economy and its government’s aggressive campaign for economic self-reliance, growth in European industrial-export volumes to China dropped from 15% from 2005 through 2011 to just 2% from 2011 through 2015. Over the next several years, European industrial reexports will likely show only modest growth, as the impact of China’s economic slump eclipses brisker growth of reexports to the US. In-deed, US industrial imports from Europe would have to increase at a CAGR of 11% from 2015 through 2020 to offset the China effect.
In addition to the decline in industrial demand, the Big Three saw consumer spending contract. This was prompted by the region’s difficult economic recovery and consumers’ resulting pessimism—even as governments tried to stimulate spending by decreasing interest rates. European imports from Asia of retail goods—including toys, appliances, tires, leather goods, and apparel—fell from 2014 through 2015. Shipping companies blamed European retailers for reducing inventory stocks in response to weak consumer demand. But a number of indexes, as well as data from big retailers and consumer goods companies, show that inventories and procurement activity actually grew during 2015. Thus, the import slump cannot be attributed to destocking.
On a more positive note, the Central and Eastern European economies fared better than Russia and the Big Three in terms of industrial and consumer goods imports. From 2014 through 2015, these countries’ imports remained steady. Poland, in particular, shows potential for robust growth in domestic and transshipped cargo. Local economic growth in the countries of Central and Eastern Europe is being boosted by industrial output and consumer demand, as well as by their sound infrastructure, which enhances accessibility. A number of new services have recently been launched in Poland by liners seeking to capitalize on the opportunities there.
Still, taken together, all of these trends suggest that through 2020, Northern European imports from Asia won’t likely enjoy the strong growth rates of the past. The Russian economy will probably rebound during that period, as the effects of external shocks fade. But chances are small that European industrial demand will recover to precrisis growth levels. And any rebound in European household demand will still be tied to the restoration of consumer confidence.
Of course, uncertainty associated with Brexit, Britain’s historic vote to exit the EU, could constrain imports into the UK and affect other European countries. After the referendum, the International Monetary Fund acknowledged such a possible impact by revising downward the UK’s 2017 outlook on GDP growth from 2.2% to 1.3%, the biggest reduction among advanced economies. Across Europe, Brexit will likely have ripple effects on trade if political turmoil and uncertainty over Europe’s cohesiveness, further exacerbated by security concerns, put the brakes on capital investment and consumer spending.
Transpacific: Imminent Slowdown
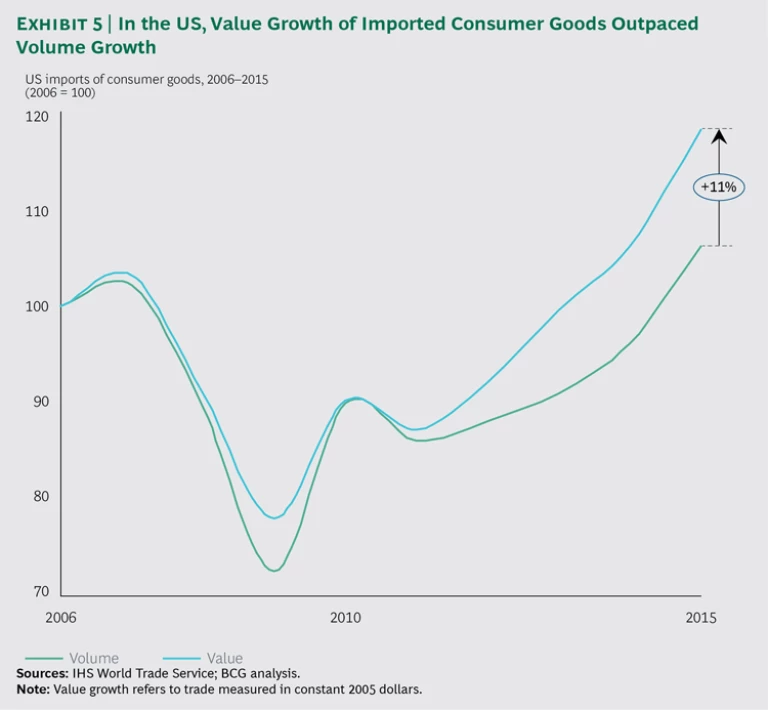
Transpacific routes account for more than 60% of total US imports, which have been experiencing decent growth. In this trade, US imports achieved 8% year-on-year growth from 2014 through 2015, thanks mostly to significant increases in imports of consumer goods. In the US, per capita personal disposable income rose 2.3% from 2013 through 2015, and consumer sentiment proved sunny too. The result was growth in aggregate consumption and a corresponding jump in imports of consumer goods from Asia.
But we question whether this momentum can endure. For one thing, the economic rebound in the US is unevenly distributed, with the lion’s share of increased disposable income going to higher-income consumers. According to the American Economic Association, as their wealth expands, affluent families spend more on education and domestic services than on consumer goods. Thus, it’s important to distinguish between value growth and volume growth of imported consumer goods. (See Exhibit 5.) Meanwhile, families in the lower income brackets are exhibiting a savings mindset, choosing to salt away any pay increases they get rather than stepping up their spending on consumer goods. And baby boomers are retiring, while millennials are opting to spend more on experiences than on goods.
In the meantime, for some years now, rising manufacturing labor costs in China and other erstwhile low-cost countries have prompted many US companies to think about reshoring their manufacturing work. If this trend continues, we expect that Transpacific imports into the US will slow down in the coming years. However, collapsing energy prices and volatile foreign-exchange rates could delay this effect. In a BCG survey conducted in 2015, participating executives said that they believe that the US will account for a slightly lower portion of their companies’ global production capacity than they had indicated in 2014. (See The Shifting Economics of Global Manufacturing, BCG report, August 2014, and “ Reshoring of Manufacturing to the US Gains Momentum,” BCG article, December 2015.) Indeed, findings from BCG’s manufacturing survey show that appetite for reshoring has stagnated over the past two years.
Intra-Asia: The China Effect
Since 2010, this trade has enjoyed faster growth than several other key routes. Overall, the growth has been driven primarily by developments in China. With the maturation of the Chinese economy, several forces have exerted a complex but overall dampening effect on growth on Intra-Asia trade. As a result, trade volume has lost some momentum since 2012, downshifting from 11% annual growth from 2010 through 2012 to just 2% from 2012 through 2015.
No longer on a sky-high growth trajectory and experiencing a natural deceleration, China has also slowed its import and export of industrial goods. The structural transitions taking place in the economy—including greater reliance on domestic industry and a shift to consumption- and service-led growth and higher-value-adding goods—have further moderated trade growth. One development, the concentration of the entire supply chain within China, has had a key role in reducing Intra-Asia trade volumes. For instance, in the past, Chinese automotive companies had engine-manufacturing plants in Thailand and shipped the engines from there to China for automotive assembly in China’s domestic market. Now, the engine factories are located in China itself.
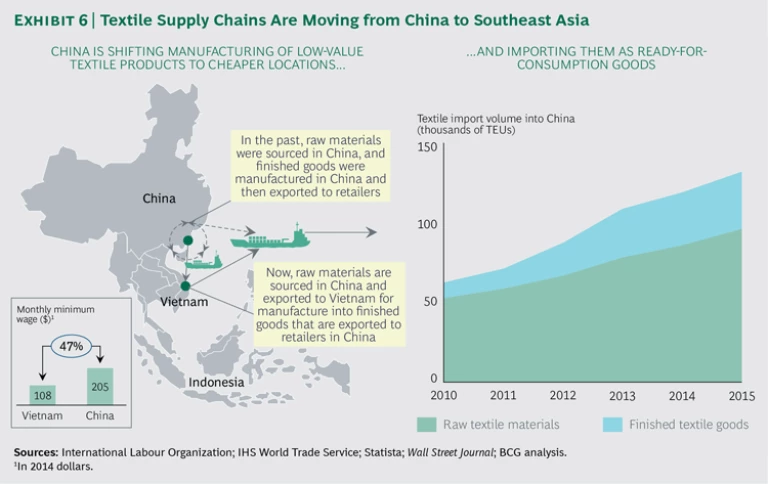
Furthermore, as the country’s minimum wage rises, China is offshoring low-value-adding industries (such as apparel manufacturing) to countries such as Vietnam. (See Exhibit 6.) This structural shift has provided a boost to trade in consumer goods. Additionally, Chinese consumers’ confidence levels remain healthy, even as their trading-up intentions have stalled. As of mid-2016, consumption patterns in China were holding up despite slowdowns and volatility in other areas. If these trends continue, we expect to see increased back-and-forth trade in finished consumer goods (such as food, footwear, and textiles) between China and Southeast Asia.
Meanwhile, Vietnam is becoming the fastest-growing exporter of finished goods in Southeast Asia, thanks to energetic investment in its infrastructure. This has driven up imports of industrial goods. What’s more, Asian countries dominate as sources of the inbound foreign direct investment supporting Vietnam’s industrialization, further fueling the growth of Intra-Asia trade.
As for Indonesia, because of currency depreciation and tariffs that hamstrung imports in 2015, the nation’s otherwise solid trade has proved disappointing. Nevertheless, we expect its large emerging middle class to recharge import trade in the future, providing a long-term boost to Intra-Asia. (See Consumer Durables: Capitalizing on a Growing Population of Shoppers, BCG Focus, December 2015.)
Looking at the Intra-China trade, which represents a significant portion of total Intra-Asia trade, we estimate that volume may have reached roughly 17 million TEUs in 2015. Strict cabotage rules make it difficult for international players to penetrate the Intra-China market, and the lack of robust and complete port data make it a “black box” for outsiders to analyze.
As for this trade’s outlook, improvements in availability and the quality of labor and transportation infrastructure in inland China have prompted many Chinese businesses to shift manufacturing for local consumption and export from coastal areas to the interior. There, shipping by truck currently dominates. Moreover, improved rail shipping will likely take a large share of inland transport, possibly reducing the available business for container liners across China’s coastal and river ports.
Indian Subcontinent and Middle East: A Rosy Outlook
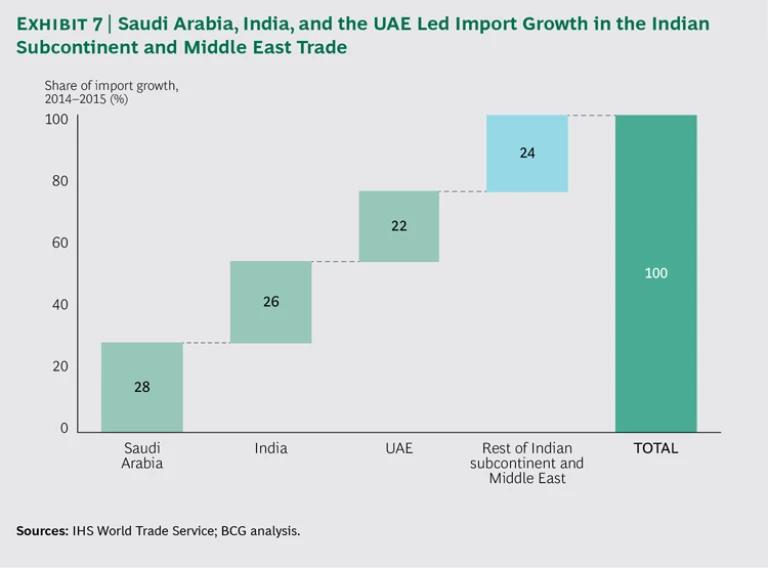
This trade saw 6% head haul and intra-region growth from 2014 through 2015. Saudi Arabia, India, and the United Arab Emirates led growth in this trade, accounting for as much as 76% of the total year-on-year increase in importing. (See Exhibit 7.) The future of the trade looks positive overall.
Saudi Arabia’s continued dependency on oil, as well as an expected slowdown in GDP growth, will likely lead to a contraction in importing. Port traffic data already indicates that growth in imports slowed since container port throughput in Jeddah fell in 2015. The UAE’s Dubai saw a 2.6% increase in container port throughput over the same time frame. And Iran made its debut by registering a 10.6% jump, likely from the elimination of sanctions.
Developments in Iran and the UAE could help offset the impact on trade growth in Saudi Arabia. Indeed, Iran will play a pivotal role in the future: the nuclear deal with the US and other nations and the lifting of sanctions will boost the country’s trade volumes, enhancing imports and trade growth in this trade overall.
Meanwhile, imports into the UAE grew during 2015 and made a strong start in 2016 despite low oil prices. Even though falling prices affected the UAE’s GDP, the government has strived to diversify the economy by investing in sectors such as hospitality, manufacturing, real estate, construction, and financial services. The effort seems to have paid dividends for trade, especially industrial imports.
India, for its part, saw imports increase by 7%, owing to strong demand for industrial goods that was driven by growth in capital expenditure, for example, for the construction of new factories. Industrial importing added more than 100,000 TEUs to container demand in 2015. That’s more than twice the amount added by consumer imports and significantly more than the amount added by industrial and consumer exporting. Indeed, we believe that India has considerable latent potential and is limited only by how well its infrastructure can support its trade needs.
India’s containerization rate is still low compared with the global average (in 2015, 25% versus the 60% to 70% global average), and its port infrastructure is commonly viewed as suboptimal. But if the country can overcome these issues, it could see its port capacity climb by as much as 50%. Such an increase would lift trade traffic growth through 2020.
Latin America and Africa: Great Expectations Not Yet Realized
These two trades experienced a slowdown in 2015: both saw trade volume growth flatten. Together, the two regions accounted for as much as 10% of global trade in 2015, but they contributed only 2% of the addition to global volume growth that year.
In Latin America, Brazil’s recession led to a 4% contraction in GDP in 2015. Impacts included currency deflation and plummeting business and consumer confidence, which dragged down trade growth in the region overall. Latin America will likely continue to feel the effects of economic events in Brazil. But we also expect to see a countereffect from the steady increases in import and export CAGRs that Colombia, Peru, and Chile enjoyed from 2010 through 2015. Colombia’s gains were the most impressive: import and export CAGRs of 8% and 5%, respectively.
In Africa, trade growth stumbled after a currency depreciation—catalyzed by plunging oil and commodity prices—struck the key markets of Nigeria and Angola, the region’s two largest oil producers. The result was a sharp decrease in imports in these key markets, leading to stagnation in trade growth throughout Africa. In addition, as China slowed exports, it imported fewer raw materials from African countries, further affecting volumes in this trade.
Still, we believe that trade growth in the region will revive, thanks to rising urbanization and income levels as well as reforms that, together, will open up markets. GDP growth throughout Africa proved relatively impressive from 2000 through 2015, and overall trade hasn’t experienced a contraction during that time frame. Thus, we expect to see trade grow through 2020.
Anticipating the Global Container-Shipping Picture
In addition to analyzing demand volumes in 2015 for key trades, we assessed the main drivers of demand, considering how they might affect global container shipping through 2020. In doing so, we sought to answer the question, Was the 2015 dip cyclical or an indication of a new normal for global trade?
We developed bearish and bullish scenarios that represent the lower and upper limits of what could happen, as well as a base scenario that represents a more moderate picture. Using such scenarios, a carrier can plan its investments for the fleet. It can also prepare the company to navigate effectively in the soft market we expect for the next several years.
Below, we take a closer look at the next few years and the future of several key elements of the industry. We focus especially on container demand CAGRs and the container supply-and-demand balance. Container demand growth indicates the market’s health. Supply is also critical, given that the industry has been overinvesting and deploying additional capacity (supply) that is out of proportion to demand growth. When supply grows faster than demand, freight rates decrease, threatening revenues.
Container Demand CAGRs, 2015–2020
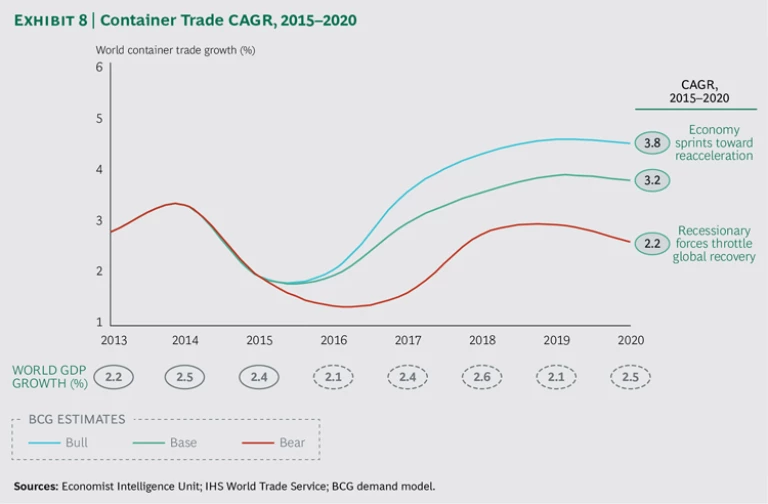
In light of the trends analyzed in the preceding chapters, we expect annual growth in global container traffic to be between a bear scenario of 2.2% and a bull scenario of 3.8%, with the base scenario of 3.2%. (See Exhibit 8.) Corresponding container trade could reach 170 million TEUs to 183 million TEUs in 2020.
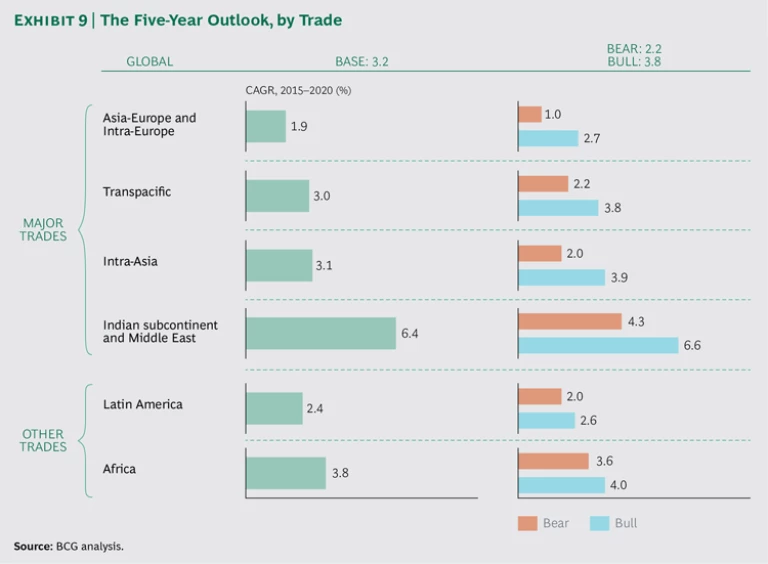
Base Scenario. The base case envisions a CAGR of 3.2% from 2015 through 2020 for global container demand, driven mainly by the Intra-Asia, Transpacific, and Indian subcontinent and Middle East trades. (See Exhibit 9.) As we’ve seen, many developments in these trades are driven by structural changes, which create more enduring shifts than do cyclical forces. The base scenario implies the following:
- Asia-Europe grows at a CAGR of 1.9% because the economic recovery in the EU is tempered by post-Brexit uncertainty and the Russian economy has yet to rebound. However, growth pockets in Central and Eastern Europe are being tapped.
- Transpacific grows at a CAGR of 3%, thanks to an uptick in the US economy. Still, brisker consumer spending doesn’t translate into proportional gains in trade volume, owing to uneven income distribution.
- Intra-Asia records a CAGR of 3.1%, as China’s rebalancing leads to more self-sufficiency that is countered by more Chinese offshoring to rapidly developing economies, and Vietnam and Indonesia deliver a boost.
- Indian subcontinent and Middle East logs a CAGR of 6.4%, as UAE imports show resilience in the face of low oil prices, India tops the Gulf region as a trade growth engine, and Iran makes its debut there.
- Latin America and Africa see CAGRs of 2.4% and 3.8%, respectively. In Brazil, importing fails to recover, though trade gains momentum in the continent’s western countries, particularly Colombia, Peru, and Chile. In Africa, trade growth rebounds, thanks to solid demand fundamentals, and Nigeria leads imports while South Africa leads exports.
Bear Scenario. The bear scenario forecasts a CAGR of 2.2% from 2015 through 2020 for global container demand. It implies the following:
- Asia-Europe grows sluggishly with a CAGR of 1% until 2020 as Brexit fuels further concerns about EU cohesion, and the lack of structural adjustment results in stagnating industrial output and weak consumer sentiment. Businesses hold back on investments.
- Transpacific grows at a CAGR of 2.2% owing to uneven distribution of wealth and rising interest rates in the US that reduce both consumer spending and imports. China’s economic slowdown means lower exports of industrial goods from North America.
- Intra-Asia registers a CAGR of 2%. China’s mounting corporate debt and its slowing economy reduce container demand related to China. The structural rebalancing at the core of China’s growth strategy exerts a negative impact on trade volumes—both importing and exporting. Simultaneously, slow or restricted foreign direct investment from China to rapidly developing economies in Southeast Asia drags down growth.
- Indian subcontinent and Middle East shows a CAGR of 4.3%. The prolonged fall in oil prices causes Gulf countries to restrict infrastructure funding, tightens budgets, and induces a drop in imports. At the same time, India fails to deliver on its infrastructure investment promise.
- Latin America and Africa see CAGR growth of 2% and 3.6%, respectively. In Latin America, socioeconomic woes and cheap oil hold back Brazil’s economy, and in Africa, the commodity price crisis and weak currencies stifle trade.
Bull Scenario. The bull scenario’s forecast CAGR of 3.8% from 2015 through 2020 is driven by a confluence of positive developments in the key trades. The bull scenario implies the following:
- Asia-Europe comes back with a CAGR of 2.7%. EU cohesion refuels consumer confidence, while Russian sanctions ease up and the ruble appreciates.
- Transpacific achieves a CAGR of 3.8% as the US economy keeps growing at a healthy, stable pace that is driven by a positive job market and pressure to keep interest rates low, fueling consumer demand. China’s capital investment appetite supports imports of industrial goods from North America.
- Intra-Asia sees a CAGR of 3.9%, thanks to China’s offshoring to Southeast Asia and a consumption-led Chinese economy that boosts back-and-forth trade.
- Indian subcontinent and Middle East springs forward with a CAGR of 6.6%, thanks to diversified investments in the Middle East that protect economies in this region from the impact of the oil price slump. Moreover, improvement of port and inland logistics infrastructure ramps up in India.
- Latin America and Africa achieve CAGR growth of 2.6% and 4%, respectively. In Brazil, a rebound in oil prices provides relief, boosting imports. In Africa, commodity price upticks inspire capital investments.
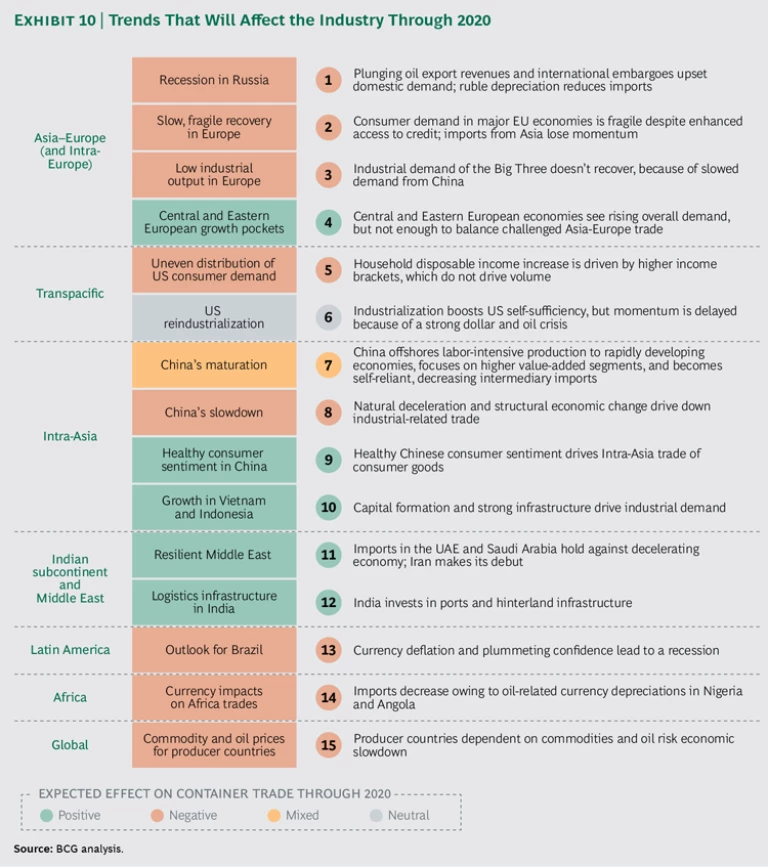
The base scenario anticipates a GDP multiplier closer to 1.5 in 2020. But since the multiplier is a backward-looking indicator, we propose 15 more forward-looking trends. (See Exhibit 10.) Instead of examining one indicator, carriers would benefit by closely following a set of trends. The reason is that forces shaping the industry—including the introduction of counterbalancing effects in which various forces push trade volume movements in different directions—have grown more complex. To anticipate market developments, carriers must analyze a wider range of trends than in the past, especially those trends that can shed the most light on what might happen in the future.
Container Supply-and-Demand Balance
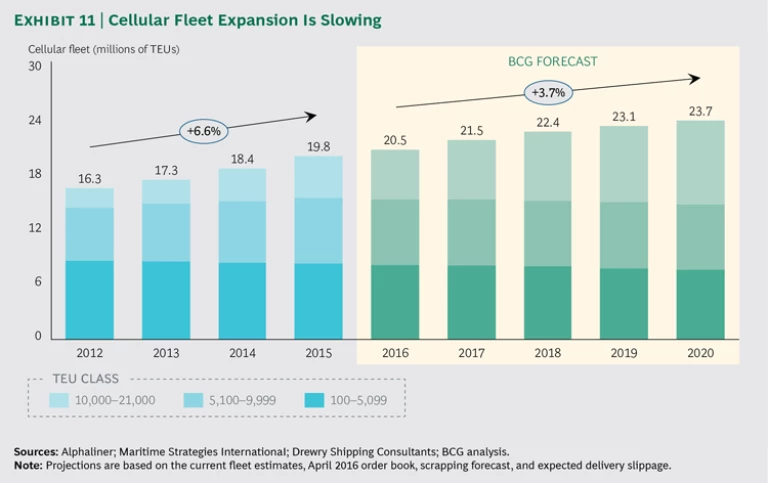
In 2015, the gap between container supply and demand stood at 7%. BCG projects a CAGR of 3.7% for cellular fleet tonnage (including order book, scrapping, slippage, and cancellations) from 2016 through 2020, down from the 6.6% seen from 2012 through 2015. (See Exhibit 11). Using BCG’s proprietary supply-and-demand model, we forecast a supply-demand gap in 2020 ranging from 8.2% to 13.8%. (See Exhibit 12.)
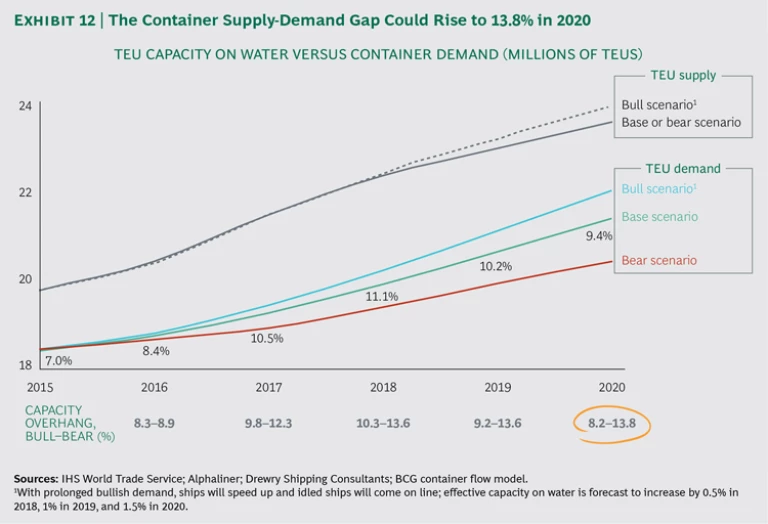
Base Scenario. The base scenario assumes a supply-demand gap of 9.4% in 2020. This scenario hypothesizes a restrained improvement in container demand, with net capacity increasing at a steady and controlled pace. New orders would be driven by falling shipbuilding prices and favorable financing conditions. We expect slow-steaming practices to persist, while scrapping and idling capacity would follow recent historical averages.
Bear Scenario. The bear scenario’s 13.8% gap would be driven by weak container demand, and industry players’ continued moderate capacity additions. Such additions are made with an eye to upgrading the fleet by taking advantage of lower capital costs and capturing operational efficiencies of new assets to drive down unit costs even more. We assume that liners will maintain their current slow-steaming practices.
Bull Scenario. The bull scenario’s 8.2% gap rests on the assumption that container demand will rebound and carriers will speed up marginally by 1 to 2 knots. The aim of increased speed will be to take advantage of a prolonged period of low fuel prices and efficient assets, and it will be possible to release some of the capacity absorbed as a result of the current level of slow steaming.
The Supply-Demand Gap. By the end of 2020, oversupply in vessel capacity will stand at 2 million to 3.3 million TEUs—equivalent to some 90 to 150 or more Triple E class ultra-large container vessels. The year 2016 seems ready to set a new record for a reduction in capacity: seven months of scrapping (January through July) affected roughly 300,000 TEUs, and the age of vessels at their scrapping—20 years—dropped to a two-decade low. However, it’s uncertain how much more reduction is to come. Industry players are in a race for lower slot costs to ensure competitive advantage. The bigger, newer, and more efficient the vessel, the lower the slot cost, which is why companies want to invest in larger vessels.
More broadly, liners are part of an ecosystem: no single company can by itself exert full influence on that ecosystem, which includes shipyards, ship-financing banks, and the local and state governments that have interests at stake. For example, shipyards represent high political stakes in Japan, South Korea, and China, where they employ thousands of workers. And ship financing is linked tightly to state-related financial institutions. Liners can get favorable financing for vessels, because the need to keep a shipyard active can extend beyond any economic rationale and is a political imperative. Only if the ecosystem addresses the situation collectively can there be a possibility of containing fleet expansion.
The supply-and-demand fundamentals of this industry appear to indicate the emergence of a new normal. Before 2015, the industry’s major challenge was overcapacity. During 2015, demand proved weak, and trend analysis suggests that this lower demand will characterize the industry. In today’s challenging environment, carriers have to do even more to survive, never mind thrive. We believe they will need to craft increasingly sophisticated battle plans that enable them to further improve their own performance, so they can successfully “sail in strong winds.”
Crafting a Battle Plan
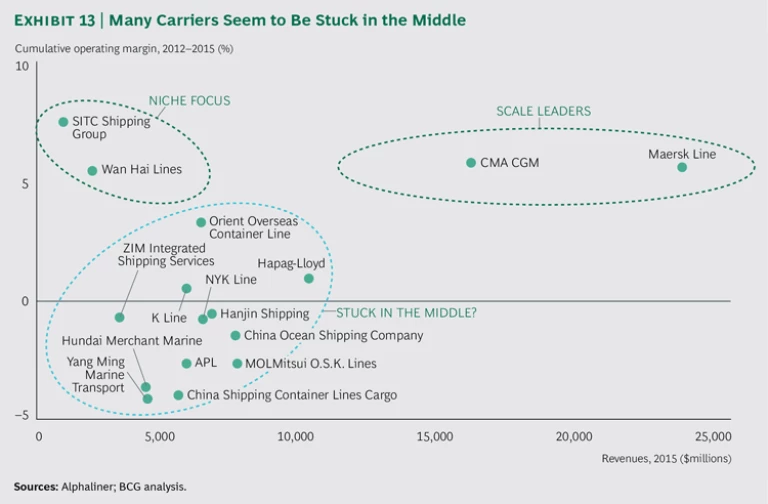
Our examination of the performance of shipping companies globally revealed only two viable paths: becoming a scale leader or becoming a niche player focused on certain trades. Companies that haven’t adopted either of these approaches appear to be stuck in the middle. They lack sufficient scale to drive down costs and the differentiation that can offer unique commercial value or command premium rates. (See Exhibit 13.)
This is a dangerous position in an increasingly commoditized industry. The number of alliances has grown, and offerings are becoming more and more similar on numerous fronts, such as schedule reliability and the provision of direct service. And thanks to more advanced technology platforms, customers now have more options and can shop around, further contributing to commoditization in the industry. Additionally, freight forwarders are gaining market share and capturing more direct customer relationships, especially profitable midsize clients.
On the basis of our work with clients, we believe that container liners can improve their performance under these harsh conditions by making the following moves:
Driving Further M&A and Unlocking Synergies.Liners can boost their scale on their own (rather than by joining an alliance) by using a blend of global mergers and smaller M&A deals that can help drive down costs. Beyond the increase in scale that a merger brings, it can also unlock synergies, which will prove critical. Companies must harvest synergies by being savvier in their deployment of their fleet and network coverage. They also need to reassess their terminal and intermodal contracts and adjust their commercial networks in view of new market dynamics. For instance, carriers will want to increase their presence in specific locations where further growth opportunities do exist. In addition, they might consider streamlining their commercial networks where demand has decreased and will remain low. Developing an efficient platform of shared-service centers will also prove crucial for improving the productivity and service quality of an ever-larger range of services. And eventually, globalizing the flow of empty containers will help cut repositioning costs from surplus to deficit markets.
However, to capture the full potential of synergies from M&A deals, companies need to move quickly to a common IT infrastructure and shared processes. Our client work suggests that maximizing synergies through such means could decrease the cost base of a combined company by 5% to 10%.
Pushing Alliances to the Next Level.Even companies that have not engaged in M&A deals will have to unlock more synergies from their alliances. Carriers have been shy about going after the full benefits alliances offer, such as cost savings from joint procurement or joint operations. Today, with a low bunker cost, the slot-cost advantage of ultralarge vessels is weaker than it was in times of super-high bunker costs. Additionally, alliances that comprise many players are complex, especially in terms of operations, and they generate a degree of rigidity that can hinder optimization of networks and operations.
To attain further benefits from alliances, members should, for example, explore the possibilities afforded by forging joint procurement and joint operations, pooling equipment such as container boxes, and combining shared-service centers in critical regions. Our work with clients in this industry suggests that maximizing alliance synergies in these ways can lift EBIT by roughly 3%.
Still, as we pointed out in our 2015 report on container shipping, capturing these gains will require sophisticated alliance models characterized by better integration of operations and assets. Conventional alliances and vessel-sharing agreements (which focus on optimizing slot costs and extending network reach) are no longer enough. Moreover, in a traditional alliance model, the cost of the additional complexity that’s created through collaboration with many alliance partners may offset potential benefits.
- Optimizing the Core Business.Companies need to rethink their product offering and network of services. Most companies have grown their service offerings aggressively over the past ten years by, for example, adding more departures and calling at additional ports. A new chessboard of alliances and M&A characterize the industry today, so it’s time to assess the economic rationale for the services network. In particular, carriers need to challenge the setup of their network of services and optimize their fleet deployment. These moves can be tricky, given the nature of today’s alliances, which involve many players and leave limited room for maneuvering. At the same time, controlling costs remains table stakes for staying competitive. Our experience with clients indicates that such moves can deliver EBIT improvements of 5% to 7%.
- Enhancing Commercial Excellence.Even in an industry that has grown increasingly commoditized, players can create a competitive advantage by excelling on the commercial front in areas such as yield, sales force effectiveness, and channel strategy. In particular, they can take advantage of new technologies. For example, the powerful commercial platforms developed by freight forwarders indicate that market share can be grabbed, especially in the more profitable segments comprising midsize customers. Our experience with clients indicates that such moves can deliver EBIT improvements of 3% to 5%.
- Extracting Value from Adjacent Markets by Maximizing Share of Wallet.Companies should consider accelerating the development of more forwarding services, possibly in rapidly developing economies where logistics “corridors” (door-to-door logistics services) are nascent and supply chains are still fragmented. Countries and regions such as the Indian subcontinent, the Middle East, Africa, and Latin America are apt examples. Additional adjacency strategies include offering new logistics concepts (such as warehousing hubs) that use depot networks. The results of our work with clients suggest that adjacency strategies could deliver improvements of 4% to 6% in carriers’ returns on assets.
- Digitizing the Business.Companies can use digital technologies to improve the effectiveness and efficiency of their commercial platforms and booking systems. Such technologies would also help them boost the efficiency of internal processes and better manage the fleet. Examples include on-board technology that supports system monitoring and data exchange between ships and shore. In addition, smart use of technology can position the various players in the value chain (liners, terminals, intermodal players, customers) to communicate and collaborate more easily and successfully.
BCG analysis of volume growth in key global trades during 2015—along with assessments of important drivers of container demand—affirms that the global container-shipping industry is entering a new-normal period characterized by daunting challenges. These include persistent overcapacity, as well as overall sluggish growth in trade volumes stemming from a complex confluence of forces across key trades worldwide. To succeed in these challenging conditions, each player needs to keep driving change aimed at buttressing its individual performance. It will not be easy to meet these imperatives, but carriers that embrace the effort now stand the best chance of weathering the difficult times to come. See more of BCG's expertise on International Trade Consulting.


