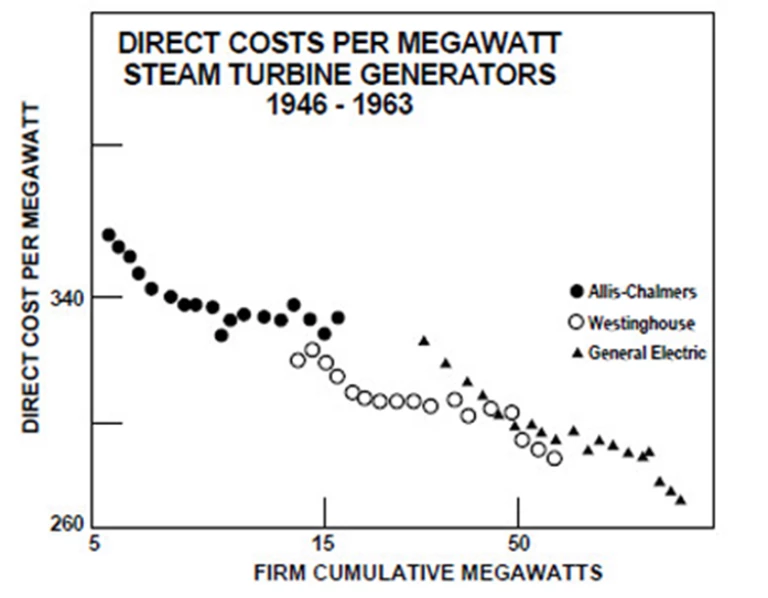
Experience curve is the name applied in 1966 to overall cost behavior by The Boston Consulting Group. The name was selected to distinguish this phenomenon from the well known and well documented learning curve effect. The two are related, but quite different.
It has been known for many years that labor hours per unit declined on repetitive tasks. This effect was particularly easy to observe in such things as aircraft production in wartime. The rate of labor decrease was characteristically 10 to 15 percent approximately per doubling of experience. This expectation has long been a part of military contracting.
The so-called learning curve effect apparently had somewhat limited application, however. It only applied to direct labor. Unless the job changed, this meant the time required to obtain a given cost decline tended to double each cycle of experience. This masked the far reaching implication of the possibilities of job element management with volume changes.
The Boston Consulting Group's first effort to formulate the experience curve concept was an attempt to explain cost behavior over time in a process industry. Long continued successful cost reduction by the client had resulted only in his survival as a marginal competitor. The correlation between competitive profitability and market share was strikingly apparent. The pattern of the learning curve was an attractive initial hypothesis to explain this. He was chasing his larger competitors down the cost curve.
Later a study of the cost of television components showed striking differences in the rate of cost improvement between monochrome parts and color parts. This was difficult to explain since the same factory, the same labor, the same processes were involved at the same time. Again the idea of progress down a cost curve provided a plausible hypothesis.
Semiconductors provided the evidence on which to build the experience curve concept itself. The wide variety of semiconductors offered a chance to compare differing growth rates and price decline rates in a similar environment. Price data supplied by the Electronic Industries Association was compared with accumulated industry volume. Two distinct patterns emerged.
In one pattern, prices, in current dollars, remained constant for long periods and then began a relatively steep and long continued decline in constant dollars. In the other pattern, prices, in constant dollars, declined steadily at a constant rate of about 25 percent each time accumulated experience doubled. That was the experience curve. That was 1966.
Work with clients since 1966 has proven the universality of the experience curve relationships. A real understanding, however, required many, many client assignments.
Application of the experience curve to problem solving and policy determination discloses many technical questions.
- What is an appropriate unit of experience where the product itself changes too? The transport airplane is an example.
- What is the relationship between experience effects on similar but different products such as semiconductors?
- How are technological changes integrated into experience effects?
- What effect does capital investment intensity have?
- Does the same effect appear in overhead and marketing functions?
Accounting data is frequently misleading for cost analysis. The choice of treatment as expense versus capital can distort apparent cost change.
Over time the experience curve has become recognized as essentially a pattern of cash flow. The average cost is by definition the total expenditure divided by the total output. The unit cost is the rate of change in that ratio. Projection of this relationship is frequently both simpler and more accurate for cost forecasting than even the most elaborate conventional accounting analysis.
Understanding of the underlying causes of the experience curve is still imperfect. The effect itself is beyond question. It is so universal that its absence is almost a warning of mismanagement or misunderstanding. Yet the basic mechanism that produces the experience curve effect is still to be adequately explained. (The same thing is true of gravitation.)
It can be observed that if high return on investment thresholds are used to limit capital investment, then costs do not decline as expected.
It can also be observed that extensive substitution of cost elements and exchange of labor for capital is characteristic of progress down a cost experience curve.
The experience curve is a contradiction of some of the most basic assumptions of classic economic theory. All economics assumes that there is a finite minimum cost which is a function of scale. This is usually stated in terms of all cost/volume curves being either L-shaped or U-shaped. It is not true except for a moment in time.
The whole concept of a free enterprise competitive equilibrium assumes that all competitors can achieve comparable costs at volumes much less than pro rata shares of market. That is not true either.
Our entire concept of competition, anti-trust, and non-monopolistic free enterprise is based on a fallacy if the experience curve effect is true.
The experience curve effect can be observed and measured in any business, any industry, any cost element, anywhere.
Most of the history of insight into the experience curve effect and its significance is still to be written.
Each

