In this tenth-anniversary report, BCG looks back and ahead. What distinguishes the industry’s highfliers? It’s not location, product line, or M&A. It’s innovation and acumen.
Ten years ago, in the aftermath of the financial crisis of 2008, the chemical industry appeared to be in retrenchment. But it was quietly entering a decade of restructuring and reinvestment. Many chemical companies were upgrading their operations, pivoting to take advantage of the boom in shale gas, which reduced petrochemical costs and opened opportunities in the United States. Throughout the industry, companies merged and consolidated their portfolios. The average share price for the industry gradually began to advance until it leveled off in 2018. Then came the pandemic. At first, lockdowns seemed to signal harder times for chemical companies, but expectations of decline proved wrong. It now appears that the industry will have been among the first to recover, and perhaps serve as a harbinger for industrial recovery more generally.
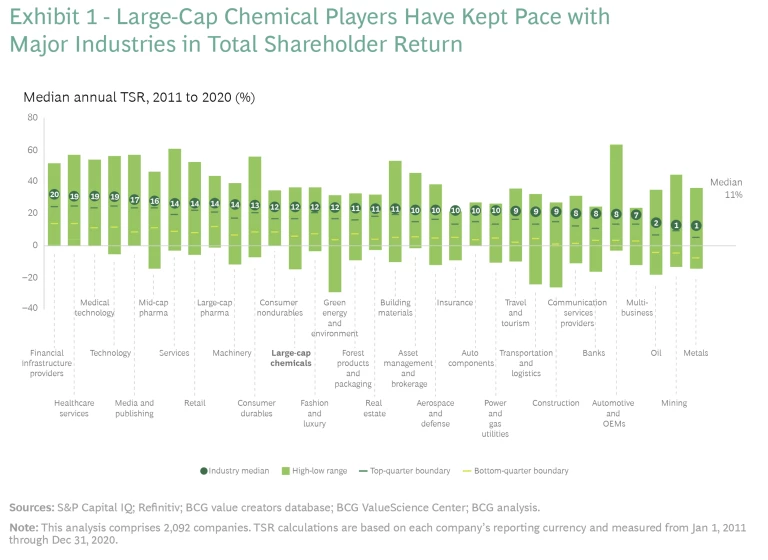
Through it all, the industry’s total shareholder return (TSR) consistently held, at least relative to other industries. According to BCG’s ValueScience Center, the 69 large-cap companies in the chemical industry (those with more than $7 billion in market capitalization) have collectively achieved a 12% median annual TSR from 2011 through 2020. An investment in these chemical companies would have more than tripled in value over that ten-year period. This compares favorably to the 11% median for large-cap companies across all industries. For all chemical companies accounted for in this study (those with market capitalizations of $1 billion or more), the median TSR was 9.1%, still a very respectable figure.
It has been a decade since we published our first annual study of value creation in the global chemical industry. We’re celebrating our anniversary, and gaining some perspective, by taking a longer view than usual. In most previous versions, we looked at median TSR calculations over a five-year span to enable a more coherent view of the industry’s financial behavior than a single year would offer. This year, we’re looking back an additional five years to get an even clearer view of long-term trends.
Our analysis looks at the TSRs of 238 publicly held chemical companies, with valuations of $1 billion or more, from 2011 through 2020. When it comes to median TSR, the chemical industry ranks 13th out of 33 large-cap industries. As always, we see TSR as a valuable proxy for the overall vitality of an industrial sector. The ten-year perspective shows that this industry has been more consistently vital than many people realize, even as it navigated the turbulence of recession, supply shock, and the COVID-19 pandemic. [See “How We Calculate and Report TSR.”]
How We Calculate and Report TSR
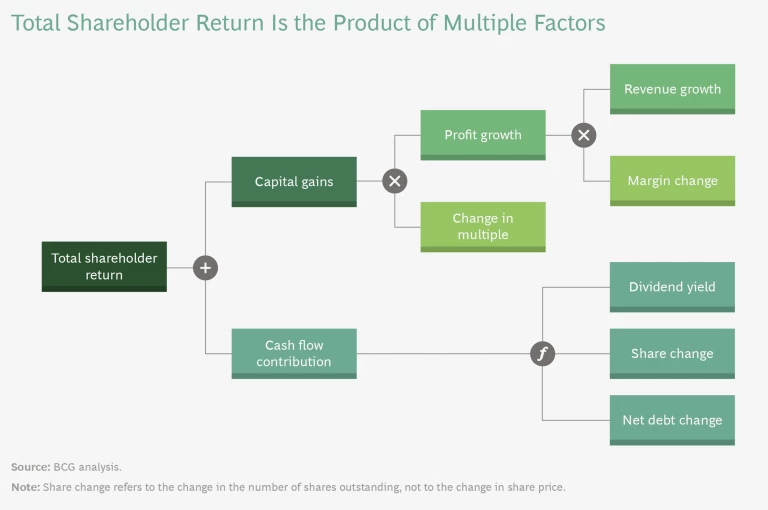
TSR itself is affected by multiple factors. Readers of BCG’s Value Creators series may be familiar with our methodology for quantifying the relative contribution of the various components of TSR. (See the exhibit.) The methodology uses the combination of revenue (sales) growth and change in margins as an indicator of a company’s improvement in fundamental value. It then uses the change in the company’s valuation multiple to calculate the impact of investor expectations on TSR. Together, those two factors determine the change in a company’s market capitalization. Finally, the model also tracks the distribution of free cash flow to investors and debt holders—in the form of dividends, share repurchases, and repayments of debt—to determine the contribution of free-cash-flow payouts to a company’s TSR.
All those factors interact, sometimes in unexpected ways. A company may increase its earnings per share through an acquisition but create no TSR if the acquisition erodes its gross margins. In addition, some forms of cash contribution (like dividends) can impact a company’s valuation multiple in different ways than others (like a share buyback); the effects are complex.
In this report, the TSRs used for groups and comparative purposes are generally medians. The TSRs associated with individual companies are straight calculations of those companies’ capital gains—changes in share price value plus dividend value—rounded to the nearest percentage. Because we looked at both five-year and ten-year time spans for this report, the number of companies varied: there were 238 in the ten-year group and 282 in the five-year group.
We don’t mean to suggest that chemical company leaders should be complacent. Indeed, the spread between the best- and lowest-performing companies is relatively large compared with many other industries. Exhibit 1 shows the spread for large-cap companies with valuations above $7 billion. For those in the bottom quartile, there may be reason for concern.
But for companies in the top quartile, there is reason for celebration. Approximately one-tenth of the chemical companies we studied—specifically, 22 out of 238—are consistent highfliers that landed in the top quartile of annual TSR performance at least four times in ten years. Most of them are in the focused-specialty subsector; they include Sika and Lonza in Switzerland, Berger Paints and Pidilite in India, Croda in the UK, and Sherwin-Williams in the US. Their TSRs are not just high; they tend to have dramatically higher valuations than companies in the other three quartiles. Their numbers have kept the industry’s averages aloft.
As with all the previous reports, we carefully considered the future of the chemical industry. There is reason to be at least cautiously optimistic. As the world makes sense of the twin challenges of the pandemic and climate change, the chemical industry is a leading indicator of overall growth. Its products will be in high demand in a world of increasing digital technology, more sophisticated energy storage, infrastructure replacement and upgrading, and less carbon-intensive footprints.
As the world makes sense of the twin challenges of the pandemic and climate change, the chemical industry is a leading indicator of overall growth.
A Profile of 238 Companies
What is behind the industry’s median annual TSR of 9.1% (12% among large-cap companies) over ten years? Our analysis breaks it down into several drivers. About 4% can be attributed to revenue growth. Another 1.1% represents bottom-line improvement, indicated by changes in the average EBITDA margin. Changes in valuation multiples account for 2%, representing investor perceptions of the strategic and financial outlook of each company. The final 2% is attributed to net cash flow effects, which include changes in debt, dividend yields, and the number of shares. The importance of revenue growth is accentuated with a ten-year timeframe. Over the long run, one cannot create shareholder return without revenue growth.
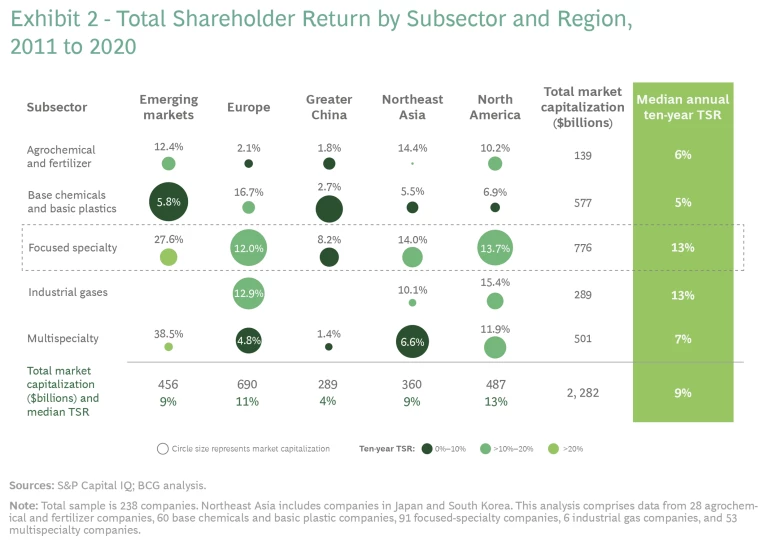
We divide the industry’s 238 companies into five regions and five subsectors, with the median TSR figures for each shown in Exhibit 2. A noteworthy gap between high and low performers can be found in every region. The group of 238 companies includes 62 in Northeast Asia, 60 in Greater China, 40 in emerging markets (including the Middle East, Africa, and Latin America), 38 in Europe, and 38 in North America. Although some regions, such as North America, have outperformed others as a whole, there is little correlation between TSR and geography. There are high and low performers in every corner of the globe.
As for subsectors: there are 28 agrochemical and fertilizer companies, 6 industrial gas companies, and 60 producers of base chemicals and basic plastics (including petrochemicals and derivatives). The largest is the focused-specialty subsector: 91 companies offer products for single segments of the chemical industry. Examples include paints and coatings, adhesives, flavors and fragrances, construction chemicals, and electronic chemicals, such as those used in semiconductor manufacturing. The final subsector is multispecialty companies. These are the 53 companies, generally larger in size, that offer several different types of products. They have often developed from basic chemical companies with a line of commodity products into large multifaceted enterprises.
The Effects of Volatility
After the global financial crisis of 2008, chemical companies faced a series of challenges. These include low demand, fluctuations in the price of petroleum-based feedstocks, and the Fukushima nuclear plant disaster in 2011, which particularly affected Japanese companies and related supply chains. But, starting in 2015, as the global cost of oil fell dramatically, the industry benefitted from low feedstock and energy prices. Average share prices generally grew through 2018, and then they leveled off and fell. This second downturn was probably driven by a rise in the price of oil, then by decreasing worldwide demand, and ultimately by the COVID-19 pandemic. TSR for the industry reached its bottom-most point around March 2020.
In our 2020 report, we predicted a difficult recovery. This reflected the stress that the industry was feeling earlier in the year. Profits had fallen more than 15% in segments such as petrochemicals and intermediates, rubber, additives, fibers, and engineering materials. The average share price had declined by about 35% from prepandemic levels, and the timing of a rebound was uncertain. Chemical industry revenues depend on the resilience of other industries as well, and it wasn’t clear how the breakdown of supply chains or the reopening of manufacturing would unfold.
But the resilience of the industry surprised many observers. By May, TSR had begun to rise again. Revenues related to aerospace or face-to-face contact (such as cosmetics and perfume) are still below prepandemic levels, but other business lines, related to the increased demand by people working at home or sheltering in place, are thriving. These include plastics, glues, paints, and—especially—electronic chemicals. In addition, with people expanding their living space and communities repairing infrastructure, there has been a growing need for construction-related materials and chemicals.
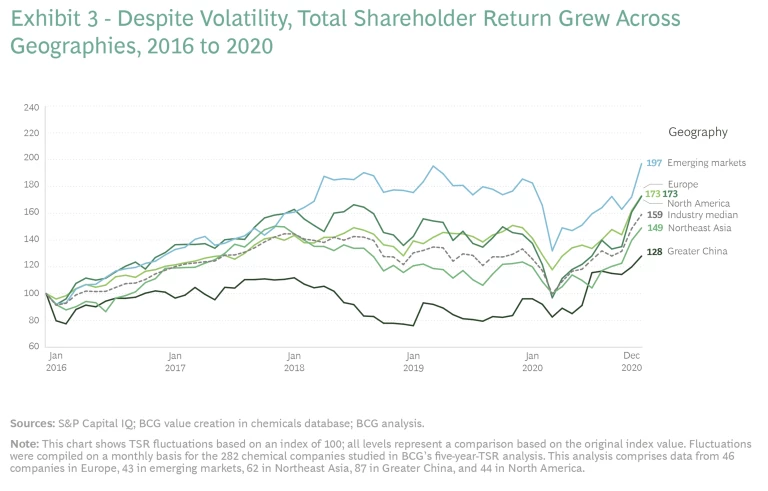
The last five years are broken down in Exhibit 3 by geography and in Exhibit 4 by subsector. Each point in these exhibits represents a monthly change in the median TSR for that region or subsector. This means that these lines reflect not just long-term trends but also short-term transient factors, like temporary supply shortages.
Within the general pattern—steady TSR growth followed by a leveling-off period, then decline and recovery—there was a noteworthy trajectory taken by emerging markets. These include Southeast and Central Asia, the Middle East, Africa, Latin America, and Eastern Europe. Shareholder returns for chemical companies found a higher footing in these geographies than in the rest of the world for about 18 months, starting around 2018. This growth pattern was probably caused by high demand from other industries, like construction and electronics.
Greater China and India are particularly interesting case studies because their economies are so large and influential. Shifts in direction in these regions have enormous impact on other geographies and industries. For example, Greater China’s chemical industry oscillated during and after the financial crisis, soaring high in 2016. But it soon returned to a relatively steady TSR equilibrium. This surprised some industry observers, who expected China to demonstrate accelerated growth. But since the data does not include private and state-owned companies, which are not listed on stock exchanges, it may not reveal the full impact of the region’s chemical companies on the global industry’s growth. These figures may also reflect financial factors unique to the area, such as a general leveling-off of TSR in recent years.
India’s chemical companies began their ascent around 2014, buoyed in part by massive new industrial investment programs and an expanding middle class. Although it is not shown in this exhibit, South Asia’s median ten-year TSR of 32% was the highest of any region, and almost four times the median global TSR of 9%. This reflects the growth of the Indian economy—and also the attractiveness of the Indian stock market for overseas investors.
When analyzed by subsector, the same pattern of overall growth is evident: a general dip started in 2018, followed by a bottoming-out in 2020. TSR has risen since. Focused-specialty and industrial gas companies have consistently achieved higher shareholder returns than the other three subsectors. Exhibit 5 shows how the fundamentals of two subsectors—focused specialty and multispecialty—largely echoed one another’s ups and downs, running in parallel throughout the time period. There are significant operational differences between the two subsectors. Focused-specialty companies have typically spent a greater percentage of revenue in research and development, while multispecialty companies have invested more in capital expenditures. Nonetheless, both subsectors followed the same overall pattern, with return on capital employed declining dramatically after 2018, but profits rising sharply during the first year of the pandemic.
Meanwhile, the TSR of at least two subsectors–base chemical and multispecialty companies–may be catching up to focused-specialty companies. Ten years ago, in 2011, multispecialty companies held a median five-year TSR about 10 percentage points below their focused-specialty counterparts. By 2020, the gap had narrowed to 3 percentage points.
There are several possible reasons for this convergence. Many multispecialty companies have also invested in operational improvements and upgraded their digital capabilities. They appear to be moving further away from the commodity orientation that has kept prices down. They are also streamlining and becoming more profitable. Investors may have priced in their perception of the changes being made by these companies; the results are reflected in TSRs—but less so in other indicators.
Another factor is the volatility of the past few years, and the pandemic, in particular. This has led investors to favor larger chemical companies, such as multispecialty firms, because they are perceived as less volatile than the rest of the industry. The ongoing wave of mergers, divestments, and restructurings may have also tended to increase shareholder value for this subsector.
At a more granular level, some particular segments of the industry showed much better TSR performance than others. Most of these, again, were focused-specialty companies. Exhibit 6 shows the segments that outpaced others consistently over a ten- and five-year timeframe. Highest on the list is electronic chemicals, which include high-purity chemicals used in silicon wafer manufacturing processes, light-sensitive chemicals used in photolithography, and wet-processing chemicals used in other stages of semiconductor production. As increasing numbers of products incorporate computer processors, these chemicals will be more in demand. Some high-TSR segments, like food ingredients and personal-care chemicals, are closely linked to resilient consumer industries. Others, like paints, coatings, and adhesives, boom in lockstep with construction. Although their rising value over the past decade can’t be attributed to the pandemic, it’s worth noting that many of these subsectors have gained momentum with the consumer and technological sectors that thrived in the face of lockdowns.
Flying with the Consistent High Performers
Since first publishing this annual report in 2012, we have always observed a small group of companies at the top of the industry. There is typically a wide gap between the top performers and other companies, even within the upper quartile. From 2011 through 2020, a median gap of 36 percentage points is evident between the top performer (with a median TSR of 52%) and the lowest performer in the upper quartile. A wide gap is also evident between the middle and bottom performers.
This year, we identified 22 high performers with comparatively high TSR performance. Each landed in the top quartile of TSR at least four times in ten years. They are shown in Exhibit 7, placed according to their five- and ten-year medians, shown on the vertical and horizontal axes, respectively.
Many of the top 22 companies have provided tenfold increases in share price. (See Exhibit 8 for a list of these companies.) An investment made in early 2011 in Pidilite, Sherwin-Williams, EMS, or Wanhua would now be worth 8 to 10 times that much—and in the case of Nippon Paint, 16 times. Investments made in Pidilite, Sika, or Asian Paints in early 2002 would now be worth 78, 87, or 130 times the original amount, respectively. The median TSR of the 22 top performers has grown by 22% annually for the past ten years. More than half are in the focused-specialty subsector, including all but three of the bigger companies, or those with market capitalizations of $7 billion or more.
What accounts for the success of these particular companies? It’s not just subsector, as a wide range of performance exists even among focused-specialty firms. Nor is it size; the top 22 range from $1 billion in annual revenue (Pidilite) to more than $18 billion (Sherwin-Williams). They aren’t young upstarts, like the winning companies in tech. The youngest are Wanhua and Westlake, founded in 1998 and 1986, respectively. Most of the top 22 are over 80 years old, and seven date back to the 19th century. The oldest is Sherwin-Williams, founded in 1866. Some have been consistent high-TSR performers for 20 years or more. Croda, Sherwin-Williams, and Westlake were included among the top ten companies in our first report in 2012.
You might think their success is due to the country where they are headquartered—perhaps because emerging economies are more conducive to growth or established industrial companies more stable. But the top 22 come from diverse markets. Headquarters include Greater China, India, Pakistan, and Turkey in the nascent group and the US, Japan, Switzerland, the UK, Germany, and Demark on the mature side.
The exceptional geographic case is India. Five of the top-performing companies are headquartered there, including the top two TSR performers (Berger Paints and PI Industries). Their shareholder value appears to have been propelled by the overall rapid industrial growth in South Asia during this ten-year period—and especially by these players’ ability to make the most of geographic location.
Berger Paints, headquartered in Kolkata, is a compelling example. It has based much of its business model on its ability to reach Indian consumers. Identified by the Financial Times as a company with a “large domestic market share due to consistent quality and marketing,” Berger Paints has a particularly strong presence among India’s large lower-income population, who purchase paints and coatings as aspirational tools. Its 35% to 65% rural-urban mix indicates its broad appeal, and as India’s middle class grows, it serves more high-end products and a well-designed portfolio that moves consumers up the price ladder.
Berger Paints maintains strong ties with India’s large and longstanding network of house painters. The company provides 40 training centers for this group (13 of them in mobile vans), and it trained more than 60,000 painters in FY2020, despite the pandemic. It has also doubled its number of retail dealers from 15,000 to 30,000 since 2015. Finally, Berger Paints has become a major supplier to the many infrastructure-building projects in the country. In all these ways, the company continually pivots to serve India’s diverse customer base.
Berger Paints sets a similarly strong example for innovation. It has moved beyond its original paint, coating, and automotive supply business lines to fast-growing adjacent categories, such as glass, wood, and metal coatings and construction chemicals. Its recent branded products include AntiDust and EasyClean, two dirt-repellent coatings, and an express painting service that uses mechanized tools and costs 40% less than other methods—except when Berger offers it for free to loyal consumers.
This capacity for successful innovation appears to be prevalent among all 22 of the top performers. Another good example is Symrise, a focused-specialty company based in Holzminden, Germany. Symrise is a global leader in flavors, fragrances, and nutrition products. The company achieves about a 20% annual sales turnover for new products, and it has consistently outperformed peers in organic sales growth since 2011. Its investments in continuous innovation include recently opened R&D centers for flavors and fragrances in Dubai, Shanghai, and at the Unilever Foods Innovation Center in the Netherlands. The company is known for its long-standing management; most senior positions have been filled by the same person since at least 2016.
The capacity for successful innovation appears to be prevalent among all 22 of the top performers.
Another general factor related to the success of high performers is the skilled use of mergers and acquisitions. At first glance, this does not appear to make much of a difference. When plotted against the curve of all major companies, in order of lowest to greatest TSR, the companies follow the same curve as the industry as a whole.
However, the attention paid to picking targets and post-merger integration may be what matters more. Westlake Chemical, based in Houston, TX, has had a reputation for high-value M&A and alliances since its founding in 1986. Its predecessor, the Chao Group, worked with Mattel to produce the first Barbie dolls 20 years earlier. The company is one of only four producers of base chemicals and basic plastics in the top 22 performers, and the only one headquartered in a mature economy. Among Westlake’s 2021 acquisitions are Boral’s North American building-products business, which strengthened its position in the region; Dimex, a leading producer of recycled plastic and related green-friendly products; and LASCO Fittings, a designer and manufacturer of injection-molded PVC plumbing supplies. Like other companies in which the family holds a controlling interest (chairman James Y. Chao and CEO Albert Chao are sons of founder Ting Tsung Chao), the company combines a long-term view (of an environmentally sustainable plastics business, for example) with one of the lowest cost positions in the chemical industry. Its focus on commodities and vinyl building products has guided its acquisitions; it is now the second-leading global producer of PVC and chlorine.
Other factors include strategic focus and operational execution. Look closely at these companies, and you’ll find clear strategic focus, a carefully defined product line, technological sophistication, and keen awareness of marketing channels. They are all committed to learning from experience: they continue to become more and more proficient at what they do best.
Strategy and the Ten-Year TSR
A final factor is the business model that chemical companies follow. BCG analyzed 238 publicly held enterprises in this industry as of 2020 and determined that they tend to divide into four broad groups, based on the way they approach their markets.
The most consistently successful of the four, at least in terms of TSR, is the market-based business model. Companies that deploy this model are primarily oriented toward satisfying customer requirements. They typically have a less established advantage in terms of asset base or proprietary technologies. But they have good customer relationships, and they tend to be flexible and responsive. They recognize the shifting requirements of their customers, who they accommodate by synthesizing compounds on demand and by providing support for applications and particular industry needs. These companies hold a median annual TSR of 15% over ten years.
Many of the top 22 performers follow this business model. Sherwin-Williams (which operates almost 4,000 of its own retail stores around the world) and Berger Paints (with its network of painters and retailers in India) routinely draw on customer demand to develop new colors and products. The model is most appropriate for companies with a focus on custom synthesis, formulation, or particular B2B customers or applications.
The second-strongest business model is grounded in technology. Companies that rely on this model compete through proprietary technologies and intellectual capital. This group includes some providers of high-performance polymers, enzymes, and catalysts for industrial processes, as well as electronic chemicals used in manufacturing semiconductors. Innovations like these are often difficult to reverse engineer or reproduce. Companies with this business model thrive particularly well when their offerings are distinctive and few others can supply them. This group’s median annual TSR is 12% over ten years.
The rest of the industry, which includes large companies with multiple business models under one roof, holds a median TSR of 6%. Also included in this group are companies that base their businesses on an asset. This might involve access to a raw material, such as phosphates or other minerals, chlorine, coal, or shale gas and other hydrocarbons. Among the other types of products in this group are ammonia- and urea-based chemicals, inorganics, and benzene-based ingredients. The large investments needed for continuous-flow plants and other asset-oriented processes, along with the strong dependence on balancing supply and demand, can hold back shareholder returns.
One noteworthy chemical company with an asset-focused strategy is Wanhua—a multispecialty organization based in Yantai, a coastal city about 300 miles from Beijing—which is the only China-based company among the 22 highfliers. One of its core products is MDI (a commodity isocyanate and important precursor for polyurethane), for which it is the largest supplier, with a 25% global market share. Products like these require expensive manufacturing facilities with high barriers to entry because they are difficult and dangerous to operate and maintain. Wanhua has thus benefited from China’s depreciation advantages, as well as from its generally lower production and energy costs (with a captive electric power plant and thermal power units) and good relationships with suppliers, including non-Chinese players, such as Linde.
However, these advantages are not enough. Wanhua is also a highly capital-efficient company that builds and operates its production assets at a discount compared to its peers. And it also benefits from skill at global M&A. Notable acquisitions include BorsodChem, a Hungary-based producer of polyurethane and vinyl, and Chematur Engineering, a process specialist and plant manufacturer located in Sweden.
Anticipating the Next Ten Years
What about the long term? Ten years ago, we would have anticipated a period of long, gradual growth, driven in part by shale gas. What about ten years ahead? How will the high performers of the 2020s win their status?
Some trends are visible now, including the value of the right business model. The market-based approach appears to be successful enough that other companies will likely be drawn to adopt it, which inevitably means focusing their businesses more tightly around the product lines and applications they can master. This will be especially important for global companies and those in mature markets.
The market-based approach appears to be successful enough that other companies will likely be drawn to adopt it.
A few conglomerates may remain. But, to sustain performance, they may need to demonstrate strong technological and managerial synergies among their businesses. That includes disciplined capital allocation, rigorously quantified management (to counter the extra costs of running a complex, multifaceted organization), and ongoing portfolio reviews. They would then have to assess each of their businesses against the competition continuously, meaning those focused rivals in each segment, and not the other conglomerates. They would also have to develop the rare capability of steering very different businesses in the same portfolio: those with growth and earning orientations, those that are asset-intensive and asset-light, as well as fully owned subsidiaries and joint ventures.
The rest of the industry will probably coalesce around just a couple of business lines. Meanwhile, new players will arise in the chemical landscape, perhaps with innovative new materials. Even if it takes time to reach a sizable market capitalization, they could ultimately find niches where they thrive, thanks to scarce feedstocks, less-asset-intensive business models, and adaptations of artificial intelligence to R&D.
There will be more companies with consistently high TSRs because this is an industry that learns, especially in times of turbulent change. Product development will move beyond today’s methods and purposes. Rather than investing to optimize existing processes and raise output volumes, chemical companies will innovate in new ways. They will be more agile, apply more digital technology, and collaborate with their customers and a diverse set of ecosystem partners. They will offer more guidance and services, helping customers find applications for their products. Services might include simulation and testing of products under different conditions, registration, and supply chain management or support. Chemical companies will play an active role in circular business models, through which they will collaborate with other companies along the value chain, incorporating more recycling and renewable energy into their processes.
The most successful chemical companies will be well on their way to a fully green operating model.
The imperative for positive environmental impact will grow stronger. The most successful chemical companies will be well on their way to a fully green operating model. Most will be close to net-zero annual carbon footprints, making use of innovations like e-crackers, chemical recycling, bio-based feedstock, and fermentation technologies. Chemical products will routinely contribute to sustainable applications: storing energy, insulating human habitats, and reducing weight and carbon impact. Companies will double down on building capabilities to adapt their value chains to reduce environmental impact. These moves will be driven by increased regulation, like the European “Green Deal.” They’ll also reflect the wishes of millenarian and Gen-Z consumers—as well as the incoming generation of employees.
Supply chains will tend to be more regionalized, even as trading volume grows around the world, to compensate for the vulnerability of global logistics. This may mean higher costs for more redundant asset bases. But companies pursuing these strategies will reap the benefits of assuring their customers of supply stability.
Half of the market growth in chemicals will be located in China, if only because of the supply chains and sourcing already in place. Most top value creators will have a significant footprint in Asia. The Asian demand for chemicals will likely continue to grow rapidly, shifting from commodities to specialties like electronic chemicals and nutrition ingredients. Western chemical companies will need to navigate complex geopolitical hurdles, such as the US-China trade dispute and the European Union’s carbon border tax. Maintaining global and regional supply chains, which is essential for this industry, will become even more difficult for chemical companies than it is today.
The pace of inorganic growth is poised to continue. Many companies will learn to follow an “always-on” M&A approach with well-honed integration practices, capturing synergies without harming their targets’ unique assets. Private equity and private wealth funds will become more prevalent, especially with legacy chemical companies. This won’t greatly affect the TSR data, which assesses only publicly traded companies. But funds will step into a market-making role in this industry, helping traditional chemical companies reshape their portfolios and bringing different time horizons and management capabilities to the market.
By 2031, the COVID-19 pandemic will hopefully seem a distant memory. It will undoubtedly have been followed by other crises: energy supply shortages, other pandemics, or financial meltdowns. The chemical industry may well have built up more resilience, and it will make its way forward, as it has in the past. Though its culture is sometimes seen as reluctant to change, leaders are very aware of their role in fueling the economic development of industries such as manufacturing, construction, agriculture, energy, and mobility. As the world recovers, reconstitutes itself, and rebuilds its structures and processes, the chemical industry will be in high demand.
The authors acknowledge the contributions of their BCG colleagues Jooyoung Ahn, Matthias Baeumler, Robert Blaudeck, Prakash Chandrasekar, Paul Duerloo, Clint Follette, Jan Friese, Amit Gandhi, Abhrajit Guria, Susumu Hattori, Isada Hiranwiwatkul, Christian Hoffmann, Alexander Hogreve, Marcin Jedrzejewski, Jihoon Kim, Abhijit Kodey, Martin Link, Tobias Mahnke, Julia Meisel, Christoph Michel, Marcus Morawietz, Christophe Nauts, Francesco Palmieri, Semi Park, Eduard Pujol, Katarzyna Raszka, Fabrice Roghe, Mirko Rubeis, Asheesh Sastry, Gabriela Schaefer, Naoki Shigetake, Priyanka Singh, Ekaterina Sycheva, Ryan Thaner, Aico Troeman, Kirill Tuishev, Marcus van der Vegte, Arie-Willem van Doorne, Anand Veeraraghavan, and Yaroslav Verkh. They also acknowledge the contribution made by BCG’s ValueScience Center.

