Your business persistently earns below its cost of capital. Despite years of effort, margins are thin, returns are stubbornly low, and performance has not improved. Many companies in this position try to grow their way out of it—only to find that expansion amplifies their weaknesses rather than solving them.
A new BCG analysis reveals a better path. Companies starting from a low-return base can still achieve strong long-term performance—but not by chasing growth prematurely. Instead, they succeed by first shrinking to focus on their most advantaged and profitable core, improving returns, and only then reigniting growth. This deliberate progression is what we call the C-curve.
Low Returns, but High Potential
Persistently low returns on capital (as measured by return on capital employed, ROCE) are surprisingly common across public companies, affecting about one in seven companies globally. These underperforming businesses represent a widespread challenge confronting many portfolios. Even healthy businesses grapple with divisions that underperform, dragging down overall profitability and complicating strategic decision-making.
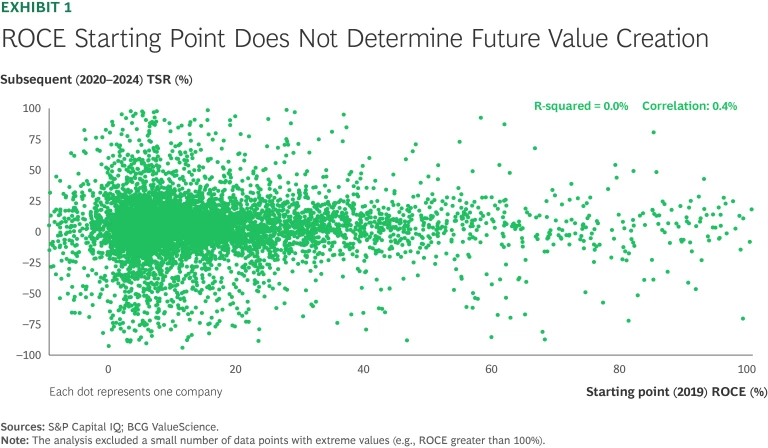
However, current returns do not dictate future value creation. A strong starting position, reflected in high ROCE, does not guarantee superior shareholder value creation, as measured by total shareholder return. Nor does a weak starting point doom a company to TSR underperformance. Our analysis shows that companies starting from very different positions deliver, on average, similar five-year TSR, and the odds of a company delivering top quartile TSR are about the same for either group. (See Exhibit 1 and “About Our Research”)
This is an important reminder for all executives: your starting position is already priced into your valuation. For low-ROCE businesses, that means being valued at low multiples. Creating shareholder value requires outperforming the expectations currently priced into your stock. That’s why TSR outperformance is equally likely from both a low- and high-return starting position—what matters is how effectively you improve from where you start.
Stay ahead with BCG insights on corporate finance and strategy
The Winners Travel the C-Curve
There is wide variation in TSR among those companies with low-return starting positions. (See Exhibit 1.) In studying the TSR winners in this group, a distinct pattern emerges: these companies do not try to grow their way out of their problems.

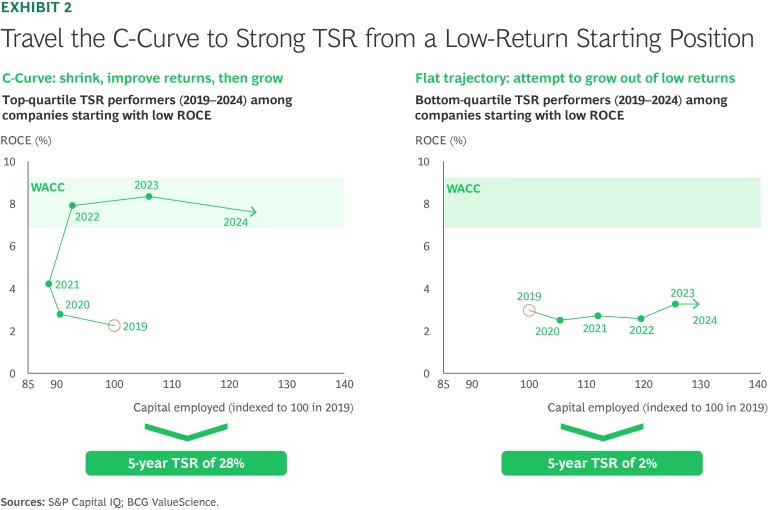
Instead, they follow a three-step process. First, they deliberately shrink their capital base to a smaller, more advantaged, and more profitable core. Second, they focus on improving margins to dramatically raise returns on capital. Finally, only after healthier returns are in place, do they shift back to pursuing growth.
This three-step process—shrinking, improving returns, and then growing—is illustrated graphically as a “C-curve” in Exhibit 2. Companies that traveled the C-curve from a low-return starting position delivered tremendous TSR: 28% from 2019 through 2024, placing them in the top decile of performers in the broader market. In stark contrast, companies that attempted to grow their way out of a low-return starting position tended to generate little, if any, value for shareholders.

Here’s a closer look at the steps followed by the winners:
Step 1: Shrink to an advantaged, profitable core. The TSR winners did not simply execute a cost-out program, but rather strategically and systemically shrank their business down to its profitable and higher-return core. They leveraged a common series of moves to do so:
- Exit unhealthy segments. The TSR winners commonly exited full segments (that is, products, customers, and geographies) that they had previously participated in. For example, a large provider of compression services that owns its equipment fleet achieved this by simultaneously making complementary operational and commercial moves. The company reduced the size of its fleet by 20% while shifting its composition toward more profitable large equipment.
- Right-size the footprint. The TSR winners often reduced capacity and focused on improving the returns of the remaining capacity. For instance, a specialty materials company reduced the footprint of its lowest-return business from five facilities to one scaled, low-cost, and higher-performing facility. The transition was fully funded by the working capital released from the five consolidated facilities.
- Focus on cash flow, returns, and disciplined capital allocation. The TSR winners orient their financial objectives around cash flow and returns, rather than P&L metrics. Further, they use their improved cash flow disproportionately to pay down debt, dispassionately allocating the remaining capital to its best use—including returning it to shareholders. One TSR winner dramatically reduced its capital spending, refocused its business on core profit drivers, and used its increased cash flow to pay down debt and buy back shares. Returning cash to shareholders drove 19 points of TSR from 2019 through 2024, whereas the average company drove only 1 point of TSR through cash flow.
Step 2: Improve margins. After shrinking to a more profitable core, the TSR winners turned their attention to improving performance—intensifying management focus on the core and increasing margins to drive higher returns. These moves often flowed naturally from operating a smaller, more focused core business. The provider of compression services cited above, for example, deployed its smaller fleet of larger equipment only to its most profitable customers. A distributor that is currently traveling the C-curve prioritized its most attractive customer segment and adopted cash-return metrics to guide customer pricing and contracting.
Step 3: Grow the profitable core. The TSR winners pursued growth only after they regained a more stable footing, with a higher-performing, higher-returning core business. They maintained their discipline, however, targeting attractive segments in which they are advantaged, with customers for which they add unique value. One operator of gas pipelines, for instance, focused on adding pipelines in attractive regions directly connected to its existing core lines (having previously exited “orphaned” lines). The specialty materials company described above invested in technologies where it had unique advantages, securing commitments from attractive long-term aerospace customers before making a significant capital outlay.
Putting the C-Curve into Practice
Recognizing the value created by companies traveling the C-curve, executives across all companies should consider their answers to the following questions:
- Do we explicitly identify low-return businesses in our portfolio? Have we looked at our portfolio with sufficient granularity to observe these low-return businesses?
- Do we establish priorities and objectives for low-return businesses that are distinct from those of our higher-return businesses?
- When faced with persistently low return on capital, do we challenge the business to explore options to shrink to a more profitable core?
- If we anticipate improved returns without meaningful strategic shifts, what evidence or rationale supports our confidence in this turnaround, especially when experience indicates otherwise?
Equally as important, executives should learn from the missteps of those who tried to grow their way out of a low-return starting position. In most instances, failing to follow the C-curve will result in weak or even negative value creation. The path to success starts with identifying where you hold a true competitive advantage and focusing there while paring back elsewhere. Simply put, acting on advantage is the ultimate source of value creation.
Traveling the C-curve is a new empirical framing of a corporate-strategy tenet that BCG has long championed: build advantage, increase returns, and pursue growth—in that order. It applies to all companies and executives, not just those at companies with persistently low enterprise returns. Shrinking strategically today to grow sustainably tomorrow is a well-traveled path to improve performance, build a better company, and create value for shareholders along the way.
The authors thank the BCG ValueScience team for its research support and contributions to this article, particularly Aidan Nguyen, Mike Kuldanek, and Brett Schiedermayer.
About Our Research
After these exclusions, we screened the remaining 668 companies for low returns, defined as less than 4% ROCE. We calculated ROCE by dividing net operating profit after taxes by capital employed (excluding goodwill and intangibles). This resulted in a sample of 60 companies for deeper analysis.
We then assessed the TSR performance of these 60 companies from December 31, 2019, through December 31, 2024—comparing the top quartile (top 15 TSR performers) with the bottom quartile (bottom 15).


