

Favorable conditions have catapulted oil and gas players from laggards to leaders in shareholder returns. But to continue delivering value, they must balance four key areas.
Three years on from the outbreak of COVID-19, the oil and gas sector faces a very different environment from the one that existed prior to the pandemic. Russia’s invasion of Ukraine has exacerbated the negative effects of commodity price inflation and a post-COVID supply shortfall, sparking a full-blown energy crisis. In addition to highlighting vulnerabilities within the global energy system, the conflict has also refocused policy efforts. The European Union has adopted REPowerEU, a policy plan aimed at reducing dependence on Russian fossil fuels and further accelerating the energy transition . Meanwhile, in the US, Congress has passed the Infrastructure Investment and Jobs Act and the Inflation Reduction Act, two pieces of legislation that together contain the largest package of climate measures in the country’s history.
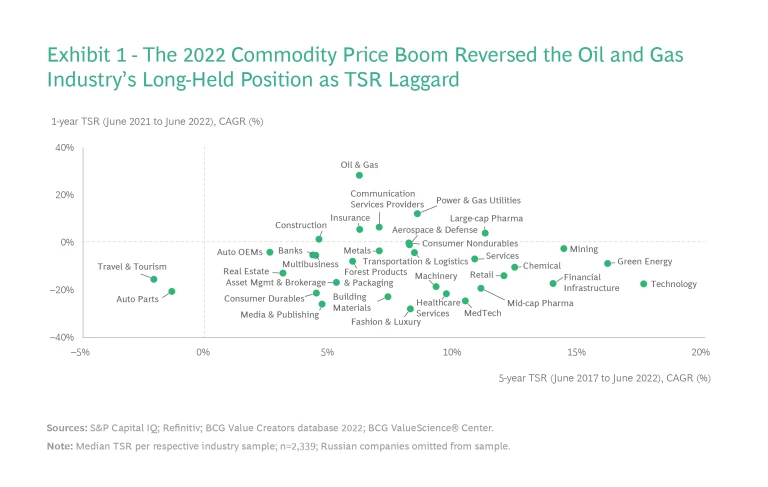
This evolving landscape has had a big impact on the oil and gas sector. High energy prices have swelled profits, leaving companies flush with cash. As a result, oil and gas companies have vaulted from laggards to leaders in terms of total shareholder returns (TSR). According to BCG’s annual Value Creators rankings, oil and gas led all other sectors in one-year TSR to the end of June 2022. (See Exhibit 1.)
As they create plans to deliver value for shareholders, oil and gas companies must take several factors into account. Companies need to meet the goals of the energy trilemma, which involves achieving a secure, affordable, and sustainable energy supply. They must also remain mindful of the risks of overspending—especially as corporate and public climate targets will likely mean a substantial reduction in demand for their core oil and gas products. Consequently, they will require a strategy that maximizes returns from high energy prices in the short term, while investing in low-carbon businesses for the long term.
Our analysis shows that four areas are paramount to future value creation:
- Allocating capital to optimize dividend payouts and earnings growth while maintaining capital discipline
- Incorporating lessons from green power producers with the aim of capturing a multiples rerating
- Delivering results from still relatively new low-carbon strategies
- Creating differentiation in legacy oil and gas divisions by targeting specific value creation levers and geographies
Companies will need to achieve a balance across these areas to drive leading TSR performance in the volatile environment that lies ahead.
Taking the Long View
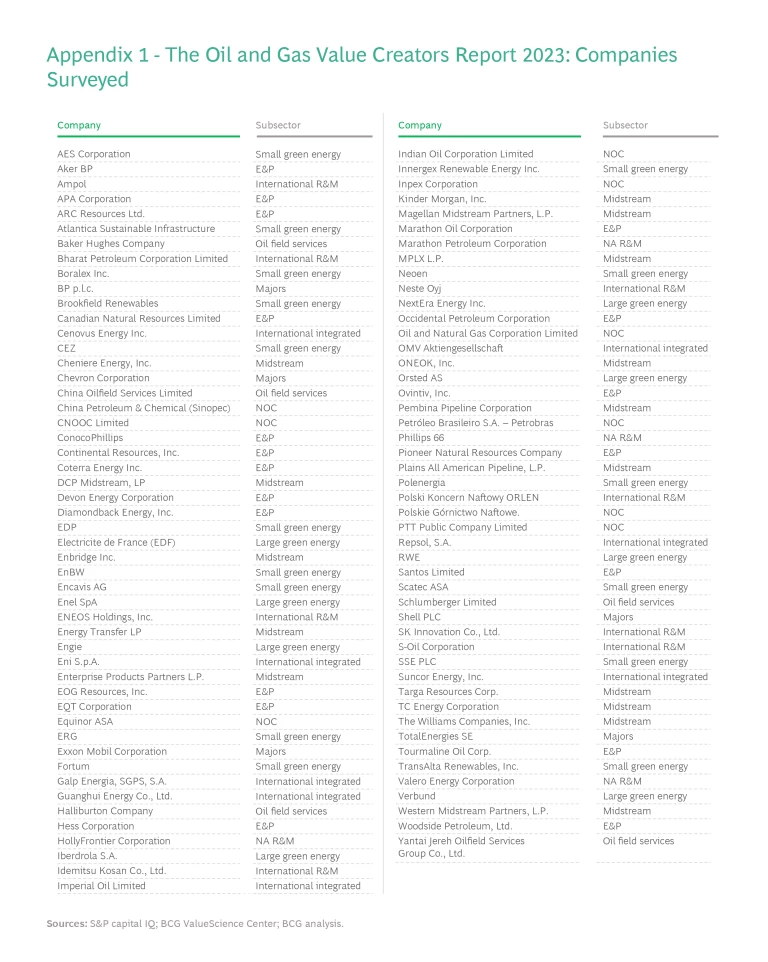
In this report, we have analyzed the historical TSR performance (share price appreciation plus dividends) and key valuation drivers of oil and gas companies. Given that some oil and gas players are redefining their purpose and expanding into low-carbon areas, we have included green power producers (for the first time) for comparison. Because their approach to working and rewarding investors differs from oil and gas players, and because they serve different markets, these companies offer a very different value proposition than oil and gas. (See “Companies in Our Sample.”)
Companies in Our Sample
Companies in Our Sample
Each oil and gas company in our sample was valued at more than $6 billion (as of August 26, 2022) and had a free float of more than 15%. For comparison, we also analyzed the value creation drivers of green power producers with a market capitalization of at least $1 billion and a free float in excess of 15%. We split green power producers into small producers (companies with a market capitalization less than or equal to $25 billion) and large producers.
The companies we studied had a combined market cap of approximately $4.1 trillion. Of this amount, the majors accounted for about 30%, E&P players accounted for about 20%, international integrated about 5%, and green power producers about 15%—with other players accounting for the remaining 30% or so.
Shareholder demands and expectations from the oil and gas sector have varied considerably as price volatility has changed over time. We’ve split the past two decades into four distinct eras to show how investor returns and industry dynamics have shifted. (See Exhibit 2.)
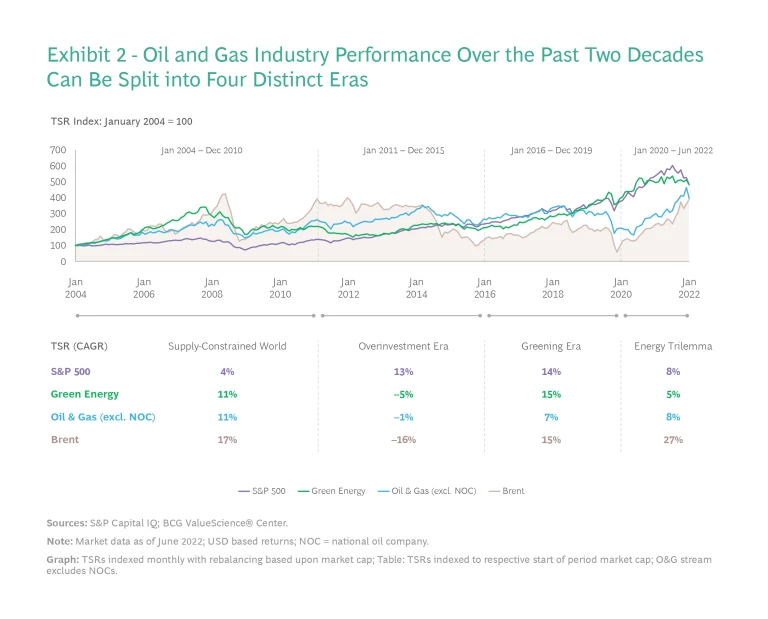
A Supply-Constrained World 2004–2010
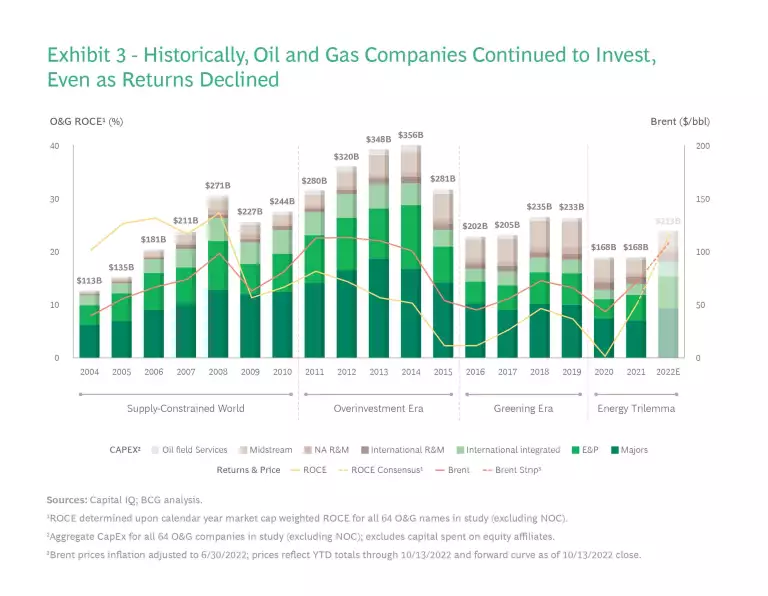
Oil supply constraints kept the price of Brent crude high for much of the period from 2004 through 2010, enabling the companies we surveyed to deliver average annual TSR weighted by market capitalization of 11%, well above the S&P 500’s 4%. From 2004 to 2008, oil and gas companies enjoyed ROCE (return on capital employed) each year of more than 20%— before the measure fell sharply during the global financial crisis and remained low the following year. (See Exhibit 3.) Despite this, oil and gas companies continued to spend on capex, with investment in 2010 more than double that in 2004.
The green power producers in our sample delivered TSR in line with oil and gas players during this time. Capex spending among the group almost tripled over the period, with annual investment in wind and solar peaking in 2009, while ROCE declined from 10% to 8%.
The Overinvestment Era 2011–2015
High oil prices and a desire for growth encouraged companies to spend ever greater amounts on capex and kickstarted the US shale boom. ROCE, however, declined from early 2012 onwards due to overinvestment, even though oil prices averaged more than $90 per barrel between 2011 and 2014. The spending spree came to an abrupt halt in 2015 as a global oversupply of oil—impacted by OPEC’s decision to raise output to prevent shale producers from gaining market share—led the price of crude to plummet. The industry’s profligacy contributed to value destruction, with annual TSR over the period of −1%.
Green power producers also delivered negative returns, with an average annual TSR of −5%, due to falling revenues and weak profit margins. These companies moderated spending on capex following the global financial crisis, as ROCE fell from 8% to 5% over the period.
The Greening Era 2016–2019
In the face of plunging oil prices, expectations of extended lower prices, and weak ROCE, companies cut spending sharply. The 2015 Paris climate agreement encouraged investors to begin prioritizing environmental criteria, contributing to a 25% drop in oil and gas players’ valuation multiples between the beginning of 2016 and the end of 2019. Oil and gas companies delivered annual TSR of 7% over the era, approximately half that of the S&P 500’s 14%.
Meanwhile, the falling costs of wind and solar power drove a rapid expansion in green energy. Over the course of the era, green power producers significantly outperformed oil and gas players, helped by a multiple rerating (premised on a bullish outlook for green energy growth) and improved cash flows to deliver annual TSR of 15%.
The Energy Trilemma 2020–
The pandemic unleashed the largest oil and gas demand shock in history, sending the price of oil, company share prices, and earnings tumbling. But as the world economy recovered, Russia’s invasion of Ukraine—and the resulting impact on global energy flows—caused energy prices to soar. These factors have led governments to reassess the importance of energy security and affordability. High commodity prices are driving strong earnings growth in oil and gas, with annual TSR for the sector in line with the S&P 500 at 8%.
By comparison, green power producers experienced a milder share price dip during the pandemic, but a smaller subsequent recovery. And they have underperformed oil and gas in TSR terms, delivering annual TSR of 5%.
This historical backdrop has shaped investor perceptions of the sector. In our third annual oil and gas investor survey, we discovered a renewed enthusiasm for oil and gas. But we also uncovered specific investor concerns arising from past industry missteps. To win in the energy trilemma era—and create superior TSR over the medium to long term—companies will need to craft strategies that address these concerns. (See “Key Findings: Oil and Gas Investor Survey 2022.”)
Key Findings: Oil and Gas Investor Survey 2022
Key Findings: Oil and Gas Investor Survey 2022
- 60% expected sector TSR to improve over the next two years—indicating that investors still see value upside in oil and gas despite the commodity price rally.
- 85% believed companies should prioritize capital discipline as they navigate the energy transition, while 76% considered dividend growth an important element of players’ capital allocation strategies. Both findings suggest the sector still has a job to do to regain investor trust.
- 76% thought reinvesting capital was important to create value over the long term. At a more granular level, 80% of respondents considered reinvestment in low-carbon solutions important, while 73% thought reinvestment in upstream oil and gas was important.
- Over 50% considered oil and gas a more attractive investment than green power generation, reflecting a renewed emphasis on the energy trilemma—and particularly the importance of security and availability—since Russia’s invasion of Ukraine.
- Investors also set high expectations for rates of return, suggesting they’d had enough of inadequate ROCE. Most investors indicated that the weighted average hurdle rate for new oil and gas developments—the minimum return for a project to get the go-ahead—should be 14% to 18%, depending on the type of project. Returns have been below this level since 2011, though they are well on track to exceed it in 2022.
Shifting Fortunes
We used a one-year and a five-year lens to analyze recent TSR performance of oil and gas companies and green power producers. (See “Components of TSR” for details on our calculation method.)
Over the five-year period ending in June 2022, green power producers mainly outperformed oil and gas companies, with small producers delivering average annual TSR of 15% and large producers delivering 10%. Green producers’ stronger TSR performance was driven by an expansion in their valuation multiples (measured as enterprise value divided by earnings before interest, taxes, depreciation, and amortization) as well as revenue growth and dividend payouts. Together, these factors negated the impact of weak profit margins.
Oil and gas companies, by contrast, mainly used revenue and margin levers to drive earnings growth and turned to dividend payouts to negate the effect of shrinking multiples. Over the same period, exploration and production (E&P) companies delivered average annual TSR of 11%, while the majors delivered annual TSR of 7%.
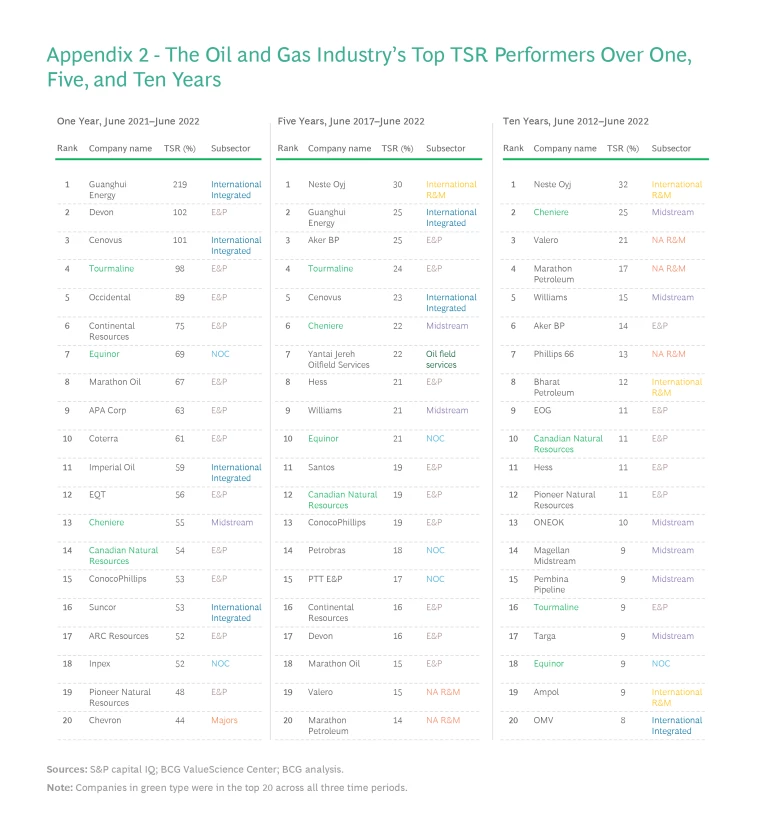
But over a one-year timeframe, the situation was reversed. Oil and gas companies delivered record TSR over the 12 months ending June 2022, due to the impact of the commodity price rally on revenues. E&P players led the way, with one-year TSR of 54%, followed by international integrated companies (37%) and the majors (36%).
Green power producers witnessed negative returns. Over the same 12 months, small green producers delivered TSR of −6% and large green producers delivered −12%. Supply chain disruptions, rising interest rates, and higher project costs impacted green producer earnings, while their valuation multiples dipped as investors rebalanced priorities across energy security and sustainability.
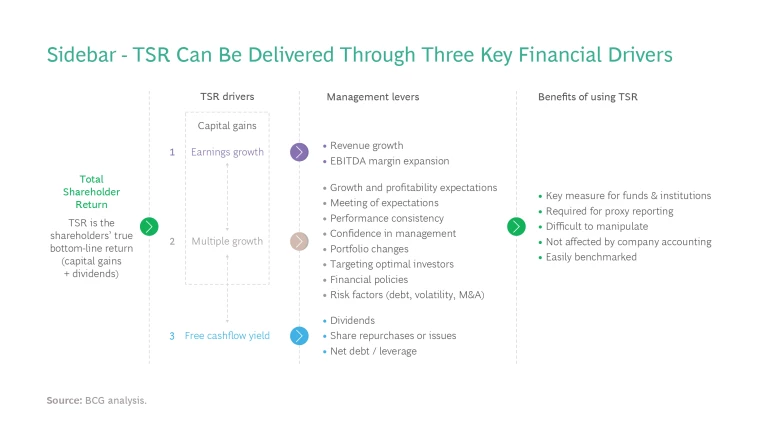
Components of TSR
Components of TSR
Our approach deconstructs TSR into a number of underlying drivers. We use a combination of revenue growth and margin change to assess changes in fundamental value. We then factor in the change in a company’s valuation multiple to determine the impact of investor expectations. Together, these two factors determine the change in a company’s market capitalization and investors’ capital gain (or loss).
Finally, we track the distribution of free cash flow to investors and debt holders in the form of dividends, share repurchases, and repayments of debt to determine the contribution of free cash flow payouts to a company’s TSR.
Building Resilience Through Capital Allocation
To create value in a volatile world, oil and gas companies need a capital allocation approach that enables them to build resilience during downturns and make the most of new opportunities. But because they have so much cash today, it’s vital that companies carefully weigh decisions about where to deploy their capital to avoid repeating past mistakes. In a highly cyclical industry, making the right choices won’t be easy. Companies will need to make tradeoffs as they aim for the optimal balance of short-term and long-term levers. Here are some of the main factors they should bear in mind:
Maintaining Capital Discipline While Optimizing Payouts
Our survey indicates that the vast majority of investors want oil and gas companies to maintain capital discipline. That generally means low levels of reinvestment, high returns of cash to shareholders, and high hurdle rates on future projects. At the same time, investors are willing to consider reinvestment as part of a disciplined capital allocation strategy. (See “Key Findings: Oil and Gas Investor Survey 2022.”) But because of investor concerns about past profligacy, company bosses feel under pressure to keep a lid on spending.
Companies should invest capital now to support their legacy business and build advantage in green energy and low-carbon solutions.
Despite strong cashflows and projections that the sector’s ROCE is heading back toward 20% over the near term, most equity analysts expect that companies will deploy less than 45% of their operating cash flow on business reinvestment from now until 2024. This is up from a reinvestment rate of 38% in 2021, but down from 64% in 2019. In this environment, achieving the optimal balance between reinvestment and cashflow drivers such as dividends or debt reductions represents a significant value creation challenge for companies. By not investing sufficient capital now when they are cash-rich, they risk losing out on the opportunity to support their legacy oil and gas businesses and to build a sustainability advantage in green energy and low-carbon solutions.
Over the five years ending June 2022, debt reduction was an important driver of TSR among oil and gas companies. But after prioritizing deleveraging as a corporate action starting in 2016, most companies are close to historically low levels of debt. (Company debt jumped in 2020 due to the pandemic, but players used subsequent earnings to bring it under control.) This means they have more capital to deploy elsewhere, making the choice between dividends and reinvestment even more stark. It also means that debt reduction is unlikely to be such a positive TSR driver going forward.
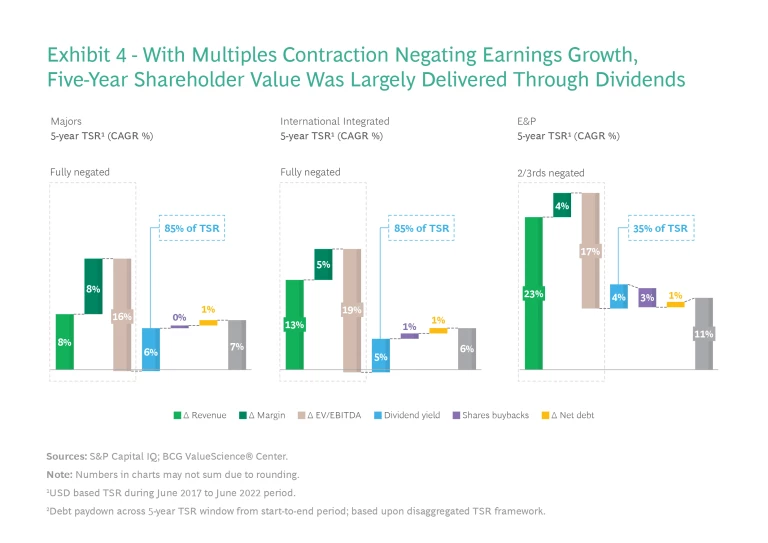
Dividends stood out as a crucial value creation tool for oil and gas players over the five-year period. The majors relied on dividend payouts to create positive TSR as shrinking valuation multiples offset the impact of robust earnings growth. This strategy resulted in the majors delivering average annual TSR of 7%, with dividends making up 85% of TSR. (See Exhibit 4.) The same picture emerged when we analyzed the performance of international integrated players. They faced an even larger multiple contraction and also turned to dividend payouts to create positive TSR of 6% (with dividends also making up 85% of TSR.)
Investors continue to prioritize dividend payouts. But as companies consider where best to deploy their cash to maintain strong capital discipline, they need to be mindful of potential regulatory developments that could impact their decisions. In the US and Europe, policymakers are threatening to levy windfall taxes that could hit oil and gas earnings and dividends, while the Inflation Reduction Act in the US will introduce a new 1% excise tax on stock buybacks beginning in 2023.
Earnings Growth a Key Value Creation Differentiator
The majors have responded to the energy transition with different strategies. These have shaped the composition of assets through which they generate revenues and earnings, resulting in a growing divide between European and US players.
The Europeans are pivoting their portfolios towards green energy investments more aggressively than US players, while disposing of upstream assets. In the process, they are becoming broad-based energy companies. Meanwhile, the US majors are investing in targeted low-carbon areas, such as biofuels, hydrogen, and carbon capture, utilization, and storage. They are also increasing production volumes and decarbonizing upstream operations through efficiency measures.
Earnings growth was the main driver that determined which of the majors were TSR laggards and which were leaders during the five years ending June 2022. Despite the Europeans’ push to diversify away from oil and gas, earnings increases were driven largely by companies’ upstream strategies—demonstrating the importance of legacy oil and gas operations to their financial value proposition during this period.
The United States’ Chevron and France’s TotalEnergies produced the strongest earnings improvement by increasing upstream production, benefiting from rising commodity prices, and delivered TSR at the top of the group. (See Exhibit 5.) ExxonMobil also grew earnings through higher revenues and margins, despite cutting volumes by 7% between June 2017 and June 2021, and delivered five-year TSR in the middle of the group.
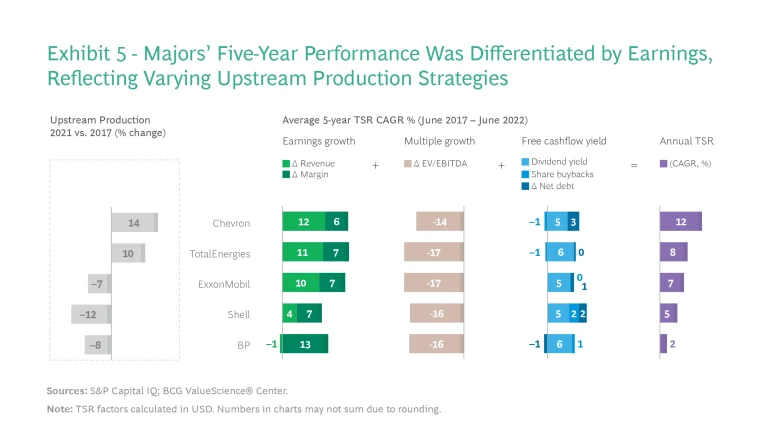
By contrast, revenue growth at Shell was weak and BP saw revenues decline after both companies reduced upstream production—although BP had the biggest margin expansion among the majors. As a result, BP and Shell delivered five-year TSR at the bottom of the group.
Oil and Gas Companies Have Yet to See a Multiples Rerating
A key value creation conundrum for the majors is how best to allocate capital to unlock a rerating in their multiples on the back of record earnings and green energy investments. While green power producers’ valuation multiples grew over the past five years, the multiples of oil and gas companies have contracted—most likely reflecting investor caution about their ability to maintain earnings over time. Investors awarded green power producers higher multiples even though they typically paid lower dividends and had higher leverage and weaker credit ratings than oil and gas players.
The majors experienced the effect of shrinking valuation multiples on their five-year TSR performance to a similar extent across the group. However, the US majors benefited from higher multiples over the period than their European peers despite spending less on the energy transition. This is likely due to their higher per-share dividends over the past five years, as well as lower debt levels and better credit ratings due to their stronger upstream earnings.
For the European majors, our analysis suggests that less transparency about the contribution from their new green businesses may have been a factor in preventing these companies from achieving an improvement in their multiples. Investors may also have been deterred by the structurally lower returns provided by green businesses compared with oil and gas activities—driven by the lower risk profiles, reduced complexity, weaker barriers to entry, and higher levels of competition typical of these businesses. This is likely to drag on oil and gas companies’ multiples until they’ve built a sizeable position in green energy.
Subscribe to our Energy E-Alert.
Looking to the future, the Europeans have set themselves more demanding targets than the US majors to reduce scope 3 emissions (emissions caused by using their products). This will require the Europeans to continue investing in low-carbon businesses. At the same time, it could limit funds for dividend payouts and potentially hold back any improvement in their valuation multiples.
Oil and gas companies face additional capital allocation challenges from other directions. As industry boundaries blur, many oil and gas players are competing with dedicated power and utility companies that have very different shareholder valuation propositions. Most of these companies have built a proven track record in renewable power generation. This potentially places them in a stronger position to secure investor capital than oil and gas players that are confronted with a broad range of management priorities and are still developing green capabilities. Meanwhile, private equity players and other new entrants are investing more in oil and gas. To compete against these different groups, oil and gas companies will need robust capital allocation processes so that they can deploy capital effectively across varied business segments.
Building a Sustainability Advantage in Green Energy and Low-Carbon Solutions
Climate action has become a global imperative, and oil and gas players will need to evolve their business models to ensure they remain part of the solution to meeting energy demand while mitigating climate risks . This evolution can also have positive implications for value creation over the medium term: green energy and low-carbon solutions can help oil and gas companies to achieve a multiple uplift and build greater financial resilience.
By investing in green businesses, companies can reduce their exposure to oil price volatility, access new markets, benefit from returns that while typically lower are more reliable, and reduce risks to future profitability from new taxes and declining fossil fuel demand. But, judging by the record of green power producers, achieving a meaningful TSR improvement from green energy is likely to take time and require both scale and a strong market position.
Leading green power producers, such as the United States’ NextEra, have benefited from a rerating in their valuation multiples by investing consistently in low-carbon businesses for more than a decade. Denmark's Ørsted (formerly DONG Energy) pivoted its entire business towards green energy and exited oil and gas completely. For most green power producers, EBITDA from green operations is more than 50% of the total. Green producers also report the performance of their low-carbon businesses separately, enabling them to secure an ESG premium in their multiple.
Oil and gas players will need to evolve their business models to ensure they remain part of the climate action solution.
Before they can achieve a similar multiple rerating, oil and gas companies will likely need to demonstrate an equivalent commitment by building scale and achieving consistent earnings from green energy and low-carbon solutions. In the current high oil price environment, oil and gas companies have an opportunity to refine their energy transition strategies and channel some of their bumper earnings into low-carbon investments. From our analysis, we’ve found that M&A, strategic partnerships, and joint ventures are companies’ preferred routes to gain entry to new green energy markets, while organic CAPEX is used to build scale subsequently.
Driving Differentiated Performance in Legacy Oil and Gas
Across oil and gas companies, individual players were able to achieve five-year TSR that was 20 percentage points, or more, higher than other companies’ by pressing the right value creation levers. TSR leaders (top quartile players when the majors, international integrated players, and pure-play E&P companies were ranked by TSR performance) typically achieved their pole position by paying down debt and growing earnings from oil and gas. In addition, they were more restrained in how they reinvested earnings.
For example, Canadian Natural Resources reinvested less than 50% of its operating cash flow, based on the five-year average from 2017 to 2021. But it saw a TSR contribution from earnings growth of 27%, on top of a 5% TSR contribution from improved leverage and a 7% contribution from payouts. After taking into account declining multiples, the company delivered total TSR of 19%, landing in the top quartile among its peers.
The geographical presence of the majors, international integrated, and E&P companies also had a bearing on their TSR performance. Players whose international assets were mainly outside Europe and those with a majority of their assets in the US Permian shale basin delivered the strongest five-year TSR. However, the higher multiples historically enjoyed by Permian and Marcellus producers contracted over the period, bringing them in line with producers in other basins.
Among E&Ps, deal activity was high. E&P players that used M&A to consolidate their position in basins where they already had a strong presence delivered higher 5-year TSR than those that moved into new areas. For example, Australia’s Santos acquired Oil Search in 2021 and Quadrant Energy in 2018, in addition to acquiring other assets in and around Australia. It completed deals with a gross value of nearly $13 billion between June 2017 and June 2022 (equivalent to 74% of the company’s June 2017 market cap), consolidating operations and enabling regional scale and synergies, and saw 5-year TSR of 19% (top quartile among its peer group).
In a world where energy security is a priority, oil and gas companies need to ensure they have robust asset and portfolio strategies in place. The companies that were most successful at M&A over the past five years were able to act decisively to take advantage of favorable market conditions. To create future value, players will require clear strategies for their upstream assets linked to navigating the energy trilemma. But they will also need to improve the capital efficiency of their operations and make upstream investments that prioritize basins with the lowest carbon emissions as well as the lowest costs.
The confluence of energy crisis and energy transition imperatives poses fresh challenges and opportunities for oil and gas companies. Recent world events have generated renewed demand for their core products. However, as actors in a cyclical industry, oil and gas companies can’t afford to become complacent about their current TSR leadership position. True, they must make the most of high commodity prices when these happen. But they also need to build discipline and resilience into their value creation strategies if they are to keep investors on board for their energy transition journeys.
The authors thank BCG’s Patrick Herhold, Sylvain Santamarta, Ross LaFleur, Stefan Szlendak, Bumjoon Kim, Amy Liang, and Polly Ho for their contributions to this report.
Appendix
Appendix