
BCG’s 2020 Value Creators rankings are being unveiled at a unique moment in economic history. Although companies have needed to endure multiple cycles of volatility and disruption in the past, the economic impact of the COVID-19 pandemic is unparalleled in its scope and magnitude.
For the past 22 years, BCG has been ranking companies on the basis of total shareholder return (TSR), a long-term metric that reflects the true bottom line for a company’s shareholders. The 2020 Value Creators rankings are based on data as of December 31, 2019—just as the first reports of a novel coronavirus outbreak began to circulate. As a result, the rankings do not capture the impact of the crisis. They provide a valuable frame of reference, however, by indicating which companies and industries entered the crisis with TSR momentum and which did not.
Exhibit 1 compares the five-year average TSR performance across 33 industries with their year-to-date performance through April 22, 2020, which provides an early indication of how the pandemic has affected value creation.
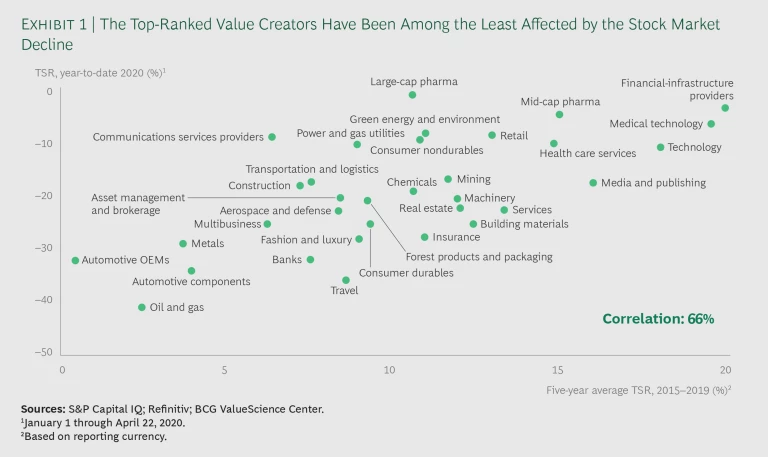
A significant correlation is evident, with five top-performing industries in terms of average five-year TSR (financial-infrastructure providers, medical technology, technology, mid-cap pharma, and health care services) also being among the one-third of industries least affected by the year-to-date stock market decline. Companies in these industries possess cutting-edge technology, troves of data, and robust innovation capabilities. Such attributes allowed these industries to outperform during the bull market and now make them more resilient in the face of the current adversity. These qualities may also enable the companies to continue delivering strong and sustainable TSR when the crisis ends—although they will need to fight through potentially protracted economic headwinds.
Conversely, industries already facing challenges before COVID-19, such as oil and gas, metals, and automotive, have been hit especially hard by the recent market contraction.
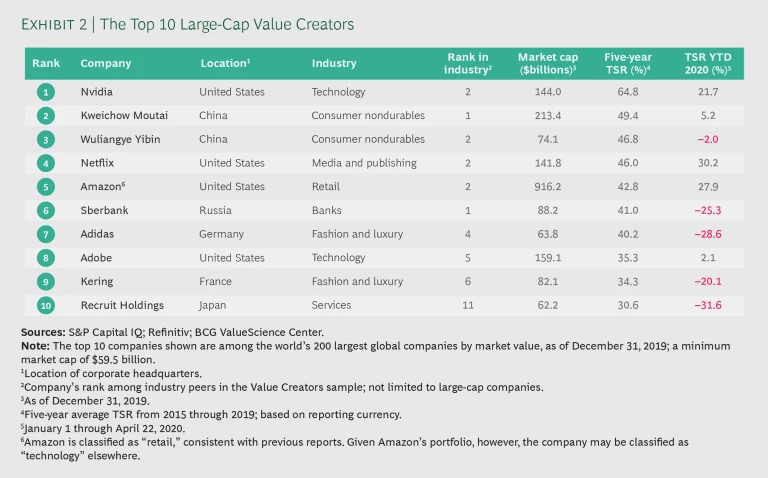
Overall, the 2020 rankings show that the reversion toward historical norms that was evident last year has continued. Whereas prior years had seen technology and media companies dominate the large-cap top ten list, the 2019 list was already somewhat more diverse. And the diversity is more pronounced this year. (See Exhibit 2.) On the basis of their average TSR over the five years from 2015 through 2019, technology and media companies claimed 4 spots in the large-cap top 10 and 7 spots in the large-cap top 20—down from 6 spots and 8 spots, respectively, in last year’s rankings and 9 spots and 13 spots, respectively, in the 2018 rankings. In contrast, two fashion companies, Adidas and Kering, ascended to the large-cap top 10, whereas no companies from their industry belonged to this elite group last year. A third fashion company, LVMH, joined the large-cap top 20.
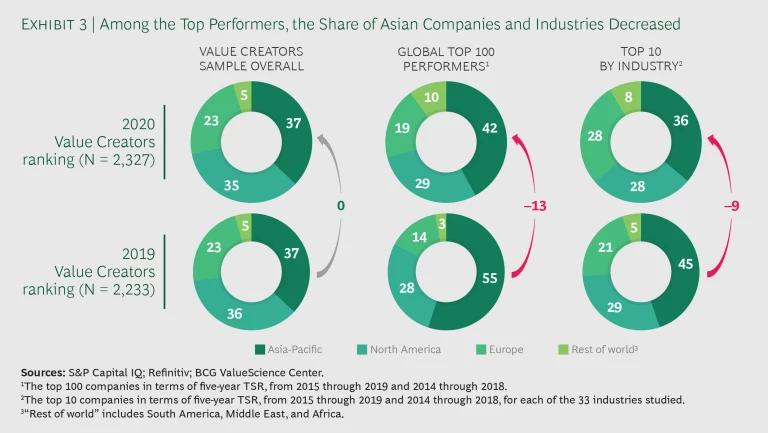
Diversity is also returning with respect to geography. Our data shows that investors had increasing confidence about the value creation potential of European companies on the eve of the crisis. Asian and North American companies each account for slightly more than one-third of the full sample of over 2,300 companies, and European companies make up about one-quarter. Among the top 100 performers, 42% are Asian, 29% are North American, and 19% are European. But compared with the previous year—when the sample had the same geographic distribution—more European companies have broken into the top 100, while the number of Asian companies has declined considerably. (See Exhibit 3.)
The trend toward geographic diversity is also evident when looking at the top 10 large-cap value creators. In this year’s rankings, four are headquartered in the US, three in Asia, and three in Europe, whereas last year seven were headquartered in the US, two in Asia, and one in Europe.
The performance of the companies at the top of our rankings is, once again, extraordinary. For example, the top 10 large-cap value creators delivered an average five-year TSR of 43.1% from 2015 through 2019, spanning a range from 30.6% to 64.8%. In contrast, the median TSR for all of the more than 2,300 companies in the database was 9.6%; the median TSR in last year’s sample, covering 2014 through 2018, was 8.2%—in both cases, broadly in line with long-term capital market returns.
Reinforcing an analysis conducted last year, we again found that it is extremely rare for a company to achieve such strong performance year after year. Among the more than 2,000 companies in our database that were publicly listed during each of the ten years from 2010 through 2019, only 6 (approximately 0.3%) outperformed their respective local-market index every year. And while we have seen significant TSR momentum carry over from the bull market on an industry level, crises often are opportunities for some companies to thrive, while others struggle to adapt to new rules of value creation.
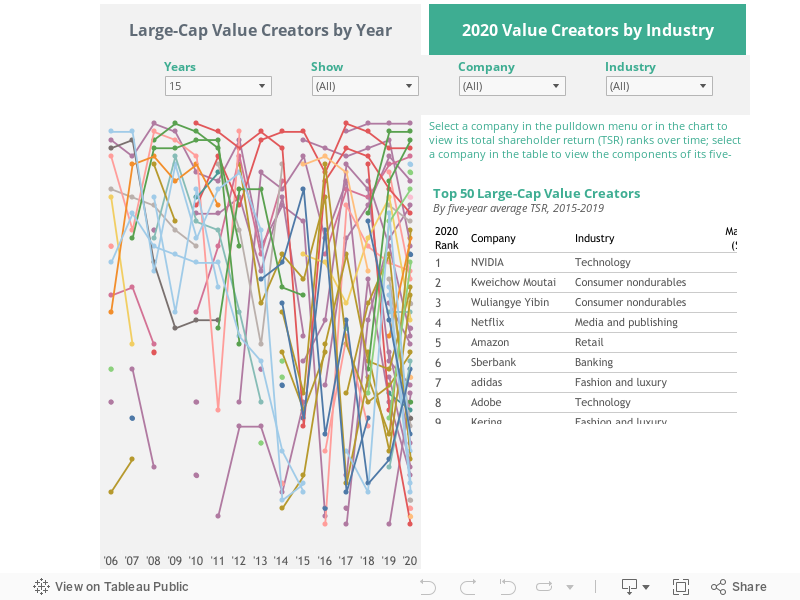
The interactive format allows you to delve deeper into the TSR performance of the top 50 large-cap companies in our 2020 rankings—including examining their performance since we initiated our Value Creators series in 1999—and into the TSR performance of companies across the 33 industries. The interactive presentation also disaggregates the TSR performance of individual companies into its key components.
Methodology
Methodology
Since 1999, BCG has published annual rankings of top value creators based on total shareholder return (TSR) over the previous five-year period. The 2020 rankings reflect our analysis of TSR at 2,327 companies worldwide from 2015 through 2019. To arrive at this sample, we began with TSR data provided by S&P Capital IQ—data that covers nearly 60,000 companies. We eliminated companies that either were not listed on a world stock exchange for the full five years of our study or did not currently trade at least 20% of their shares in public capital markets.
We further refined the sample by organizing the remaining companies into 33 industry groups and by establishing an appropriate market-capitalization hurdle to eliminate the smallest companies in each group. (We identify the size of the hurdle for each industry in the interactive.)
For our global large-cap ranking in the interactive, we focused on the top 50 companies of the 200 largest companies by market capitalization. We base the global and industry rankings on five-year average TSR performance for the individual companies from 2015 through 2019.
In addition, for all but four of the industry rankings, we break down TSR performance into the six investor-oriented financial metrics used in the BCG TSR disaggregation model: sales growth, margin change, multiple change (EBITDA), dividend yield, change in the number of shares outstanding, and change in net debt.
For four industries—asset management and brokerage, banking, insurance, and real estate—we use a slightly different approach to TSR disaggregation because of the special analytical problems involved in measuring value creation in those sectors. For asset management and brokerage, banking, and real estate, equity growth replaces sales growth, ROE change replaces margin change, and the P/E multiple replaces the EBITDA multiple. Change in net debt is not shown. For insurance, equity growth replaces sales growth, and the price-to-book multiple replaces the EBITDA multiple. Margin change and change in net debt are not shown.
This interactive reflects the rankings of companies in our 2020 database and does not include companies that have dropped off the list prior to 2020 as a result of mergers, bankruptcies, or other events. For that reason, the rankings from previous Value Creators reports may be slightly different.
Sources: S&P Capital IQ; Refinitiv; BCG ValueScience Center.
Notes: Market cap is shown as of December 31, 2019. Location shown is of the corporate headquarters. The contribution of each factor in the TSR disaggregation to the five-year average TSR is shown in percentage points. Dividend yield may include cash dividends, special dividends, proceeds from spinoffs, other extraordinary payouts and adjustments for share splits, issuance of bonus shares, or other one-off events. Disaggregation is multiplicative but converted and shown here as additive, with remainders assigned to the margin and multiple change fields. Because of rounding, the numbers may not add up to the TSR figure shown. Share change refers to the change in the number of shares outstanding, not to the change in share price. Net debt change refers to the change in market capitalization relative to the change in enterprise value, and it includes the change in debt and cash.
Disclaimer: The materials contained in this interactive are designed for information purposes only. BCG does not provide fairness opinions or valuations of market transactions, and these materials should not be relied on or construed as such. This interactive does not provide investment or financial advice. Users should contact their advisor to receive such advice.
BCG has used publicly available data. BCG has not independently verified the data and assumptions used in these analyses. BCG has made no undertaking to update these materials after the date they were gathered for publication, after which such information may become outdated or inaccurate. Changes in the underlying data or operating assumptions will have an impact on the analyses and conclusions. The underlying model used for this interactive is designed to work across industries and is no replacement for a detailed calculation that accommodates company- or industry-specific adjustments, which may have an impact on the accuracy of the results.


