More than seven years have passed since the onset of the financial crisis, and the engineering, construction, and services (ECS) industry has not yet fully recovered from the blow. That’s reflected in the sector’s median annual total shareholder return (TSR), which has trailed the S&P 500 in three of the past five years. (The sector slightly outperformed the S&P 500 in 2010 and 2012.) Although many ECS companies benefited from the run-up in the broad U.S. equity market in 2013 and 2014, they continued to underperform on fundamental measures. Today, there are concerns about both current and future performance: the industry’s aggregate profit growth and valuation multiples continue to trail the S&P 500 by a sizable gap. Adding to worries about global competition and the pressure it puts on margins and win rates, management and investors alike are paying increasing attention to the construction sector’s low productivity and the potential for a prolonged slump in oil prices.
The oil price slump is having decidedly mixed effects on ECS players. The pace of infrastructure construction is expected to accelerate in the developed markets whose economies continue to recover. But the multiples of ECS companies with extensive exposure to the energy sector, the main engine of the industry’s growth since the early years of this century, are not expected to reap the full benefit. A sustained slump will likely spur increased M&A activity as ECS companies build scale and attempt to diversify their order books beyond oil and gas projects.
This is The Boston Consulting Group’s third annual report on the ECS industry as seen through the lens of shareholders. In this year’s report, we have expanded the company sample to 75 to better reflect the full scope of global companies participating in ECS. This report is a companion piece to the seventeenth annual report in BCG’s Value Creators series. (See Value Creation for the Rest of Us: The 2015 Value Creators Report, July 2015.) The series provides detailed empirical rankings of the world’s top value creators and distills managerial lessons from their success. It also highlights significant trends in the global economy and world capital markets and describes how these trends are likely to shape future priorities for value creation. Finally, to help companies improve their management of value creation, the series provides details on BCG’s latest analytical tools and client experiences.
Top-quartile ECS companies constitute a roughly equal mix of developed- and developing-market players.
- Six of the 19 companies in the top quartile are based in Japan. Without them, developing-market players would have outnumbered developed-market players in the top quartile by a two-to-one margin. Japan’s strong showing is unprecedented in the past 15 years. Japanese companies have occasionally appeared in the top quartile but not consistently or in large numbers.
- About 60 percent of the top-quartile companies operate mainly in the Asia-Pacific region, reflecting in part the heavy presence of Japanese companies. The remaining emerging-market players in the top quartile are based in Latin America.
- European companies made a strong showing relative to other developed-market players and account for one-fifth of the top quartile.
- North American companies are absent from the top quartile, which was not the case in the first decade of this century, when North America was consistently represented.
- Categorized by business model, half of the top performers are infrastructure construction players.
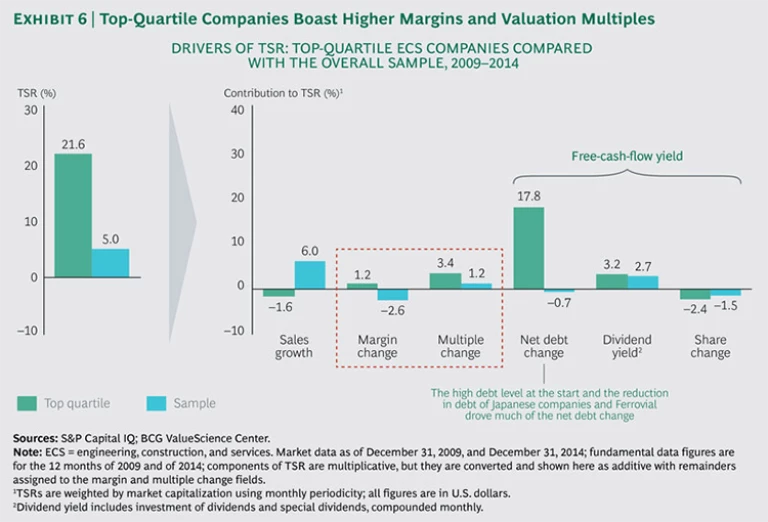
In contrast to their performance in the early years of this century, when revenue growth drove returns, most companies in the top quartile achieved higher margins and valuation multiples.
- Top-quartile companies improved their TSRs not by generating higher sales but by focusing on higher-margin projects. That is, they posted lower sales but commanded higher margins.
- The margins of the overall sample contracted, reflecting the highly competitive global environment in which ECS companies operate.
ECS margins have declined in the past five years, to the detriment of overall TSR performance.
- Revenue growth has supported TSRs to some extent, but its positive effects have been offset by significantly reduced margins, which have been contracting by about 2.6 percent annually.
- Absent continued healthy cash payouts to shareholders, ECS TSRs would look even worse than they do.
The formulas for top performance varied by regional focus.
- Winners in the developed world (excluding Japan) distinguished themselves by enhancing margins, completing strategic transactions, strengthening their balance sheets, and deploying their capital in a disciplined way.
- Strong cash flows powered the returns of top-quartile Japanese companies.
- Top developing-market players relied on revenue growth.
The rationales for M&A are evolving.
- ECS companies remain active in the M&A market, and most companies have ample resources for doing more deals. Overall deal volume is down since the 2007–2008 peak. In 2014, however, there was a slight uptick.
- Many players are pivoting away from tuck-in deals, opting to do fewer and larger deals that offer strategic opportunities for capturing both revenue and cost synergies.
- Acquirers seeking revenue synergies must devote significant time and attention to the structure of the combined organization and to employee retention, culture, and communication.
- Developed-world players must rethink their M&A objectives. Rather than seek revenue increases alone, acquirers should consider deals with an eye toward maintaining or improving margins.
- The shift to an approach that is more oriented toward margin improvement presents acquirers with significant opportunities to rethink their organization structures and operating models.
The implications of the oil price collapse are still coming into focus.
- Increased production from Libya, Iraq, and the U.S. has flooded the market with crude oil and—in combination with weak consumption growth in China, the source of 40 percent of demand growth in the past ten years—has driven prices down 60 percent in less than a year.
- The impact on ECS players will be mixed, depending on their backlog exposure to oil and gas projects. ECS companies with high exposure to oil and gas and mining will struggle as they adjust to slower growth in these segments. These players will be compelled to pivot away from oil and gas and mining to other sectors such as infrastructure, which is expected to be positively affected by lower oil prices.
Superior TSR performance in ECS rests on six pillars.
- Companies that have the ability to access and win contracts in regions with better tailwinds generate higher TSRs.
- The right mix of projects and competitive differentiation in targeted sectors are critical components of success.
- Companies must achieve scale to win megaprojects and design-build contracts.
- The ability to conduct M&A productively is a positive attribute.
- Organizations must be fine-tuned for cost efficiency.
- The optimal portfolio balances risk, return, and volatility across cycles and locations.
A World Turned Upside Down
Uncertainty is a quality to be cherished. If not for it, who would dare to undertake anything?
—Villiers de L’Isle-Adam
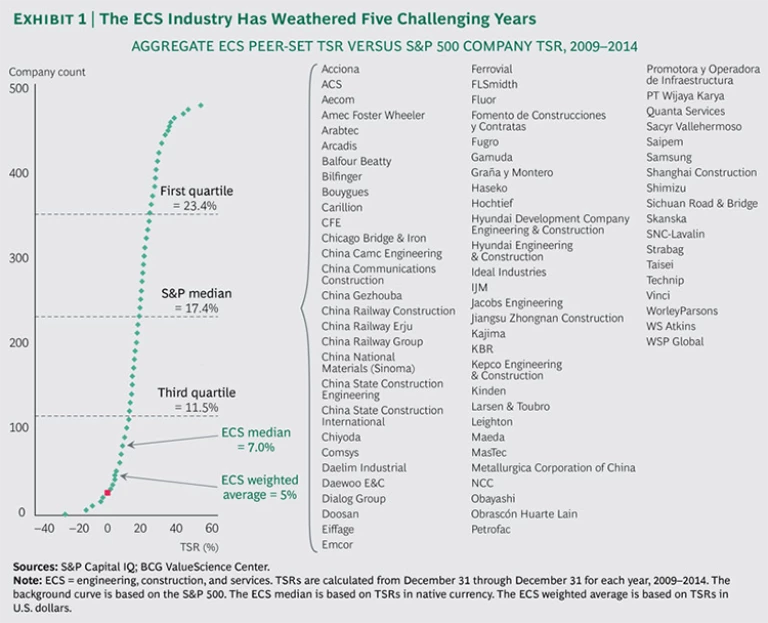
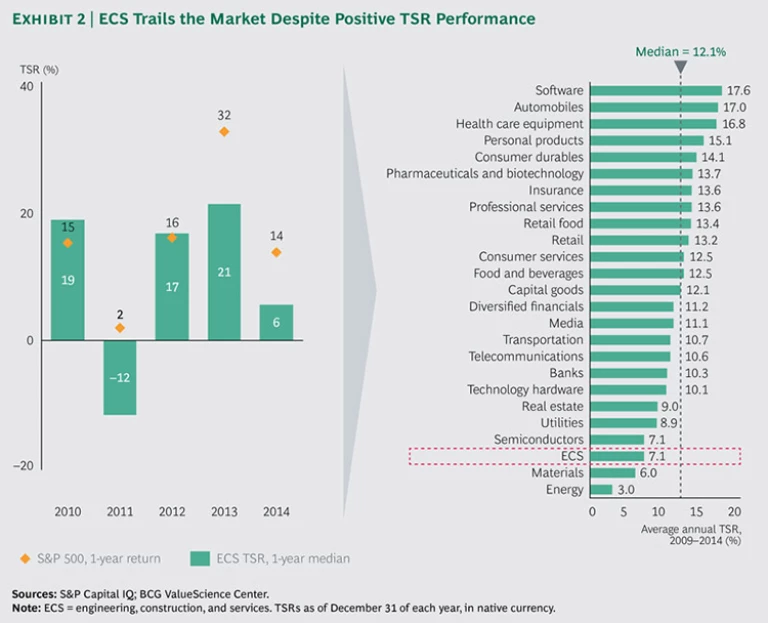
The years since the financial crisis have been a long, tough slog for the engineering, construction, and services (ECS) industry. In terms of total shareholder return (TSR), companies focused on emerging markets have fared better than their peers operating mainly in the developed world, but neither group has come close to matching the performance of the S&P 500. In the aggregate, the 75 ECS companies in our sample delivered a median TSR of 7.0 percent from 2009 through 2014, compared with the S&P 500’s median TSR of 17.4 percent during the same period. (See Exhibit 1.) And among the 25 industry sectors tracked by BCG, ECS finished ahead of only materials and energy in average annual TSR, returning 7.1 percent compared with the median annual TSR of 12.1 percent for all sectors. (See Exhibit 2.) The showing continues a run of erratic and largely subpar TSR performance for the ECS industry that started in 2009 and has continued even after the industry’s annual TSR returned to positive territory in 2012. (See “How We Calculate TSR.”)
HOW WE CALCULATE TSR
We use total shareholder return to quantify and compare our sample set’s value-creation performance. TSR, an objective measure of the value a company creates for its investors, allows for disaggregating a company’s results among multiple factors. Readers of BCG’s Value Creators series are likely familiar with the firm’s methodology for quantifying the relative contribution of the various sources of TSR. The methodology uses a combination of revenue (that is, sales) growth and margin change as an indicator of a company’s improvement in fundamental value. It then uses the change in the company’s valuation multiple to determine the impact of investor expectations on TSR. Together, the improvement in fundamental value and the change in the valuation multiple determine the change in a company’s market capitalization and the capital gain or loss to investors. Finally, the model also tracks the distribution of free cash flow to investors and debt holders in the form of dividends, share repurchases, and repayments of debt in order to determine the contribution of free-cash-flow payouts to a company’s TSR.
ECS players are operating in an environment of unprecedented competition that has upended the industry’s historical dynamics, which have favored the largest companies, especially those focused on developed markets. In today’s ECS sector, the industry’s winners are found disproportionately among smaller players that are focused on developing markets. This reversal is one result of the sharp contraction in construction spending in the developed world since the financial crisis—construction outlays in the region shrank by 1 percent from 2009 through 2014—and the concurrent rise of Chinese, Korean, and other emerging-market players in the global construction marketplace. In contrast to the downturn in the developed world, construction spending grew 4 percent in the Asia-Pacific region (excluding China), 9 percent in China, and 5 percent in Latin America. Among developed-market players, large Japanese companies, for reasons that we will explore later in this report, were the most successful at bucking the trend favoring the developing markets.
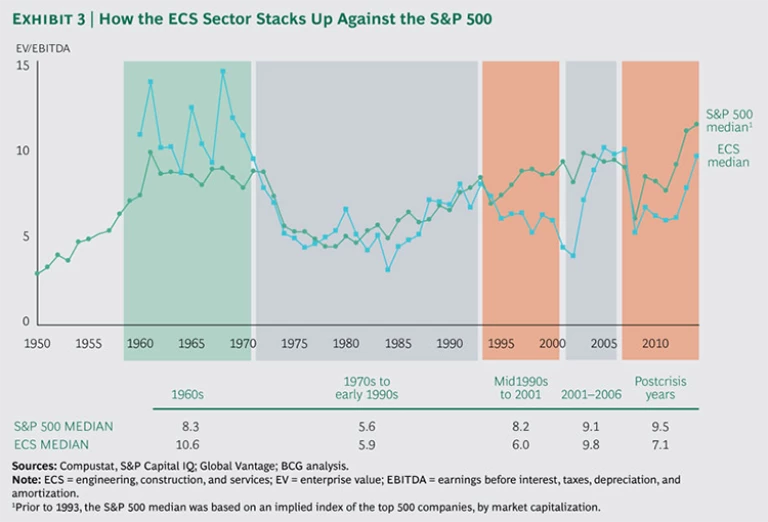
The financial crisis dealt the ECS industry a blow from which it has been slow to recover, and its median annual TSR, trailing the S&P in three of the past five years (the sector slightly outperformed the S&P 500 in 2010 and 2012), reflects that impact. This is a reversal of the years leading up to the financial crisis, when ECS valuations matched those of the S&P 500. (See Exhibit 3.) Since the crisis, the sector’s median annual TSRs have fallen close to the bottom of our industry TSR rankings. Its recovery has been far more muted than that of other sectors, and despite some improvement in the past few years, it has continued to underperform the S&P 500.
In particular, although many ECS companies joined in the run-up in the broad U.S. equity market in 2013 and 2014, when the S&P 500 posted median TSRs of 32 percent and 14 percent, respectively, ECS companies’ profit growth was sluggish, and their free cash flow contributed little to TSR. The median respective ECS TSRs for those periods were 21 percent and 6 percent. The ECS industry’s stretch of underperformance reflects the sector’s lagging fundamental performance, as well as uncertainty about its future earnings potential amid a possible prolonged slump in oil prices and concerns about the construction sector’s low productivity. (See “Solving the Construction Productivity Puzzle.”)
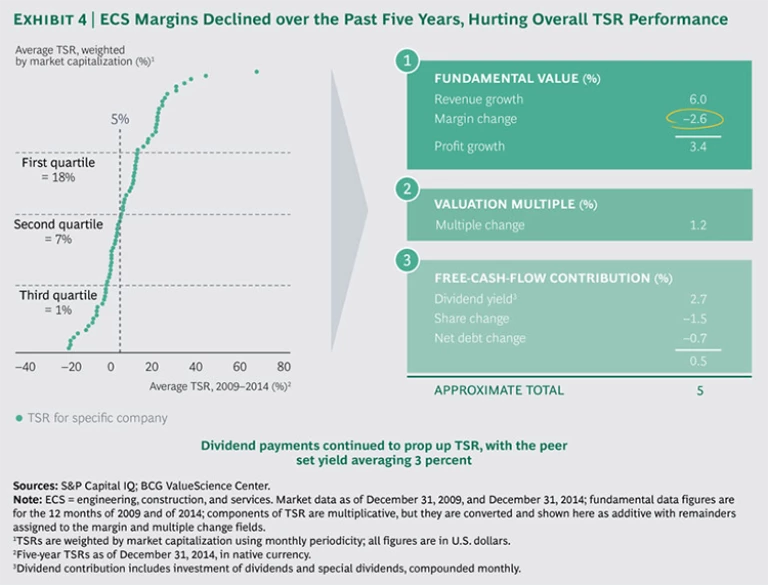
Continuing last year’s trend, dividends have propped up ECS TSRs, which would have looked far worse without the dividends’ contribution. Revenue growth has also supported TSRs to some extent, but its positive effects have been offset by significantly reduced margins, which have been declining at an annual rate of about 2.6 percent. (See Exhibit 4.) Profit growth, in other words, is not keeping pace with revenue expansion. Multiples have increased, particularly in the past two years, reflecting a mix of general market buoyancy and somewhat strengthened expectations of an improved outlook for the ECS industry. Although many companies, especially those in Japan, have focused on repaying debt and many others have steadily repurchased their shares, free cash flow has contributed only minimally to the industry’s aggregate TSR.
Changing Times Favor a New Set of Players
This year, the top quartile of ECS companies is populated by a roughly equal mix of companies focused on developed and developing markets. Six of 19 companies in the top quartile are based in Japan, and were it not for their presence, developing-market players would have outnumbered developed-market players in the top quartile by a two-to-one margin. This strong showing from Japan is unprecedented in the past 15 years. Japanese players have occasionally appeared in the top quartile, but not consistently or in large numbers. About 60 percent of the top-quartile companies operate mainly in the Asia-Pacific region, reflecting in part the preponderance of Japanese companies. The remaining emerging-market players in the top quartile, including two Mexican companies, focus on Latin America. European companies made a strong showing relative to other developed-market players, accounting for one-fifth of the top quartile and eclipsing North American companies, which are absent from the top quartile.
Categorized by business model, more than two-thirds of the top performers are in infrastructure construction, reflecting the heavy presence of Asian companies in the top quartile. WS Atkins was the only design and engineering (D&E) competitor to deliver top-quartile performance.
The top TSR performer of 2014 is PT Wijaya Karya, an Indonesian infrastructure-construction player with approximately $1 billion in 2014 revenues—a 14 percent increase from 2013, as measured in ringgit. (See Exhibit 5.) Its 2014 TSR was 65 percent, with margin growth contributing 8 percentage points to TSR.
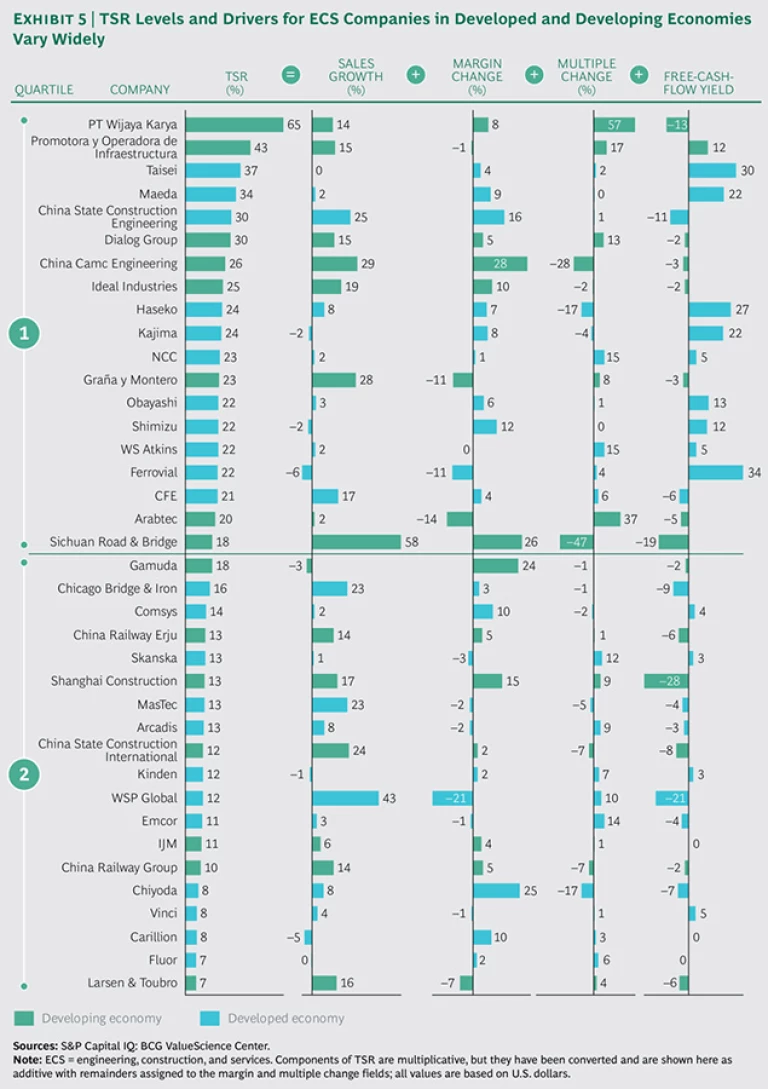
The greatest contributor to the company’s TSR, though, was its expanded valuation multiple, which posted an annual increase of 57 percentage points. Investors expect robust growth in the company’s book of government infrastructure business in 2015 and have pushed up its stock price more than 60 percent since June 2014, “making it one of the most expensive stocks in the sector from a current and historical perspective,” according to an HSBC analyst report published in January 2015. The infrastructure projects include major national undertakings, such as power plants, roads, ports, and irrigation systems.
Runner-up among the top performers was Mexico’s Promotora y Operadora de Infraestructura (PINFRA), a $513 million player that focuses mainly on toll roads but also operates a diversified construction and materials company. The construction and materials business recorded strong revenue expansion, thanks mostly to the outstanding performance of its plant and construction segments. The company also significantly reduced its heavy debt burden and refinanced much of its remaining debt at lower rates. Furthermore, the government of Mexico is expected to undertake a number of major infrastructure projects in the near term, including construction of a new airport for Mexico City. The project will benefit PINFRA, which operates important toll roads leading to the new airport and is planning to build more around the new development. The combination of the company’s improved finances and expectations of increased infrastructure spending has boosted investor confidence and spurred expansion of PINFRA’s multiple.
One of the strongest players focused on developed markets is Sweden’s NCC. Concentrating on infrastructure construction, NCC used increased dividend payouts in fiscal 2014 (and the expectation of sustained higher payouts in later years) to deliver a robust TSR. Margin improvements, a more attractive property portfolio, and a full book of domestic business have further bolstered investor confidence and increased expectations.
Among top-quartile companies, the margin contribution to TSR was about 1.2 percentage points annually, offsetting negative contributions from sales growth. By contrast, the margin contribution of the entire 75-company sample shrank by 2.6 percent annually. The top performers’ margin contribution to TSR grew almost three times as fast as the average ECS player’s, reflecting growing investor confidence in their operations. The deleveraging drive by Japanese players, which we discuss in greater detail below, skewed the overall sample’s change in net debt. There’s relatively little difference between the contribution of dividend yields to the TSRs of the top quartile and that of the rest of the sample. (See Exhibit 6.)
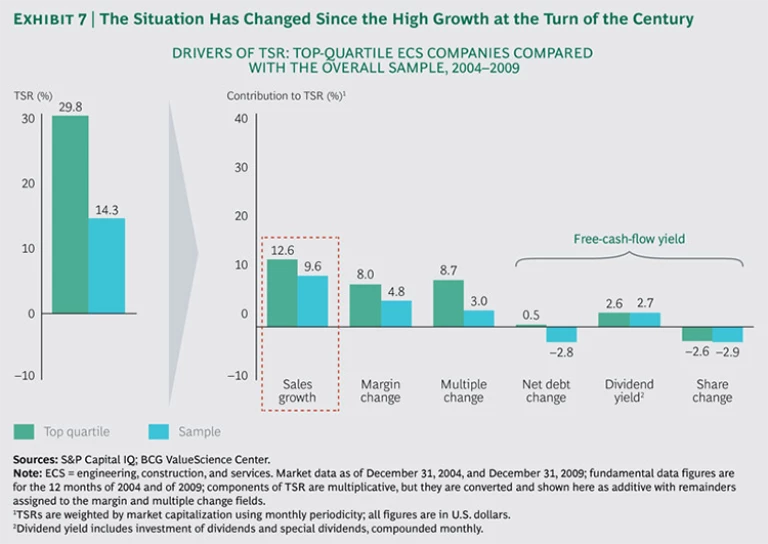
The picture that emerges from our analysis of 2014’s ECS TSR performance is very different from that of the middle years of the century’s first decade. (See Exhibit 7.) In those years, sales growth (achieved through both organic and inorganic means) coupled with margin and multiple changes was the key to increasing TSR, and dividends played a lesser role, much as they do today. And like today, high-performing organizations commanded faster multiple expansion from investors.
Three Routes to Superior TSR Performance
The top-quartile performers of 2014 followed three different routes to superior TSR performance. Japanese companies used margin improvements, cash distributions to shareholders, and aggressive debt repayment to achieve top-quartile TSRs. Top-quartile companies from the rest of the developed world (excluding Ferrovial, which we discuss in detail below) achieved their results by stemming the erosion in their margins, which in turn benefited their market multiples. Companies from the developing world, meanwhile, continued to follow the growth paradigm of the early years of this century, focusing on revenue expansion to build investor confidence and boost their valuation multiples.
As we mentioned above, the appearance of six Japanese firms in the top quartile is remarkable. In no other year since 2000 have more than two Japanese companies appeared in the top quartile. The Japanese companies in the top quartile generated their TSRs through high cash distributions to shareholders, improved margins, and favorable macroeconomic developments. These include increased infrastructure spending spurred by Prime Minister Shinzo Abe’s government stimulus programs, reconstruction following the Fukushima nuclear-plant disaster, and engineering and construction related to the 2020 Olympic Games.
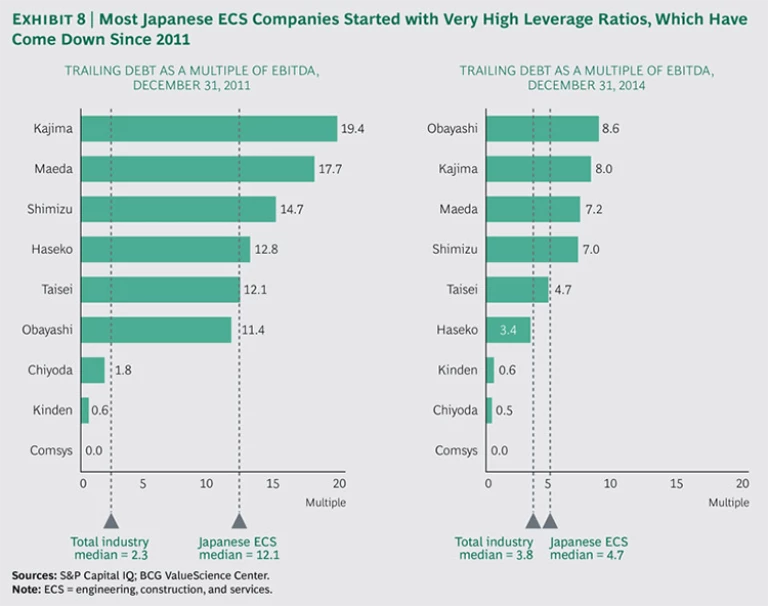
Margins improved as a result of a pivot in the Japanese companies’ business mix toward higher-margin engineering work and away from less profitable construction. Free cash flows, meanwhile, increased sharply as Japanese companies aggressively paid down debt. (See Exhibit 8.) At the end of 2011, Japanese ECS companies had extremely high leverage—12.1 times earnings before interest, taxes, depreciation, and amortization (EBITDA), compared with the industry median of 2.3 times EBITDA. As of the end of 2014, Japanese companies had slashed their debt ratio to 4.7 times EBITDA, while the industry’s median debt climbed to 3.8 times EBITA. Deleveraging, in conjunction with high margin expansion, helped produce the TSRs that changed the mix of developing- and developed-world players in the top quartile.
The other developed-market companies in the top quartile generated their TSRs mainly through margin improvements, which were rewarded with higher valuation multiples. We excluded Ferrovial, whose extremely high starting leverage ratio would have skewed the top tier’s free-cash-flow yield. By partially divesting stakes in several highly leveraged assets in 2011 to bring its ownership position below 50 percent (so that it was no longer required to consolidate the asset’s results onto its own balance sheet), Ferrovial reduced its debt burden, which in turn lifted its TSR.
For example, the sale of about 6 percent of Heathrow Airport Holdings (the operator of Heathrow, formerly known as BAA) reduced Ferrovial’s ownership to a whisker below 50 percent and removed nearly €15 billion in debt from its balance sheet. Ferrovial has recently increased its indebtedness slightly to fund a share buyback program.
In addition to reducing its debt, Ferrovial recently delivered solid operating results, reporting revenue and EBITDA growth in the high single digits. In addition, analysts expect improved performance from Ferrovial’s concession assets in the near term.
Linking Business Models to Returns
As is usually the case in ECS, business models played a meaningful role in shaping the TSRs of individual companies. We categorized each company according to its dominant model, be it D&E; process engineering, procurement, and construction (EPC); infrastructure construction; or concessionaire. In cases of companies that follow multiple models, we used our best outside-in assessment to identify the prevailing model. Exhibit 9 shows that companies following the process business model enjoyed a long run at the top of the TSR rankings in the middle years of the century’s first decade. More recently, concessionaires and infrastructure construction players have been ascendant. But as always, delivering a superior TSR is less a matter of picking the “right” business model than it is of making the right moves within that model.
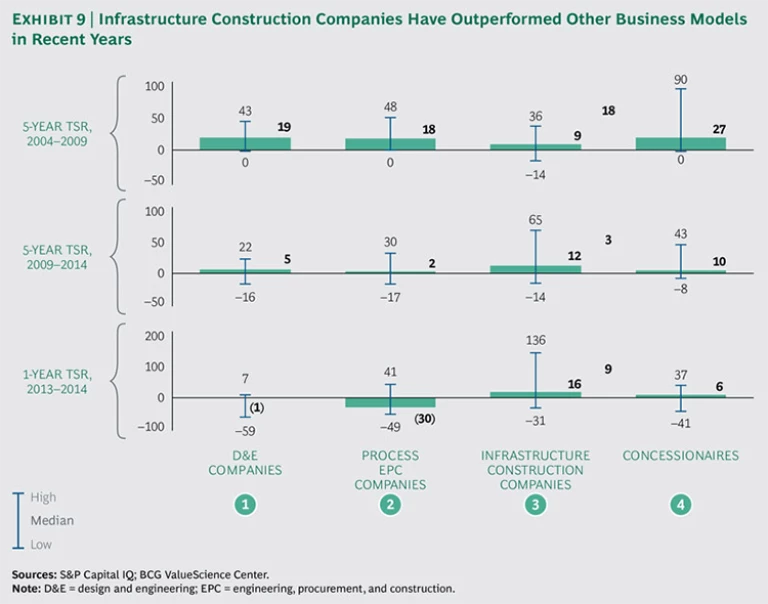
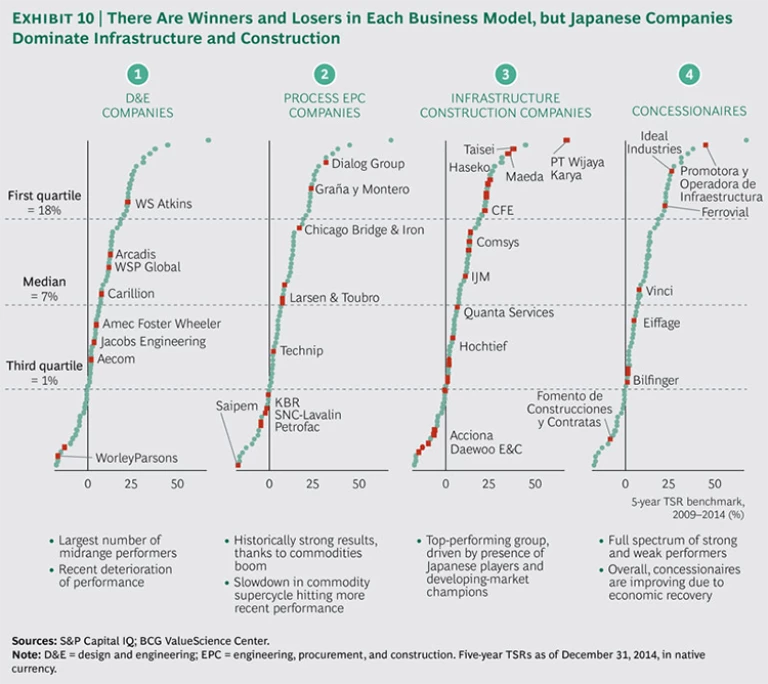
That said, companies utilizing the process-EPC business model were notable for their underperformance—in contrast to infrastructure construction players, which outperformed their peers largely thanks to the strong showing by Japanese companies. (See Exhibit 10.) Companies utilizing the D&E model underperformed as well, but they also had the narrowest range of results. That development illustrates how value has flowed out of the D&E stage of the value chain toward the lead construction bidders. But D&E players are primarily services oriented and can, therefore, react relatively fast to changes in market dynamics and can be more nimble in adjusting resources and investments as they strive to regain their historical growth trajectories. Finally, concessionaires continued to perform well, their results roughly matching those of the overall sample, after emerging as outperformers in last year’s report. Concessionaire performance tends to track GDP growth quite closely, so improved economic conditions across developed markets have had a favorable effect on their performance.
The Evolution of Deal-Making Rationales
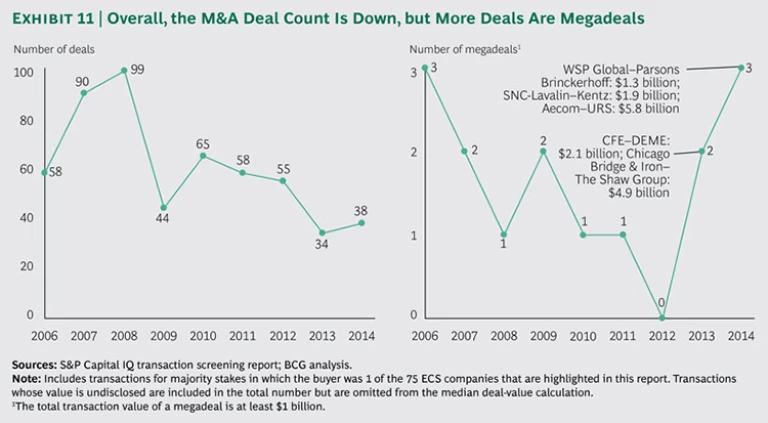
ECS companies continue to engage in substantial M&A activity. Although deal volume has not approached the level of 2008, the number of megadeals (those whose total transaction value is at least $1 billion) grew to three in 2014: WSP Global’s acquisition of Parsons Brinckerhoff, SNC-Lavalin’s purchase of Kentz, and Aecom’s deal for URS. (See Exhibit 11.) Moreover, most companies have ample dry powder—cash and borrowing capacity—at their command. The median ECS company in our sample has about $1 billion in dry powder, and many of the larger players have $5 billion or more.
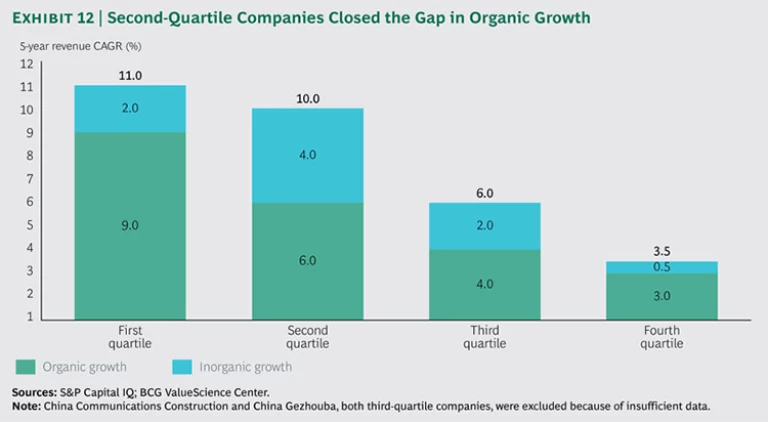
The companies in the top three quartiles of our sample added materially to growth through acquisitions. Second-quartile players were the most acquisitive and appeared to fill some of their growth gap through M&A. Third-quartile players, in contrast, reported modest organic growth. (See Exhibit 12.) It was somewhat surprising, though, that the companies that did the most deals tended to turn in subpar TSR performance, highlighting the importance of strong deal logic, disciplined deal terms, and effective integration planning and execution.
Taken together, these developments underscore how the strategies that rewarded companies during an era of strong revenue growth are ill suited to times of more constrained spending. In the precrisis era, when revenue growth was robust, serial tuck-in deals drove inorganic growth and created value. But at a time when margin and multiple growth are the main generators of TSR, tuck-in deals don’t produce the same results. In recognition of this shift, many players are opting to do fewer and larger deals that offer strategic opportunities to capture both revenue and cost synergies.
This is not to say that big deals guarantee superior TSR performance. In fact, some of the industry’s largest recent deals have not produced superior shareholder returns. Still, the recent deal history of successful ECS players, such as Chicago Bridge & Iron, shows how acquirers that focus on quantifying synergies and execute their capture skillfully and diligently have created significant value from their deal making.
Synergies Take Center Stage
Experience from recent mergers in the industry suggests that cost synergies generally are equal to 1 to 3 percent of the target’s annual revenues. Most cost synergies relate to head count reductions—particularly the consolidation and streamlining of back-office functions. (See Exhibit 13.) Integration also offers an opportunity to reduce complexity and enhance the combined organization’s accountability. Acquirers can capture additional savings by applying de-layering principles to the design of the integrated organization. Broadened managerial spans of control and reductions in the number of organizational layers can not only produce cost savings but also boost morale and result in a more effective organization overall. In addition to head count synergies, other cost synergies that acquirers should actively pursue include procurement rationalization (both direct and indirect), the consolidation of physical locations, the elimination of the acquisition target’s public-company costs, and the harmonization of processes and systems.
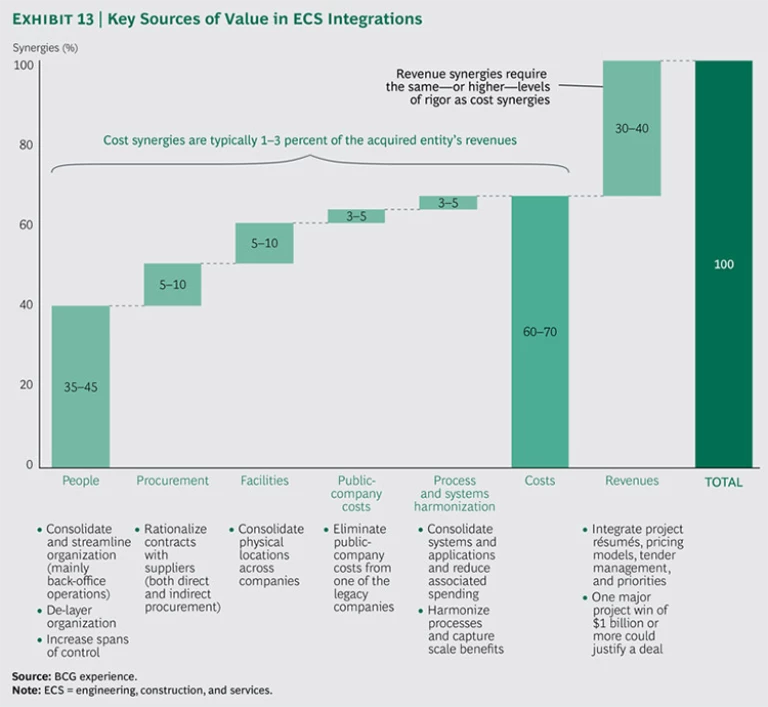
In many cases, it is easier (but by no means easy) to realize cost synergies than to achieve revenue synergies. Nonetheless, by integrating project résumés, pricing models, and tender management, companies can help land major wins that would have been out of reach prior to the acquisition. One major project win of $1 billion or more can be sufficient to justify an entire deal.
Hence, acquirers seeking revenue synergies must devote significant time and attention to the structure of the combined organization and to employee retention, culture, and communication. In a human-capital-intensive industry such as ECS, people are themselves revenue-generating assets and the key to capturing revenue synergies. This does not mean that companies should not pursue head-count-related cost synergies. Quite the opposite: the synergies should be pursued aggressively not only to justify the deal but also to reinvest the proceeds in the newly combined entity. The process for capturing these synergies, however, needs to be fair, transparent, and expeditious so that the combined company can shift its attention to winning new business and engaging and retaining key talent.
Although these remarks pertain to all ECS players, they are particularly relevant to developed-world players, which must rethink their M&A objectives. In an era when TSR performance hinges on maintaining or improving margins, revenue increases alone will not satisfy the markets, which want to see strong deal logic, effective synergy capture, and a steady focus on cost efficiency.
Three Essentials for Engaging Key Talent amid Consolidation
Organization design options raise particular questions for ECS companies, including the following:
- What is the corporate organizing principle? Should the combined company be organized by region, product line, or segment?
- Should support functions be centralized or embedded in project support?
- How should the project organization be structured? What are the reporting lines to executives? What are the reporting lines within projects?
- And last, but definitely not least, having addressed other complexities, how can the organization be optimally streamlined to improve decision making, enhance accountability, and improve morale?
These are critical questions for any integration. Failure to address them head-on jeopardizes synergy capture and raises the risk of losing key talent during the integration. (See “Redesigning for Cost and Organization Efficiency.”)
REDESIGNING FOR COST AND ORGANIZATION EFFICIENCY
With growth constrained in much of the world, the imperative for ECS leaders to improve the bottom line is stronger than ever. They need to demonstrate excellence in pricing and business intelligence, rationalize their procurement processes, fine-tune their operations, and streamline and right-size their organization setups.
In their efforts to become more cost-efficient, ECS companies face four distinct challenges. (See the exhibit below.) The first is corporate organization. Companies have to decide whether to group their main business units by region, product line, or customer segment or to use a matrix that encompasses two or more of the three categories. They must also determine which support functions should report directly to the CEO and whether business development will be centralized or left to the individual business units.
Furthermore, companies have to decide how to organize their support functions. Should the line organization be centralized at the corporate level or dispersed among the business units? And should project support costs be embedded in project costs as billable resources, or should they be covered by service-level agreements (SLAs)?
In addition, companies have to decide how to organize their projects. Should they be grouped by region or by type of work?
Hanging over all these considerations is one question: What is needed to optimally streamline the organization for better decision making, enhanced accountability, and higher morale? Companies have to make design decisions about managerial spans of control and the number of organizational layers, recognizing that these design specifications might shift, depending on whether the personnel grouping in question focuses on support or projects.
In deliberating on these questions, companies should consider whether a centralized or decentralized organization is best for striking the right balance of efficiency and effectiveness or—to put it another way—scale and speed.
The archetypal centralized organization consolidates all global support functions at the corporate level to achieve scale. Business units share resources, employ platforms to standardize engineering, and use SLAs rather than dedicated resources to support projects. Such organizations are best suited for globally active companies whose portfolios consist mostly of simple, low-margin, commoditized projects with fixed-price contracts.
The archetypal decentralized organization, by contrast, consists of nimble business units grouped by product, region, or customer segment. Rather than centralize support functions, these companies perform such work within specific projects and budget for their cost.
Decentralized organizations are best suited for complex technology projects that require high levels of specific expertise and high-margin custom projects.
In reality, most companies employ a hybrid organization model shaped by their individual histories and aspirations. Revamping the organization to vary the balance of centralized and decentralized operations can be a stiff challenge, but it can unlock significant value.
Reorganization is not an end in itself, of course. The object of the exercise is to increase business efficiency and effectiveness, and the test of an organization’s design is whether it meets those objectives. That is why de-layering management is often the right reorganizational move. Not only does it reduce overhead and costs, it also brings senior managers closer to the action, fosters more direct communication and clear accountability, improves the speed and quality of decision making, and accelerates the implementation of new solutions. Micromanagement decreases, and decision making is brought to the employee level, boosting employee motivation and engagement and creating a sense of ownership.
In our experience, de-layering an existing organization and redesigning it for efficiency and effectiveness can generate organization-wide cost savings of as much as 10 percent and, within support functions, as much as 25 percent.
Consolidating to achieve cost synergies while keeping the organization’s critical talent engaged is the key to capturing revenue synergies and enabling sustained TSR excellence. In our experience, we have seen that companies that focus on the three moves outlined below demonstrably and significantly improve the odds of successful postmerger integration and reorganization.
Linking Strategy to Organization Design. For starters, it is essential to decide on the combined corporation’s new strategy and then build the optimal organization to support execution of that strategy. All too often, companies try simply to meld two organizations together without first identifying key customers and reaching alignment on how the new organization can best serve them. As a result, multiple teams try to follow the same targets, wasting valuable resources. To avoid that pitfall, it is necessary to clarify the roles and responsibilities of the various teams and specify which group owns what parts of the business and which clients.
Rethinking the Organization to Win Megaprojects. The shift to deal logic that is oriented more toward margin presents acquirers with significant opportunities to rethink their organization structures and operating models. ECS leaders must decide how they should revamp their organizations to attack complex questions related to design-build projects, integrated delivery, and public-private partnerships. At the same time they must determine how to integrate project résumés, pricing models, tender management, and other priorities—crucial considerations when one major project win of $1 billion or more can justify a deal premium.
Designing Layer by Layer, Starting from the Top. In the integration and reorganization process, it is just as important to choose, deploy, and empower the right leaders for building support and trust within the organization. The organization should be designed from the top down, starting with the office of the CEO and continuing through each management layer, with managers in each layer choosing their direct reports. This procedure ensures that management will be able to identify and approach top talent much more easily and build the optimal organization.
We cannot stress enough the importance of initiating reorganization efforts before the deal has closed. It is always easier for an organization to act from a position of strength than to react from a position of perceived weakness, which has a profound impact on talent retention.
The Oil Price Collapse: A Long-Term Challenge
The 60 percent fall in oil prices during the second half of 2014 has affected ECS companies, but the implications of the collapse are still coming into focus. The price drop was the result of the emergence of an oversupply of roughly 1 million barrels per day. The global liquids supply grew by 2 million barrels per day from 2013 through 2014, with important contributions from Libya, Iraq, and the U.S., which has dramatically stepped up shale oil extraction. Simultaneously, demand growth slowed to 900,000 barrels per day as weak demand from China—the source of 40 percent of demand growth during the past ten years—and slow-growing European economies sent prices into a tailspin.
Producers Lose, Consumers Win
The price collapse has presented producers with a vexing quandary. To make money over the long term, producers need oil prices in the range of $75 to $100 per barrel, and it’s not at all clear how and when prices will rebound to that level from their current range of $60 to $70 per barrel. For now, producers must cope with sharply lower revenues and limited access to new financing. As a result, they are cutting their expected capital spending by an estimated 20 percent in 2015 and delaying energy-related investments or changing their mix. This pressure could lead ECS companies that serve the oil and gas sector to sell noncore assets and outsource noncore activities, which might open up new opportunities for investors and service providers.
At the national level, the countries that are heavily dependent on oil industry revenues to fund their budgets are girding for imminent recession: they are cutting spending and delaying major projects—including construction and infrastructure. This slowdown will affect not only oil-producing countries in the Middle East but also the regional economies of more economically diversified countries, such as Australia, Canada, and the U.S.
Conditions for oil consumers wll likely become more favorable. Oil importers will benefit as lower oil prices lead to stronger GDP growth. Similarly, demand for infrastructure will probably increase, thanks to enhanced productivity across the broad economy. The energy-intensive manufacturing sector should also benefit through sharp reductions in the cost of a key input.
A Mixed Message for ECS Companies
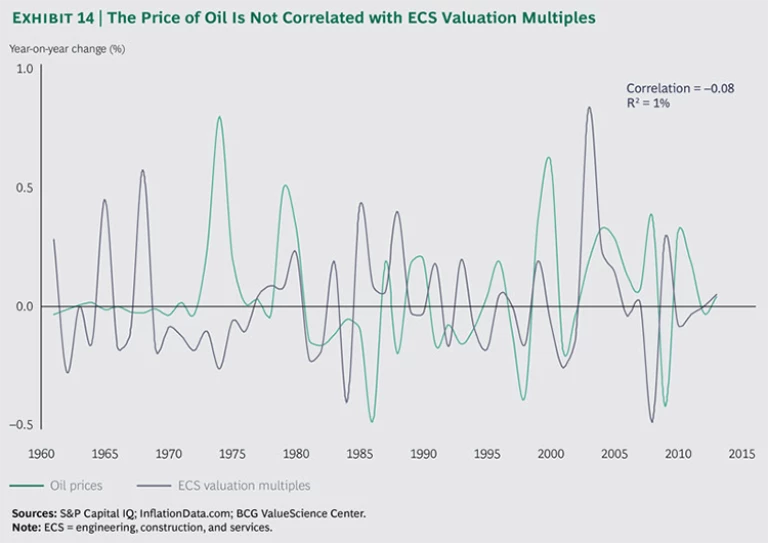
In the aggregate, the price of oil has little correlation with ECS valuations. (See Exhibit 14.) But the effects of the oil price slump on ECS players vary according to the mix of their backlog projects and their sector focus and expertise. As the decades-long mineral-extraction supercycle slows and growth in oil and gas and mining construction stalls, ECS players with heavy exposure in the energy sector will come under severe pressure. Lower resource prices equal fewer power plants, refineries, oil platforms, and mines—to the detriment of energy-focused ECS companies. The CAGR for oil and gas construction was 18 percent from 2004 through 2008 and 10 percent from 2009 through 2014. We expect that rate to slow to 4 percent from 2015 through 2019.
By contrast, the positive impact of lower prices for oil-importing countries, consumers, and energy-intensive manufacturing will fuel growth in infrastructure demand and spending. ECS companies, as well as infrastructure investors and operators, are well positioned to benefit from a prolonged period of low oil prices.
The price downturn will also likely spur increased industry consolidation—and hence M&A—as companies build scale and attempt to diversify their order books away from oil and gas projects and into new growth segments, such as infrastructure.
Conclusions and Recommendations
It’s plain that the turbulence that has buffeted the ECS industry since the onset of the financial crisis has not abated. To the contrary, the industry—and, indeed, the broader economy—may be entering a new period of volatility. ECS companies will be hard-pressed to sustain strong TSR performance, but there are concrete ways to tilt the odds in their favor.
The Six Pillars of Sustainably Superior TSRs
We believe that in the years ahead, the TSRs of the industry’s top performers—those that deliver not simply growth but profitable growth—will rest on six pillars. The companies that rank consistently high will be those with demonstrated abilities to do the following:
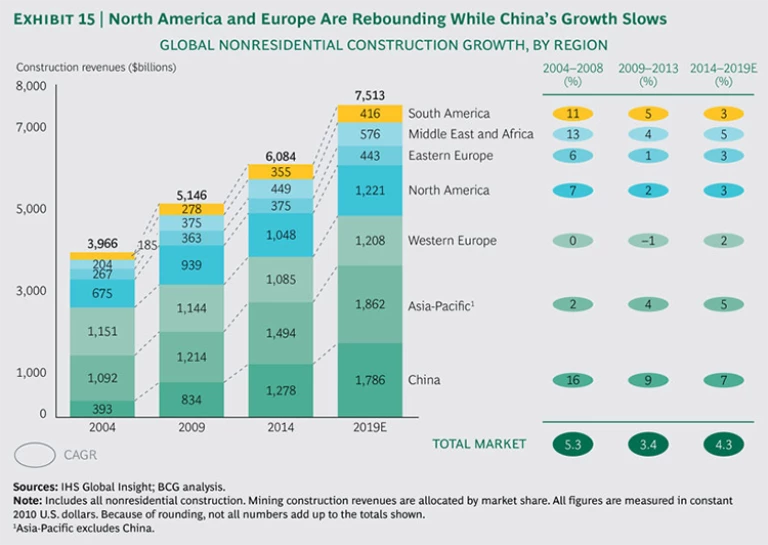
- Gain access to and win contracts in regions with positive tailwinds. Developed markets are staging a comeback, but emerging markets still post the highest growth rates and will continue to do so. (See Exhibit 15.) ECS companies must therefore strike a balance. While maintaining strong positions in their home markets, where their strong relationships with customers and partners give them an edge and a “right to win,” they must also cultivate access to markets with positive growth tailwinds. Cultivating that access is a difficult and delicate task, however. International projects demand the appropriate entry and partnering strategies and must be done at scale. As we have pointed out before, fragmented global players underperform rather than benefit from their international positions.
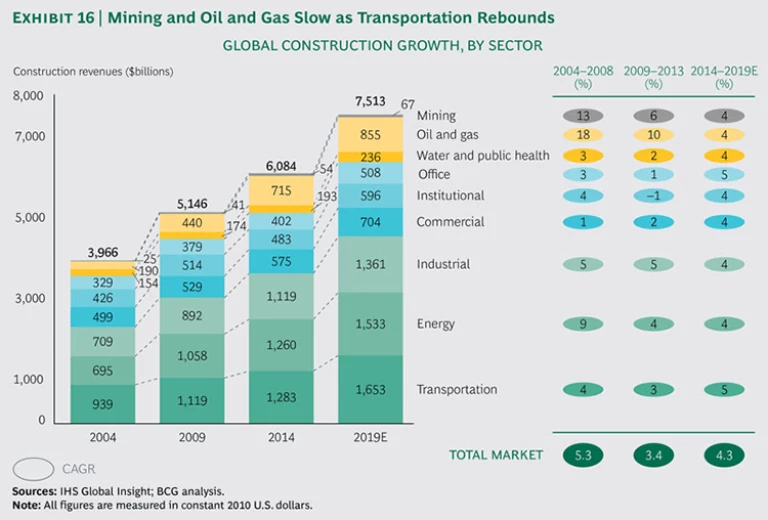
- Cultivate the right mix of projects and competitive differentiation in targeted sectors. With sizable segments of the ECS market posting little—or even negative—growth, companies must be careful in picking their projects. They must focus on projects for which they have technical competency, strong résumés, ability to attain scale, and the capacity to add unique value to design-build teams. They will benefit from being smart and selective in sectors with strong growth tailwinds. (See Exhibit 16.) Spending on resource-related projects such as mines and oil and gas extraction has slowed, and a moderate rebound in commercial projects and transportation infrastructure has not picked up all the slack. So it’s more important than ever before to evaluate competitive advantage and the ability to generate profits in each region, sector, and project type within the portfolio.
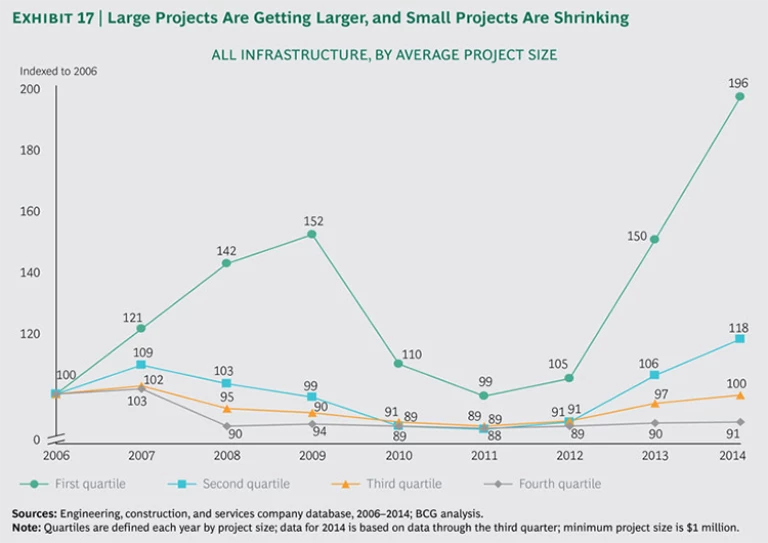
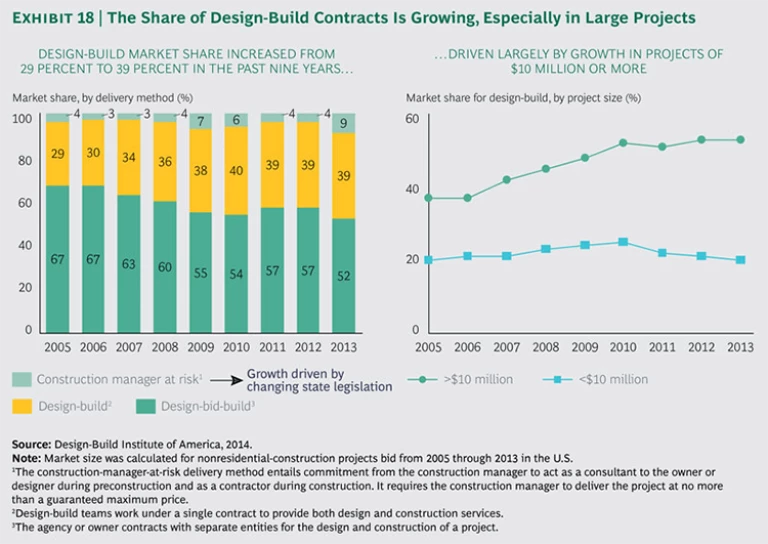
- Attain scale to win megaprojects and design-build contracts. Large projects are getting larger. (See Exhibit 17.) Similarly, the share of design-build contracts is increasing, particularly in large projects in which the share has increased from 37 percent to 53 percent in less than a decade. (See Exhibit 18.) To succeed in this environment, ECS companies need the experience and global footprints that win contracts for megaprojects, as well as well-chosen partnerships that allow them to close capability gaps where they appear.
- Build scale and skills through acquisitions. M&A is still an important engine of TSR performance among developed-world players. The scale that M&A affords offers ECS players several benefits, including technical breadth and depth; the ability to mobilize resources quickly; the financial strength and flexibility to take on large, risky, fixed-price projects; execution excellence; and economies of scale. But M&A won’t work as planned without a strong focus on risk management, synergy capture, and professional talent management and retention.
- Redesign operations for cost and organizational efficiency. Profitability counts far more than ever before in ECS, and winning companies will boast a combination of excellence in pricing (and hence business intelligence), procurement, and operational effectiveness. Organizations must be leaner and optimize their setups, place top talent in key roles, focus their resources on the most profitable market segments, and emphasize operational excellence.
- Build the optimal project portfolio that balances risk, return, and volatility across cycles and regions and suits the player’s own needs, strengths, and weaknesses. From the middle through the end of 2014, the price of oil fell 60 percent, and it shows little sign of rebounding anytime soon. Slowing demand from the developing world, especially China, has also crimped the prices of many other commodities, especially minerals. This development will have major ripple effects across the global economy and require ECS companies to make significant adjustments. Players need to make sure that their portfolio can withstand such shocks and ensure long-term sustainability and growth.
Closing Thoughts
Competition in the ECS industry continues to intensify as developing-world players continue to expand their technical capabilities and sophistication and the largest developed-world players grow larger and hone their ability to compete in more regions and sectors. Compared with industries such as automobile manufacturing, in which four giant OEMs dominate the market, or soft drinks, in which Coca-Cola and PepsiCo rule the roost, ECS remains highly fragmented and in the early stages of globalization. We expect the market to continue to organize itself—not without a degree of irrationality and volatility—for the foreseeable future.
How should ECS companies negotiate this uncertain and uneven terrain? There is no right answer. Or rather, the right answer depends on each company’s starting point, competitive environment, and strategic aspirations. All that is clear for ECS companies is that their long, tough slog will grow no easier anytime soon.
Acknowledgments
The authors wish to acknowledge the contributions of Win Chia, Hady Farag, Mikko Fischer, Dan Lau, David Taube, Lukas Wickart, and Christine Wurzbacher.


