

The growth share matrix—put forth by the founder of BCG, Bruce Henderson, in 1970—remains a powerful tool for managing strategic experimentation amid rapid, unpredictable change.

How Does the Growth Share Matrix Work?
The growth share matrix was built on the logic that market leadership results in sustainable superior returns. Ultimately, the market leader obtains a self-reinforcing cost advantage that competitors find difficult to replicate. These high growth rates then signal which markets have the most growth potential.
The matrix reveals two factors that companies should consider when deciding where to invest—company competitiveness, and market attractiveness—with relative market share and growth rate as the underlying drivers of these factors.
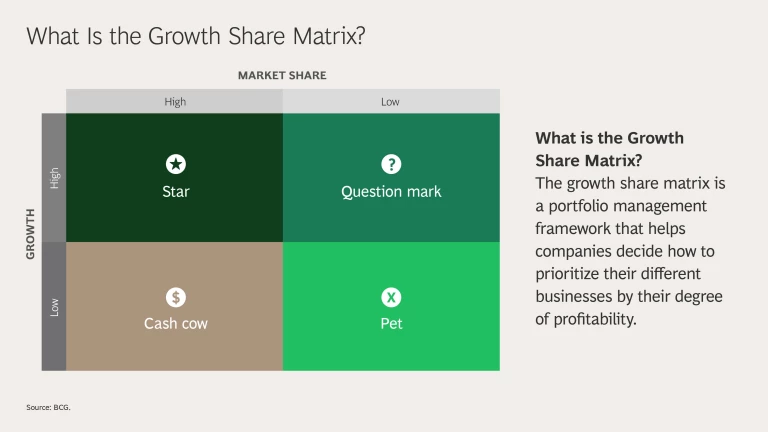
Each of the four quadrants represents a specific combination of relative market share, and growth:
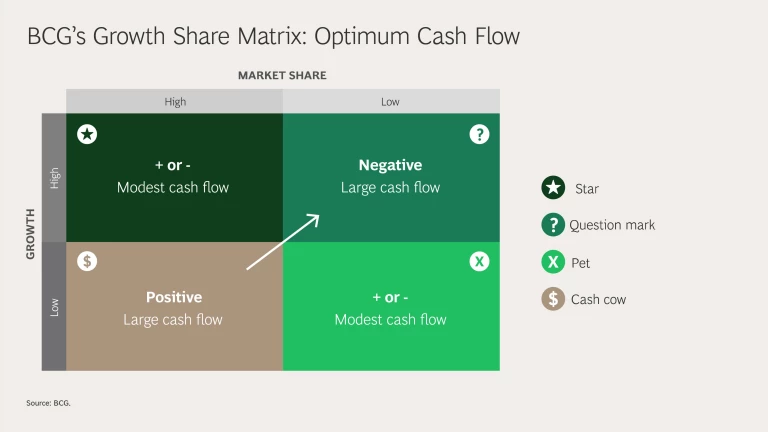
- Low Growth, High Share. Companies should milk these “cash cows” for cash to reinvest.
- High Growth, High Share. Companies should significantly invest in these “stars” as they have high future potential.
- High Growth, Low Share. Companies should invest in or discard these “question marks,” depending on their chances of becoming stars.
- Low Share, Low Growth. Companies should liquidate, divest, or reposition these “pets.”
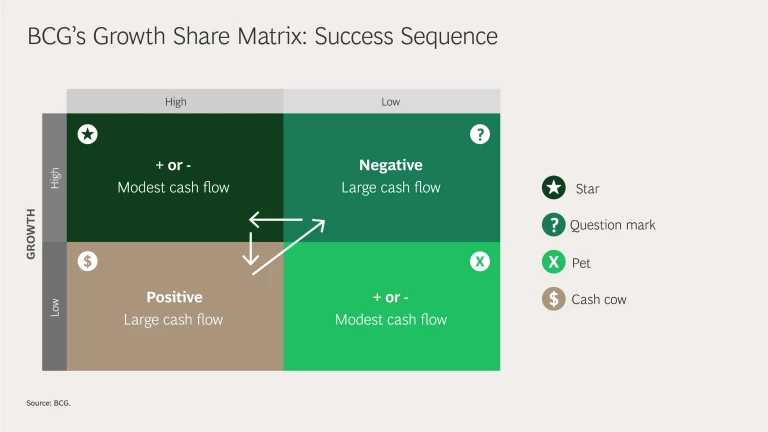
As can be seen, product value depends entirely on whether or not a company is able to obtain a leading share of its market before growth slows. All products will eventually become either cash cows or pets. Pets are unnecessary; they are evidence of failure to either obtain a leadership position or to get out and cut the losses.
Learn More About the Growth Share Matrix

Article
October 24, 2014
BCG’s Sandy Moose explains why this concept is still relevant and how it can be adapted to current business conditions. Watch the video.

Business Strategy
From building the ideal product portfolio to the rule of three and four, explore more than 50 years of BCG business strategy classics.


