Note: Originally released in June 2015, this report has been updated to reflect both a revision of input sources for private wealth assets and the addition of 30 countries to our database, which now covers markets representing more than 99 percent of global GDP.
The wealth management industry has arrived at an inflection point. While one group of players seems to be guarding the status quo, another group is seizing the moment. These proactive institutions are doing more than their competitors to raise their game in ways that will ensure profitability and market-leading positions over the next five years and beyond.
Given the current market dynamics, we have placed special emphasis in this year’s Global Wealth report on what the most successful players in today’s wealth-management industry are doing right. Using data gathered from benchmarking studies carried out over the past three years, we have identified those organizations whose performance has consistently surpassed that of their peers. For example, although robust asset performance drove growth for most players in 2014, some institutions were able to gain higher revenues per relationship manager, acquire greater amounts of new assets, and achieve leading revenue and cost margins. What drives such significant differences?
On the basis of both our benchmarking and our extensive experience working with wealth managers globally, we have observed five common characteristics that winning organizations possess, which we will discuss in detail:
- Segment-specific value propositions and coverage models
- Rigorous price realization in target client segments
- A differentiated advisory offering
- A focus on front-office excellence
- The ability to measure and manage profitability
This year’s report also contains some of our traditional features—particularly a comprehensive, global market-sizing that includes regional breakdowns—and for the first time pays special attention to the investments that wealth managers are making in their own businesses in their quest to achieve excellence and stay ahead of their rivals. Are most institutions focusing on strengthening existing businesses—or on discovering new horizons to explore? Are they more concerned with the next 12 months or the next two to five years? The answers to such questions will help determine who the winners will be in the run-up to 2020.
Overall, the journey to achieving consistent success remains a difficult one. The traditional challenges are still there: how to attract new assets, generate new revenues, manage costs, maximize IT capabilities, find investment strategies that foster client loyalty, and navigate a complex and ever-evolving regulatory environment. There are many fresh challenges as well, including raising digital capabilities and coping with potentially disruptive new business models. There are no easy solutions—but successful, proactive players are finding the right balance.
Our goal in Winning the Growth Game: Global Wealth 2015, which is The Boston Consulting Group’s fifteenth annual report on the global wealth-management industry, is to present a clear and complete portrait of the business, as well as to offer thought-provoking analysis of issues that will affect all types of players as they pursue their growth and profitability ambitions in the years to come.
Read more on this topic
Global Wealth 2015
- Winning the Growth Game
- Five Keys to Consistent Success in Wealth Management
- How Wealth Managers Invest in Themselves
Global Wealth Markets: The Growth Continues
Global
Global and Regional Overview
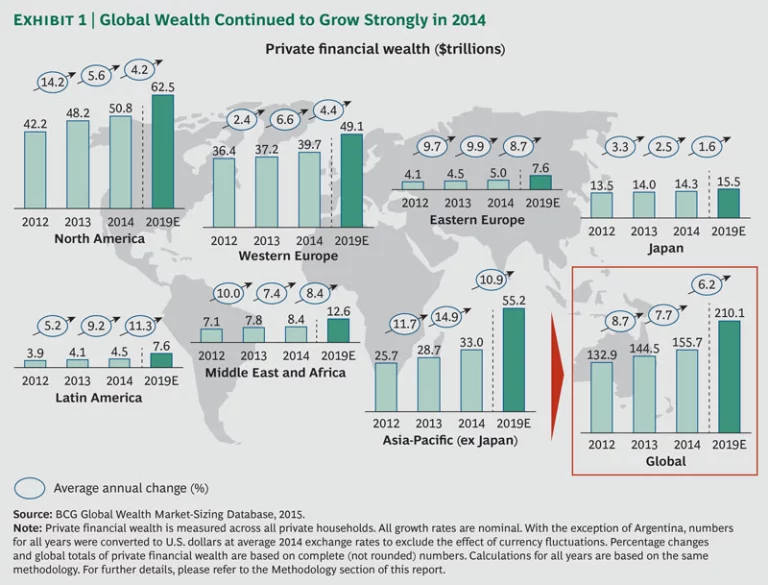
North America, with $51 trillion in private wealth, remained the world’s wealthiest region in 2014. Western Europe, with $40 trillion, maintained its status as the second-wealthiest region, with Asia-Pacific (excluding Japan) in third place at $33 trillion. With a projected $55 trillion in 2019, Asia-Pacific (excluding Japan) is expected to surpass Western Europe (a projected $49 trillion) and to close in on North America (a projected $62 trillion). The share of global financial wealth held in Asia-Pacific (excluding Japan) is projected to increase from 21 percent in 2014 to 26 percent in 2019. (See Exhibit 2.)
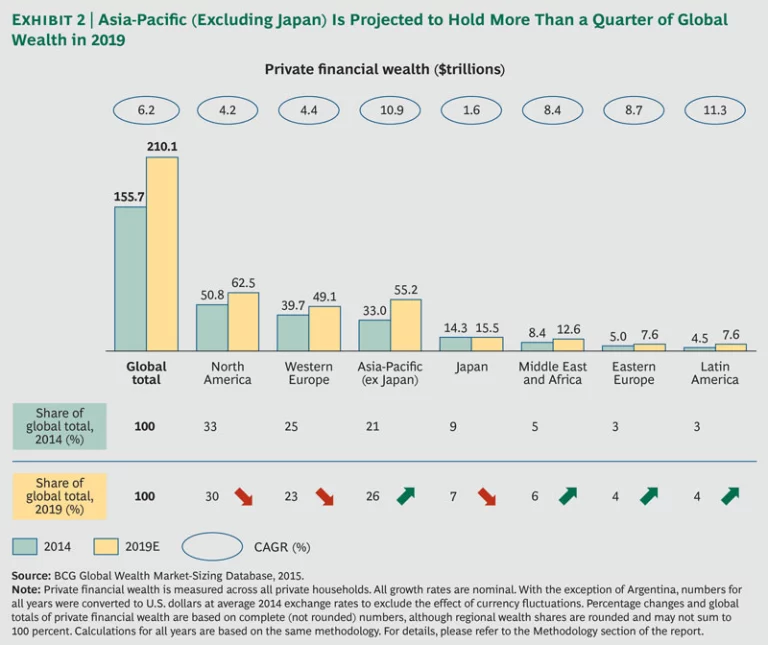
Over the next five years, total private wealth globally is projected to post a compound annual growth rate (CAGR) of 6 percent to reach an estimated $210 trillion in 2019.
From a regional perspective, it’s clear that the growth of private wealth continued in most markets in 2014, but at significantly different rates. A strong “old world” versus “new world” dynamic was observed, with the new world growing at a far more rapid pace. Asia-Pacific (excluding Japan) remained the fastest-growing region in 2014 and the only region to grow by double digits (15 percent). The other regions of the new world—Eastern Europe, Latin America, and the Middle East and Africa—grew in the high single digits. By contrast, growth rates in all “old world” regions remained in the middle or low single digits, led by Western Europe and North America (with Japan lagging somewhat behind).
North America
Western Europe
Eastern Europe
Asia-Pacific (excluding Japan)
Japan. Japan’s private wealth achieved comparatively low growth of less than 3 percent in 2014 to reach just over $14 trillion. With a projected CAGR of under 2 percent, the lowest of all regions, private wealth in Japan will reach an estimated $15 trillion in 2019, well behind North America, Asia-Pacific (excluding Japan), and Western Europe.
Latin America
Middle East and Africa (MEA)
Principal Drivers of Wealth Growth
Globally, more than half ($6 trillion, or 56 percent) of private wealth growth in 2014 was generated by the market performance of existing assets, with the balance ($5 trillion, or 44 percent) generated by newly created wealth. (See Exhibit 3.) Asia-Pacific (excluding Japan), the MEA region, Latin America, and North America saw significant rises in equities, while Eastern Europe and Latin America experienced double-digit growth in bonds. Extraordinary market gains were seen in China and India, driven mainly by investments in local equities.
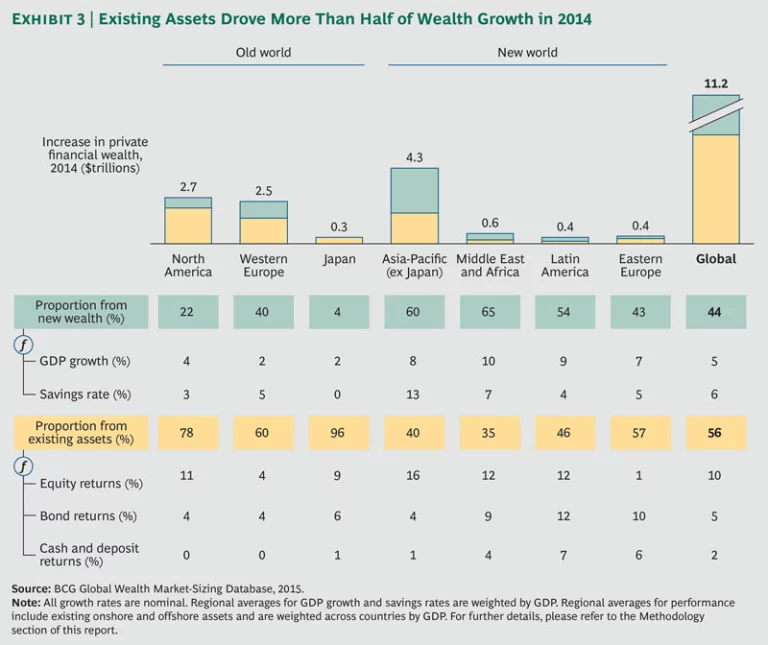
Newly created wealth dominated in “new world” regions, where macroeconomic performance tended to be significantly stronger than in the old world, continuing the trend of recent years. For example, GDP growth in Western European countries was low—2 percent on average, with Ireland the top performer at 6 percent—as questions about the future of Greece lingered and signs of economic recovery in countries such as Italy and Spain remained weak. By contrast, Eastern European countries and other new-world nations posted strong upper-single-digit or even double-digit GDP growth.
In the years ahead, solid market performance across all regions—combined with robust GDP growth and high savings rates in the new world, especially in Asia-Pacific (excluding Japan)—will continue to drive the expansion of global wealth. A more detailed regional review follows.
North America. Driven by solid equity-market performance, the growth of existing North American private wealth was substantial, accounting for 78 percent of the region’s overall growth in 2014. The remaining 22 percent can be attributed to the region’s GDP growth (4 percent), which helped to create new wealth. In the U.S., growth came more from equities (which rose by 10 percent) than from other asset classes. By comparison, the increase in Canadian private wealth was driven by strong gains in both equities (15 percent) and bonds (11 percent).
Western Europe. The expansion in Western European private wealth was supported mainly by modest gains in bonds, driven in part by the European Central Bank’s revised monetary policy. Macroeconomic performance was generally low, although countries outside the euro zone showed moderate rises in GDP, including the U.K. (5 percent), Norway (3 percent), and Switzerland (2 percent). Within the euro zone, GDP growth was generally slower. Most countries in Western Europe saw appreciable equity-market performance, such as Denmark (12 percent) and Italy (11 percent). Two countries that endured substantial difficulties in 2013, Spain and Portugal, saw private wealth rebound in 2014 with growth of 4 percent, driven largely by a rising bond market (up 6 percent in Spain and 5 percent in Portugal). Growth in private wealth was strong in countries with a relatively high share of bonds, such as Denmark (wealth growth of 10 percent, bond share of 45 percent) and Italy (wealth growth of 6 percent, bond share of 48 percent).
Eastern Europe. Growth in Eastern Europe was driven mainly by Russia, which holds more than one-third of the region’s private wealth. Institutional and business reforms in Eastern Europe, overall GDP growth of 7 percent, and bond returns of 10 percent all contributed to the region’s overall increase in private wealth of nearly 10 percent. Across all Eastern European countries, as in Western Europe, wealth held in bonds performed more robustly (10 percent) than that held in equities (1 percent) or in cash and deposits (6 percent).
Asia-Pacific (excluding Japan). Private-wealth growth in this region was driven heavily by the continued economic expansion of two of its largest economies, China and India. Overall, solid economic output across the region enabled the population to accumulate significant amounts of new wealth, which accounted for 60 percent of total wealth growth, compared with 40 percent from market performance. Private wealth was also lifted by equity market performance (up 16 percent), followed by bond markets (4 percent) and cash and deposits (1 percent).
Japan. In light of the weakening yen (down 8 percent in 2014 against the U.S. dollar, following a decline of 18 percent in 2013), growth in private wealth in dollar terms was lower than in previous years. That said, the weaker yen continued to support the Japanese export sector, leading to an increase in GDP growth to 2 percent in 2014 (up from 1 percent in both 2012 and 2013). Japanese stock markets rose by 9 percent in 2014, while the bond market grew by 6 percent. With only 4 percent of wealth growth originating from newly created wealth, Japan is relying far more on the market performance of existing assets than are most other countries.
Latin America. Growth dynamics in Latin America’s economies were divergent, with varying impacts from lower oil and commodity prices depending on importing versus exporting behavior. Private wealth in Mexico and Brazil, the region’s largest economies, as well as in Chile and Colombia, showed strong growth in 2014, while wealth developed more moderately in some of the smaller markets. Mexico’s double-digit expansion was driven especially by the performance of wealth held in bonds and in equities (both 7 percent), as well as in part by solid GDP growth (6 percent). Brazil’s private-wealth expansion was driven mainly by improved performance in bonds (up 9 percent) in a country in which 46 percent of private wealth was held in bonds. The overall region’s bond and equity markets both rose by 12 percent, with the value of cash and deposits rising by 7 percent. Relative to other regions, Latin America had the third-highest proportion of newly created wealth (54 percent) in 2014, compared with a global average of 44 percent.
Middle East and Africa. The MEA region had the highest proportion of newly created wealth (65 percent), with the balance attributable to the market performance of existing assets. Solid savings rates and continued GDP rises in oil-rich countries such as Saudi Arabia (GDP growth of 11 percent), Kuwait (11 percent), Nigeria (11 percent), and the United Arab Emirates (11 percent) contributed to the newly created wealth, while existing asset performance was solid despite the region’s political instability.
Overall, across all regions, the drivers of wealth growth will have significant implications for wealth managers in the years ahead. For example, to capture newly created wealth that is driven mainly by GDP growth and savings rates, wealth managers must strengthen their asset-gathering and client acquisition capabilities through differentiated offerings, tailoring them to specific regions and client segments. To maximize the performance of existing assets, the focus will be on more creative investment strategies and product offerings, also customized by region and client segment. Moreover, following the high currency fluctuations in 2014, currency exposure will be a key consideration for future investment strategies.
Wealth Distribution
Private wealth held by ultra-high-net-worth (UHNW) households (those with above $100 million) grew by a strong 11 percent in 2014. Overall growth in this segment was driven primarily by households from lower wealth segments moving up, while average wealth per household decreased (by nearly 8 percent).
UHNW households held more than $10 trillion (about 7 percent) of global private wealth in 2014, a slight increase over 2013, and will be the fastest-growing segment through 2019. (See Exhibit 4.) At a projected CAGR of just over 14 percent over the next five years, private wealth held by the UHNW segment will grow to an estimated $20 trillion in 2019, with the number of UHNW households projected to grow at a CAGR of 21 percent. With such a large number of households entering this segment, the average wealth per household is projected to decline at a CAGR of 2 percent.
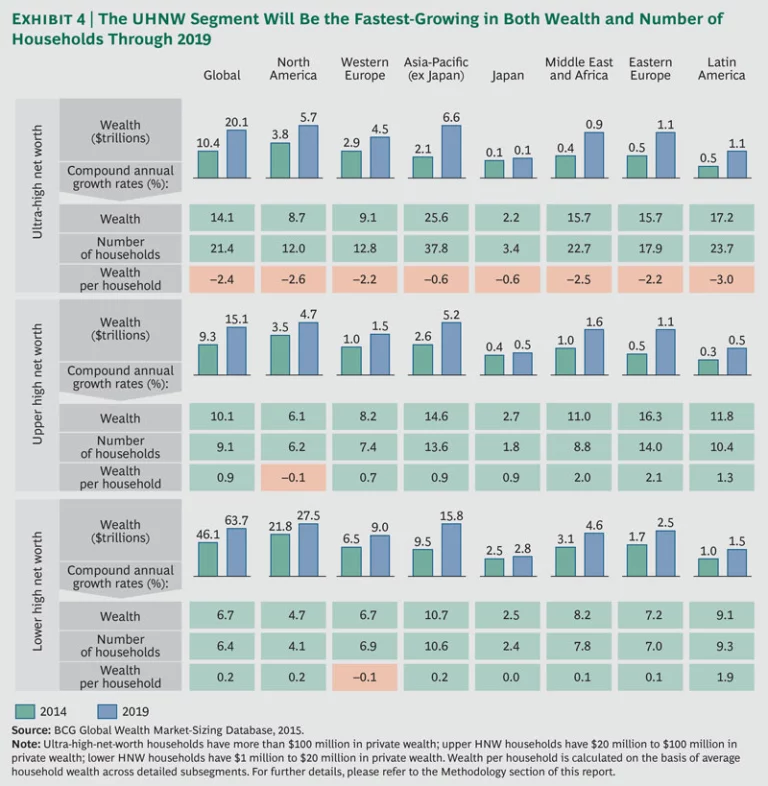
Private wealth held by the upper high-net-worth (HNW) segment (those with between $20 million and $100 million) rose by a healthy 23 percent in 2014 to more than $9 trillion. With a projected CAGR of 10 percent over the next five years, this segment is expected to surpass $15 trillion in private wealth in 2019. This growth will be triggered by both a large number of new households entering the segment (a projected CAGR of 9 percent) and growth in average wealth per household (a CAGR of 1 percent).
Private wealth held by the lower HNW segment (those with between $1 million and $20 million) is expected to grow at a slightly lower rate (7 percent) over the next five years. Average wealth per household is expected to post only very modest increases.
Globally, the total number of millionaire households (those with more than $1 million in private wealth) reached nearly 16.5 million in 2014, up from 15 million in 2013. The increase was driven primarily by the solid market performance of existing assets, in both the new and old worlds. Millionaire households held 42 percent of global private wealth in 2014, up from 41 percent a year earlier, and are projected to hold more than 47 percent of global private wealth in 2019.
From a regional perspective, the U.S. still had the highest number of millionaire households in 2014 (7 million), followed by China (2 million) and Japan (1 million). The highest density of millionaires was in Switzerland, where 135 out of every 1,000 households had private wealth greater than $1 million, followed by Bahrain (123), Luxembourg (120), Qatar (116), Singapore (107), Kuwait (99), and Hong Kong (94). The U.S. remained the country with the largest number of UHNW households at 5,201, followed by China (1,037), the U.K. (1,019), India (928), and Germany (679). The highest density of UHNW households was found in Hong Kong (15.3 per 100,000 households), followed by Singapore (14.3), Austria (12.0), Switzerland (9.0), and Qatar (8.6).
In the old world, the UHNW segment (and especially billionaires) is expected to witness the highest growth in number of households by 2019—an estimated 13 percent annually in Western Europe and 12 percent in North America (nearly twice as fast as the upper HNW segment in those regions). The picture remains similar in most parts of the new world, with the exception of Eastern Europe, where the upper HNW segment is expected to grow at a strong pace in terms of number of households (14 percent annually) relative to the UHNW segment (18 percent annually). The projected growth of these segments presents a significant opportunity for wealth managers around the world.
The Asset Allocation Perspective
Globally, the largest chunk of private wealth (45 percent) remained invested in cash and deposits in 2014. Wealth invested in equities shows a rising trend—from 30 percent in 2009 to an estimated 38 percent in 2019—driven both by solid equity returns and by increasing asset allocations in equities.
Asset allocation varies markedly by segment. While the UHNW and lower HNW segments held more than a third of their private wealth in equities in 2014 (43 percent and 36 percent, respectively), the upper HNW segment held just 24 percent, with a higher proportion of cash and deposits (60 percent versus an average of 42 percent for the two other segments). The upper HNW segment may therefore represent an opportunity for more intensive wealth-management activities.
From a regional viewpoint, the share of private wealth held in equities was highest in North America (49 percent in 2014), followed by Japan (34 percent), Western Europe (33 percent), Asia-Pacific (28 percent, excluding Japan), and MEA (26 percent). Eastern Europe (19 percent) and Latin America (13 percent) had lower equity allocations.
The share of private wealth held in bonds was highest in Latin America (35 percent), followed by Western Europe (27 percent), MEA (24 percent), North America (19 percent), Eastern Europe (16 percent), Asia-Pacific (12 percent, excluding Japan), and Japan (7 percent).
Looking ahead, our projections suggest that past overall trends in asset allocation will continue, allowing for an increasing share in the amount of wealth invested in equities through 2019.
The Offshore Perspective
Globally, private wealth booked in offshore centers grew by 7 percent in 2014 (compared with 8 percent for onshore wealth) to reach $11 trillion. The overall $0.7 trillion rise was driven mainly by asset flows originating in Asia-Pacific ($0.3 trillion, excluding Japan), Eastern Europe ($0.2 trillion), and MEA ($0.2 trillion). The 2014 growth rate for offshore wealth was in line with the 7 percent rise posted in 2013, but with increased amounts of offshore wealth flowing back onshore, particularly in the old world. However, the global share of wealth held offshore remained fairly stable in 2014 (at 7 percent of total global wealth).
Looking ahead, offshore wealth is projected to grow at a CAGR of 5 percent through 2019 to reach an estimated $14 trillion, compared with a projected CAGR for onshore wealth of 6 percent.
From an old world versus new world standpoint, significant differences were observed in the share of regional wealth held offshore. In the new world, the largest shares of offshore wealth were in Latin America and MEA (both 28 percent) and Eastern Europe (17 percent). Asia-Pacific (excluding Japan) has a high onshore bias, with just 8 percent of regional wealth held offshore. In the old world, shares of wealth held offshore were also generally low, such as in Western Europe (7 percent), North America (2 percent), and Japan (1 percent). Japan has long had a local and conservative bias, with limited assets flowing offshore owing to both a preference for local banks and a high percentage of cash as an asset class. Overall, old-world wealth held offshore is expected to grow by 1 percent annually through 2019, with the new world projected to have a 7 percent annual increase.
The Flow of Wealth Offshore. Current political and economic tensions, such as those in the Middle East and Latin America, continue to drive the demand for offshore domiciles that offer high levels of stability. In some countries, a shortage of developed and professional wealth-management skills also encourages the flow of wealth to destinations abroad.
In 2014, the Caribbean and Panama remained the preferred destinations for wealth originating in North America, with 54 percent of offshore wealth placed there. The U.K. (15 percent) and the Channel Islands and Dublin (15 percent) were also common destinations.
Proximity remained a key driver for offshore wealth originating in Western Europe, with most offshore assets booked in Switzerland (35 percent on average), the Channel Islands and Dublin (21 percent), Luxembourg (14 percent), and the U.K. (5 percent). A similar dynamic was observed in Eastern Europe, with offshore wealth booked in Switzerland (34 percent), the U.K. (17 percent), the Channel Islands and Dublin (16 percent), and Luxembourg (11 percent). The Caribbean and Panama were also common destinations (6 percent combined).
As for offshore wealth originating in Asia-Pacific (excluding Japan), Singapore (32 percent) and Hong Kong (16 percent) remained the top destinations. Wealth originating in Asia-Pacific (excluding Japan) was also booked farther away, such as in the U.K. and Switzerland (both 11 percent).
Latin American wealth booked offshore tended to go to the U.S. (29 percent) and the Caribbean (29 percent) owing to cultural and historical ties, as well as to Switzerland (27 percent). For MEA wealth booked offshore, Switzerland (31 percent) was the destination of choice, followed by the U.K. (22 percent) and Dubai (19 percent).
Outlook for Offshore Booking Centers. Switzerland remained the leading offshore booking center in 2014, with $2.7 trillion in wealth from abroad, or 25 percent of total offshore bookings globally. (See Exhibit 5.) The country remains under intense pressure, however, from both European and U.S. tax authorities seeking to crack down on tax evasion.
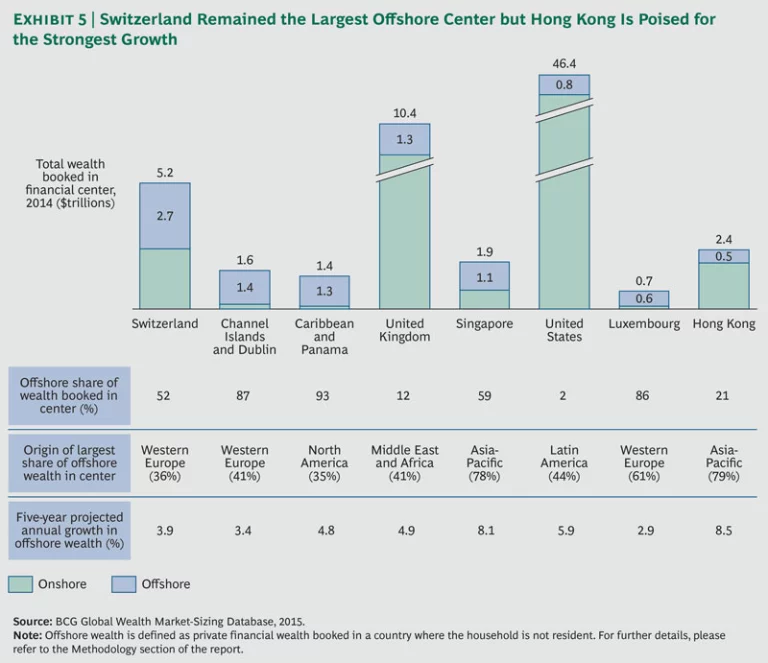
Looking ahead, Switzerland will need to reinvent itself to resist the threat from fast-developing Asia-Pacific booking centers as preferred locations for offshore wealth. Currently, offshore hubs in Hong Kong and Singapore represent the most significant challenge to Switzerland’s position. These two locations, accounting for 15 percent of global offshore assets in 2014, are expected to gain in prominence, with projected annual growth of 8 or more percent in offshore bookings over the next five years. They are projected to hold 17 percent of global offshore assets in 2019, owing mainly to the creation of new wealth in the Asia-Pacific region. They are also expected to be the fastest-growing offshore centers, followed by Dubai (at 6 percent annual growth, albeit from a smaller base).
The U.K., owing to its accessibility and reputation for security, continued to thrive as a preferred booking center in 2014, with $1.3 trillion (12 percent) of total offshore money. The Caribbean and Panama, also with $1.3 trillion (12 percent), remained an important booking center as well, especially for North American and Latin American clients. The U.S. will continue to grow at a steady 6 percent—owing mainly to the creation of new wealth in Latin America—and is expected to hold 8 percent of global offshore assets in 2019.
Luxembourg is expected to grow slightly below the average rate, at 3 percent, with its share of offshore assets expected to decrease from 6 percent in 2014 to 5 percent in 2019. The Channel Islands and Dublin, known historically for expertise on trusts, are also expected to decline in prominence, with their share of total global offshore assets (13 percent in 2014) projected to fall to 12 percent in 2019. A key factor is the decline in the global trust business, driven by increasing tax pressure in old world countries.
Methodology
BCG’s proprietary methodology for measuring the size of global wealth markets has been continuously refined and enhanced over the past 15 years. Our definition of wealth includes cash deposits, the net amount of listed securities held either directly or indirectly through managed funds, and life and pension assets. Such assets can typically be monetized easily. Other assets, more difficult to monetize and thus excluded, include real estate (primary residence as well as investments), business ownership, and collectibles, consumables, and consumer durables such as luxury goods.
The market-sizing model of Winning the Growth Game: Global Wealth 2015 now covers 92 countries accounting for more than 99 percent of global GDP in 2014. All GDP and private-wealth growth rates are in nominal terms. (As originally released in June 2015, the report covered 62 countries accounting for some 94 percent of global GDP.) Venezuela is excluded this year owing to uncertainty about potentially high future inflation and the biased impact on projections of private wealth in Latin America.
In order to exclude the effect of fluctuating currencies on private-wealth calculations, we used 2014 average exchange rates throughout. However, because of the extent of the Argentine peso devaluation relative to the U.S. dollar (32 percent), this year’s report uses year-by-year exchange rates for Argentina (that is, a 2013 exchange rate for 2013 wealth, a 2012 exchange rate for 2012 wealth, and so on) to better reflect the evolution of wealth in that country. The impact of the adjustment is a five-year annual growth projection of 1 percent, versus 19 percent using the 2014 average exchange rate throughout, for projected wealth of $0.4 trillion in 2019 instead of $0.8 trillion.
Acknowledgments
For their valuable contributions to the conception and development of this report, our special thanks go to the following BCG colleagues, by region.
Asia-Pacific: Isada Hiranwiwatkul, Saurabh Tripathi, and Yasuhiro Yamai.
Europe, Middle East, and Africa: Peter Adams, Carsten Baumgärtner, Thorsten Brackert, Pieter Brascamp, Pol Brouckaert, Stefan Dab, Guido Crespi, Dean Frankle, Luís Gravito, Jérôme Hervé, Sergey Ishkov, Til Klein, Ludger Kübel-Sorger, Benoît Macé, Markus Massi, Martin Mende, Tim Monger, Çağri Ogan, Edoardo Palmisani, Stuart Quickenden, Monica Regazzi, Olivier Sampieri, Michael Schachtner, Claire Tracey, and Ian Wachters.
Americas: Kilian Berz, Marta Calvo, David Bronstein, Nan DasGupta, Edgard Hong, Monish Kumar, Enrique Mendoza, João Moreira, Joel Muñiz, Neil Pardasani, Gary Shub, Steve Thogmartin, Masao Ukon, and Joaquín Valle.
Core Global Wealth team: Fiona Amann, Gian Gallati, Charles Gardet, Samidha Gupta, Nancy Handa, Neha Killa, Nisha Mittal, Annette Pazur, and Guido Thaler.
We also thank Freya Jenkins for her support and Andreas Bürkli and Marc Grüter for their risk management expertise.


