Managing complexity and its related costs is a growing challenge for companies. The increasingly global nature of business gives rise to diverse customers and markets, convoluted supply chains, and vast supplier networks. The trend toward product customization allows customers to “have it their way” but wreaks havoc on production schedules and inventory management. Parts and components proliferate on warehouse shelves, sophisticated technologies and formulas underlie even the most basic products, and our gadgets have more features and functionality than ever before. The costs of this increasing complexity are often hidden, but they are almost always a significant drain on profitability.
Even complexity that is translated into additional revenues, such as product or service enhancements that customers value and are willing to pay more for, and that differentiate a company from the competition—or that result in greater customer satisfaction and loyalty—can hurt the bottom line if the value it delivers in increased revenues isn’t greater than its real costs. Driving out needless complexity from product and customer portfolios, manufacturing operations, and supply chains can be an effective way to increase margins, boost efficiency, strengthen the core business, and improve asset and resource utilization throughout the enterprise. Unfortunately, few companies apply the analytical rigor needed to fully understand the tradeoffs.
For instance, product variety can be a competitive differentiator, but it requires more designers and engineers, more components and raw materials, more changeovers in production lines, higher inventory levels, more plant and equipment, and more people to market, support, and manage the product and customer portfolios. Many of these costs are indirect and not readily apparent.
Few companies truly understand the underlying economics of product variety and other types of complexity. As a result, they either underestimate the total impact of product and portfolio complexity on their operations or end up cutting out too much—or the wrong things—to save money. Nor do accounting systems always facilitate clarity. Because these systems tend to allocate costs on the basis of a single universally applicable algorithm (such as volume sold) rather than actual incurred expenses, lower-volume items often end up with less than their share of allocated costs, even if they consume more time and effort. The problem also extends to pricing. When companies lack a full understanding of costs in applying a “cost-plus” pricing model, they often underprice their more complex products—and lose money as a result.
With greater cost transparency and the right strategies for effectively managing complexity across the enterprise, companies can achieve an enormous payoff: a 25 to 100 percent increase in profit margins. This paper offers a systematic approach for weighing the cost/value tradeoffs of different products, provides guidance on how to optimize the total profitability of the product portfolio, and offers specific strategies for mastering complexity throughout the value chain.
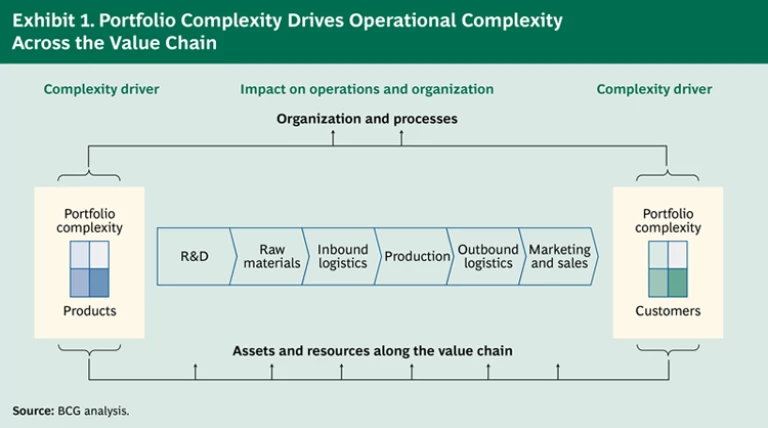
The full impact of product and portfolio complexity on operations is rarely obvious, even though it is felt across the entire value chain. (See Exhibit 1.) It hides in and between functions, departments, and regions, where employees see only slices of the problem. The people in sales, for instance, may see only a complex product portfolio. But plant managers wrestle with the challenges of production planning and scheduling, supply chain managers deal with rising inventories, and finance managers see a growing level of investment in fixed assets.
With so many cost factors to consider (related to location, product mix, plant capabilities, and supply chain design), relying on assumptions, intuition, or gut feeling often leads to the wrong decisions about which products add the most value and which to prune from the portfolio.
For the best results, companies need to gather and analyze the right data from their operations: revenues and costs by product line and profit or cost center; production volumes by production location and product line; cost, capacity, and utilization of equipment; overhead related to support functions; and inbound, outbound, and intraplant logistics. These data will provide a fairly complete cost picture by product line. Companies must then quantify and model three key factors that drive cost:
Scale: the effect of volume on costs per unit
Efficiency: relative productivity, utilization (average and peak), and process complexity (automation, handovers, and standardization)
Factor costs: input costs (such as labor), operating costs (such as fuel or IT), and logistics costs (such as shipping)
A detailed analysis will reveal the most relevant cost drivers and the relative effect of each on different products in the portfolio. The cost per unit of production goes up or down depending on the interplay of drivers such as production volume (scale), equipment utilization rates (a measure of efficiency), and local labor rates (a factor cost), along with overall process and supply-chain complexity. Armed with this information, companies can gain important insights into the relative profitability of different products and what levers to pull to minimize the costs of complexity—and increase profit margins. In this context, reviewing existing pricing practices may also yield immediate opportunities.
The total costs of each product must be weighed against the value delivered in terms of revenues and competitive differentiation. Because companies have a tendency to overestimate the relative advantages of their products and product features, a deep understanding of the market and consumer behavior is critical—what different customer segments want, what they’re willing to pay, and what competitors are offering. Customer interviews, surveys, and focus groups can provide valuable insights, as can key suppliers. Make a dispassionate comparison of your products, costs, and capabilities against those of other players in the market. Consider where your products are in their life cycles. This analysis will help determine how differentiated your products really are and how best to position future offerings.
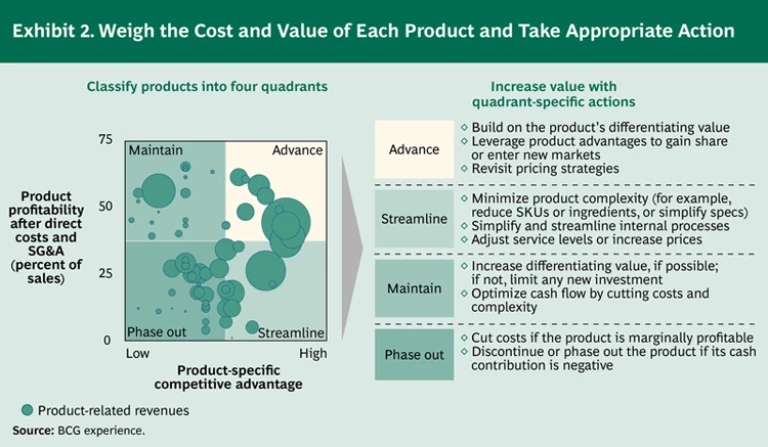
Companies can plot their products on a cost/value matrix that has two dimensions: the degree of value or competitive advantage that specific products offer and the operating margin of each product after subtracting direct costs and SG&A expenses. (See Exhibit 2.) The result is a view of the product portfolio that furnishes insight into which products provide the greatest value and offers guidelines for how to improve profitability, streamline the total number of offerings, and strengthen the overall portfolio. Products will fall into one of four quadrants:
Advance (High-Margin, High-Advantage Products). Products in the upper right quadrant rank high along both the cost and value dimensions. They are highly profitable and have a strong competitive advantage relative to other products in the market. Companies should commit to advancing these products by building on their differentiating value—the variety, quality, or features they offer—and by streamlining operations to increase margins even further. Look for ways to leverage the advantages of these products to gain share or enter new markets. Consider the most effective ways to sell these products, too. A large financial-services company, for example, deliberately restricted its portfolio of available investment products so that its sales reps could understand the products more deeply and sell them more effectively—at a lower overall cost.
Streamline (Low-Margin, High-Advantage Products). Products in the lower right quadrant are highly differentiated but not very profitable, an indication that prices are too low or costs are too high—or both. The goal here is to increase margins by some combination of raising the price, reducing service levels, and minimizing product or operating complexity. Again, look for ways to reduce SKUs, ingredients, or components, or to simplify product design and specifications. To further minimize costs and inefficiencies, consider transferring sales to a distributor, adjusting service levels for support functions, and streamlining and standardizing processes. A global white-goods manufacturer’s main product line used many different technical components and user interfaces for different markets. By creating a common platform and reducing the number of components and interfaces, the company cut product complexity by almost 70 percent; reduced line changeovers, inventory, and scraps; and reduced the number of people needed to handle material and supervise assembly.
Maintain (High-Margin, Low-Advantage Products). Products in the upper left quadrant of the cost/value matrix are profitable but lack a competitive edge relative to other offerings in the market. The first order of business is to try to strengthen this position by finding new ways to add differentiating customer value. If this isn’t possible, or if strategic relevance is minimal, then the key is simply to maintain the position: strictly limit new investment and optimize the cash contributions of these products by reducing costs and operating complexity. For instance, look for ways to simplify specifications or minimize SKUs, ingredients, or components. Consider cutting back on sales support or using a distributor to minimize selling costs.
Phase Out (Low-Margin, Low-Advantage Products). Products in the lower left quadrant rank poorly along both dimensions. They are minimally profitable and not highly differentiated relative to competing products. These are often the most mature products in the portfolio, with margins that have steadily declined as competitors have entered the market. Since these products often consume valuable resources and can end up as cash traps, cut costs wherever possible and improve the economics by such actions as bundling or cross-selling with other products. Regularly monitor the profitability of these borderline products, and phase them out if their cash contribution becomes negative.
Unless the two dimensions of cost and value are evaluated together, companies can mistakenly target new products for elimination because of their low margins. Our cost/value approach ensures that new, competitively differentiated products aren’t dropped before they have had a chance to reach critical mass in the market.
It’s important to explore various improvement levers before discontinuing a product prematurely. Many marginally profitable products can become profitable if one or more aspects of operations are adjusted. For example, an analysis of the product portfolio of a chemical company showed that 50 of its 80 products fell short of the company’s profitability targets. By reducing marketing expenses, charging customers for technical support, and increasing minimum order sizes, in addition to implementing just-in-time supply purchases and consolidating make-to-order production runs, the company was able to achieve profitability targets for 20 of those 50 products.
Of course, decisions about portfolio optimization must always be made in the context of strategy. A dispassionate review of the product portfolio can help companies clarify the positioning of their products relative to the competition, pinpoint products with the greatest potential for enhancement, and identify areas where operational complexity can be reduced to increase margins. This approach can also uncover high-cost, low-value products that can be eliminated with very little negative impact—assuming that your premium customers don’t depend on them—while streamlining the portfolio by minimizing the number of products overall.
Evaluating the product portfolio is an essential first step toward balancing the costs and value of product complexity. But before making any final decisions about where and how to prune the product portfolio, it is critical to explore the impact not just of the actions determined by the cost/value matrix but also of a broader set of initiatives that will drive down complexity and its related costs throughout the value chain. We recommend the following eight strategies.
Make complexity transparent. Analyze and expose areas where complexity arises in an organization and what the related costs and benefits are. This step is crucial for several reasons. First and foremost, you can only fix what you can see. Second, to reduce complexity over the long term, companies must have the right incentives and metrics in place to motivate managers and to track progress over time.
A large industrial-goods company instituted a simple measure of complexity to streamline and reduce the costs within its organization. The company created a global “complexity index” for each department by multiplying the number of portfolio products, brands, legal entities, production sites, and suppliers and dividing the result by total sales. The company then worked to decrease this baseline complexity index by taking actions such as cutting out low-performing products, reducing sales force costs, and consolidating the supplier base. Improvements to the index were tracked over time and resulted in savings of 10 percent of associated costs after only one year.
Apply the “80/20” rule. In many companies, the 80/20 rule prevails—that is, 20 percent of customers or products account for 80 percent of revenues. This rule can also apply to complexity. To see if it does, first analyze which products and customers account for 80 percent of revenues, and which resources and assets are needed to support them along each step of the value chain. Do the same for the products and customers that account for the remaining 20 percent of revenues. You may be surprised to find that this smaller segment uses a disproportionate share of assets and resources. Optimizing these margin-sappers will reduce costs and complexity throughout your company’s operations and free up resources and assets that can be put to more profitable use.
A chemical company with a large portfolio of products found that 40 percent of its products accounted for almost 90 percent of revenues. For each product, the company rigorously analyzed the competition’s technological barriers to entry and the hurdles customers would face to switch to a competitor’s product. Pruning products with a low score on both counts allowed the company to reduce its product portfolio by almost 40 percent, reduce fixed assets by almost 20 percent, and sharply increase overall asset productivity.
Optimize the whole, not the separate silos. Silo vision tends to hinder any efforts to systematically reduce operational complexity. Without a cross-functional, end-to-end perspective across the entire enterprise, managers tend to focus on their own functions or departments. This silo thinking is a source of process complexity. To streamline processes and minimize costs, companies should analyze all critical, cross-functional processes, as well as those that serve purely internal purposes. Measure factors such as time, cost, errors, volume, and the number of people and touchpoints involved. This analysis will reveal processes and process steps that are high-cost and inefficient—and that have the greatest potential for improvement. Look for ways to standardize processes across regions and functions, and automate wherever possible.
Segregate complexity into separate systems. By separating complex products and processes and dealing with them as outliers, you can make the more standard aspects of the business as efficient, streamlined, and low-cost as possible. For instance, when a complex product must be built to customer specifications, segregate this product line and its manufacturing processes and then optimize the facility for standard items. Look for ways to unbundle complex products, find platforms or components that can be made in bulk, and separate high-volume production from finish work, customization, and final assembly. For instance, if a product has many variations but is built on a basic platform, manufacture the platform in high volume to keep costs down—and ship to a centralized facility for final configuration or regional customization as orders come in.
Bundle features together to “standardize” complexity. Automobile manufacturers have mastered this strategy because they’ve had to—customers have an endless series of options to choose from, starting with basics such as model type, engine type and size, and tires. Add to this the comfort and fashion choices such as the sound system, heating system, seat cover, and paint job. Taken together, these choices represent millions of potential variations. By bundling groups of popular features into standard packages, automakers are able to simplify production and increase margins while providing more value to customers.
Define plant and asset roles. To minimize manufacturing complexity and get more from your production network, match asset characteristics with the needs of specific products and customers. Consolidate products with similar characteristics, and explore ways to reallocate products across the network for greater cost savings, flexibility, and efficiency. Looking across your company’s production network, define specific plant roles, such as the following:
High-Volume Assets. These production assets are dedicated to high-volume manufacturing of a limited number products, with few changeovers.
Multiproduct or Flexible Assets. For a broader portfolio of lower-volume products, or for products with volatile or unpredictable demand, use production assets with short changeover times to increase versatility and flexibility.
Be sure to use the right assets for each product group. One manufacturer was using high-speed packaging lines for low volumes of product with frequent changeovers, which increased complexity, eliminated scale benefits, and resulted in higher unit costs than if the company had used more flexible, less technically complex (and less costly) lines. By defining specific asset roles—such as “high-volume packaging asset” or “low-volume packaging asset”—and setting strict guidelines for allocating products to assets, the company increased output by 34 percent and reduced unit costs by 25 percent in six months.
Set and document guidelines for asset roles and product allocation, and regularly monitor adherence—especially when new products are launched or new capital investments are considered.
Identify roadblocks—and delayer. Complex organization structures add layers and interfaces that can slow decision making, obscure responsibilities and accountability, and lead to “orphaned” costs that lack a clear owner and are not managed or scrutinized as a result. This complexity often extends beyond the enterprise to include joint ventures, equity investments, suppliers, subcontractors, and other partners. As the number of people involved in a process increases, the number of interfaces grows exponentially and can virtually paralyze an organization.
Addressing organizational complexity demands a big-picture view. Analyze networks and information flows to identify silos and roadblocks, and keep an eye out for relevant processes that lack clear ownership. The interdependencies and interfaces among functions are often hidden, and important elements can fall through the cracks. Clarify responsibilities, especially for tasks and processes that bridge organizational units.
The flexibility and decision-making capabilities of a consumer goods manufacturer were hampered by a complex organization structure with unclear accountabilities, a maze of dotted reporting lines, and numerous “microteams” with five or fewer people and a manager. By rigorously mapping the layers and spans of control for all organizational units and major departments, the company managed to pinpoint where organizational complexity was particularly severe. An organizational redesign driven by top management cut back on the number of microteams by as much as 60 percent in some departments and reduced the number of organizational layers from nine to seven. As a result, the company is more flexible, makes decisions more quickly, and is more responsive to customer needs.
Challenge assumptions and model new scenarios. The impact of complexity on costs and assets is rarely clear-cut. By modeling different optimization scenarios, your company can get a better sense of where the potential for improvement is the greatest. Often, the insights gained are counterintuitive. For example, one pharmaceutical company had a product portfolio with many low-volume products. This led to frequent changeovers of production equipment and high fixed costs per unit. Because asset utilization was high, however, the production managers doubted that any major productivity gains were possible. Modeling the impact of different scenarios for reducing complexity showed that eliminating the low-volume products would free up significant capacity while only marginally reducing overall output and revenues. By following through on this recommendation, the company was able to streamline its product portfolio and close a production site, which decreased fixed costs substantially without hurting its most strategic products and customers.
Keep in mind that streamlining operations and minimizing complexity are iterative processes. Whenever your company delayers the organization or prunes products or customers from the portfolio, look for opportunities to consolidate production and close a plant, service center, or back-office unit. (Click “Extreme Complexity-Busting: Rethinking the Business Model,” below.)
Reducing complexity is often approached as a one-time effort. But business growth can lead to new products and customers, so companies must be vigilant about sustaining results. To keep complexity from creeping back, ensure that it can be measured easily, set targets and pragmatic guidelines that minimize the number of unique components in product offerings, and establish minimum order sizes. Limit the number of changeovers per production asset and the degree to which service offerings can be adjusted to a customer’s specific situation. Make it a requirement that new products be screened for their hidden complexity costs and value-chain impact. Although companies typically consider whether a new product can be made with existing plant and equipment, the impact on asset productivity—changeovers, ramp-ups, and the resulting downtime—is often overlooked.
Because reducing complexity is a cross-functional effort, establish cross-function oversight to drive and sustain the initiatives and monitor progress. Many leading companies empower their product-development teams to review new-product designs and even to veto development if, for instance, the number of unique components is too high or too few standard components are used.
A complexity scorecard with a few critical metrics for each value-chain step and function can be a valuable management tool, especially if integrated into reporting routines. For instance, the scorecard could track how many resources (production, service, and so on) the most profitable customers use, or rank assets by the number of changeovers or schedule changes in a given time period. Typically, business- or customer-specific scorecards provide the most valuable input.
The main benefits of reducing complexity come not just from pruning the product portfolio or eliminating unprofitable customers but from enabling major improvements in asset and resource utilization across the value chain. Consolidating production and making it more efficient frees up capacity that can absorb growth without adding fixed assets, so capital can be allocated with more focus—delivering greater value at lower costs. Streamlined processes allow companies to handle more customers and products without adding resources. The result is a more competitive and profitable business model.
Although complex products or greater variety can differentiate a company in the marketplace, they also drive operational complexity and add costs to the production processes, supply chain, and overall organization structure that support the business. For most companies, it is an ongoing challenge to maintain margins and a competitive edge. Mastering complexity can dramatically reduce costs, strengthen the core business, and pave the way for faster, more profitable growth.
Acknowledgments
The authors wish to thank Harold L. Sirkin, Jérôme Richard, and Martha Craumer for their contributions to this White Paper.
Extreme Complexity-Busting: Rethinking the Business Model
Most complexity-reduction efforts target existing structures and processes. But thinking out of the box can propel your company forward by orders of magnitude, leaving “business as usual”—and the competition—in the dust. Develop radical, greenfield scenarios by brainstorming ideas that the company has never considered before. Ask the following questions: What would our business model look like if we offered only one product? If we outsourced all manufacturing? If we sold only online? If we sold only to China? What impact would these changes have on production, logistics, sales, and financial performance?
Henry Ford’s zero-complexity approach to automobile production proved to be a breakthrough. “People can have the Model T in any color—so long as it’s black,” he famously proclaimed. With an assembly line and mass production, he revolutionized the industry. And the automobile, which had once been a plaything for the rich, became affordable to the average American.