Leaders around the world increasingly recognize that GDP alone cannot give a full picture of a country's performance. The well-being of citizens is an even more important measure. The Boston Consulting Group’s Sustainable Economic Development Assessment (SEDA) is a powerful diagnostic designed to provide government leaders with a perspective on how effectively their countries convert wealth, as measured by income levels, into well-being.
Our research shows that the private sector can make crucial contributions to well-being. When scalable, sustainable solutions to social challenges emerge, we often see the private sector playing a central role. Such efforts go beyond corporations' support for social or environmental causes that are unrelated to their primary business—often part of corporate social responsibility initiatives. Rather, companies can innovate within their core business models in a way that not only enhances shareholder value but also helps address important societal challenges.
To understand the opportunity for the private sector to make a meaningful social impact, we took a close look at the financial services sector and the issue of financial inclusion: access among underserved groups to services such as simple payment and money transfer services, deposit accounts, credit, and insurance. Among our most compelling findings: there is a clear and measurable link between financial inclusion and well-being. And this connection holds even when we control for income, which means that it is not due simply to wealthier countries' higher levels of both well-being and access to financial services.
In addition to the insights on financial inclusion, our 2016 assessment highlighted some interesting stories:
- Countries in sub-Saharan Africa such as Ethiopia are making tremendous strides in improving well-being; 15 countries in sub-Saharan Africa are in the top quintile in that measure.
- Developed countries with relatively high current levels of well-being posted weak improvements in general. Greece had the lowest score for recent progress in well-being among the countries we assessed.
- To better understand the dynamics in Europe, we divided Western European countries into three tiers by their scores in current level of well-being. The low-level countries, concentrated in southwest Europe, are performing particularly poorly in employment and are falling further behind the rest of the world in that area.
- In a period of turmoil within the European Union, SEDA reveals that EU membership may have a significant positive effect in certain areas. Several Central and Eastern European countries are among those with the highest recent progress in sustainability (which includes income equality, civil society, governance, and environment). Those countries have recently joined or are in the process of joining the EU, and their gains are probably influenced by EU policies and standards.
- China continues to produce well-being improvements in line with its rapid economic growth. India has a high recent-progress score, although its ability to convert its strong GDP growth into well-being improvements is slightly below average.
Defining Well-Being
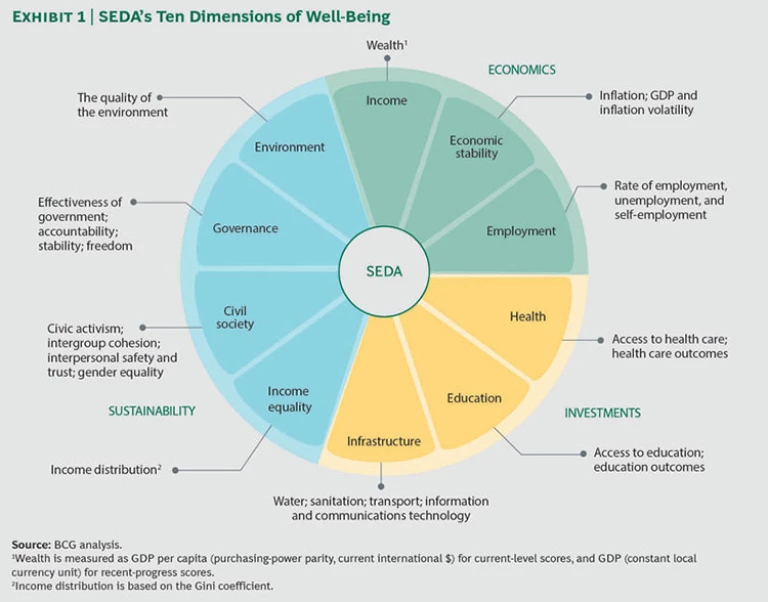
SEDA defines well-being through three fundamental elements that comprise ten dimensions. (See Exhibit 1.)
- Economics, which includes income, economic stability, and employment
- Investments, which includes education, health, and infrastructure
- Sustainability, which covers two areas: the environment dimension and social inclusion, which comprises the income equality, civil society, and governance dimensions
For each country, we calculate four measures that provide insight into relative levels of well-being:
- The current level offers a snapshot of well-being today on a scale of 0 (lowest) to 100 (highest).
- Recent progress examines how well-being has evolved from 2006 to 2014. This metric is also measured in relative terms, on a scale of 0 to 100.
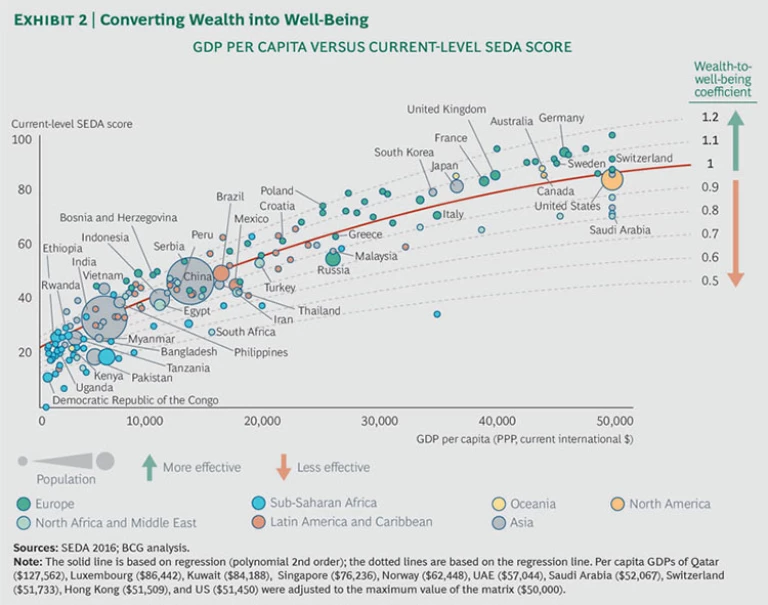
- Wealth to well-being compares a country’s current level of well-being with the level that would be expected given the nation’s per capita income. The expected level is represented by a coefficient of 1.0, which is based on global averages.
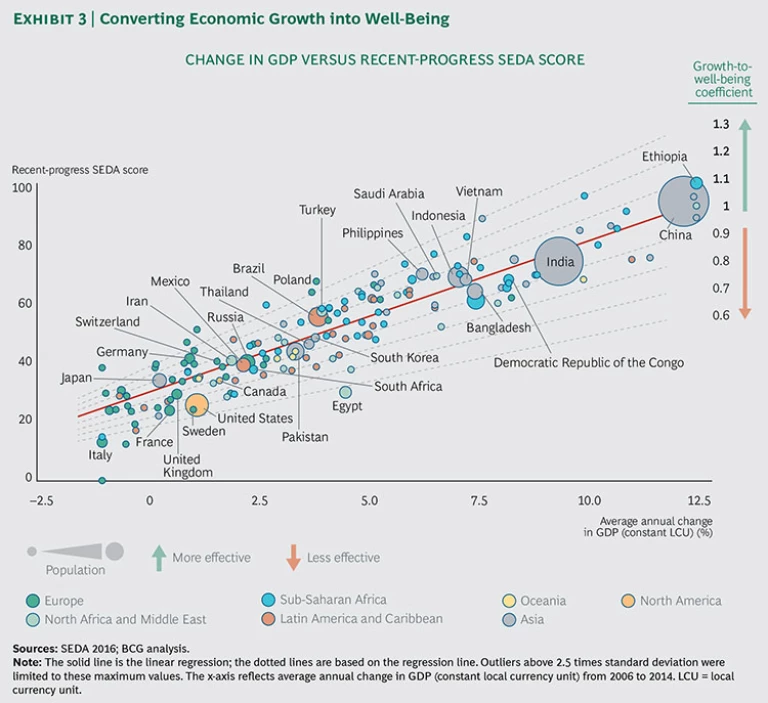
- Growth to well-being compares how effectively a country has converted its economic growth into well-being improvements with the level that would be expected. This is also represented by a coefficient of 1.0, based on global averages.
Insights from SEDA 2016
The top ten countries in current-level SEDA scores are in Western Europe. Norway is number one, as it has been since we launched SEDA, in 2012.
When it comes to countries that made the greatest strides in well-being, Asia and Africa dominate. Ethiopia has the highest recent-progress score—gains there have been particularly strong in income and health. (See Strategies for Improving Well-Being in Sub-Saharan Africa, BCG Focus, May 2013.) Ethiopia's performance is emblematic of the gains in sub-Saharan Africa as a whole: 15 countries in the region are in the top quintile of recent-progress scores.
A number of Western countries, meanwhile, posted weak progress. Greece has the lowest recent-progress score among the countries we studied. Not surprisingly, the country's recent-progress performance in economics is also the weakest in our data set.
To better understand the dynamics in Europe, we divided Western European countries into three tiers by current-level scores. The most striking differences between the high and the low groups are in the education and employment dimensions. The countries in the top group (Austria, Denmark, Finland, Germany, the Netherlands, and Norway) are well above the average of those in the bottom group (Cyprus, France, Greece, Italy, Malta, Portugal, and Spain) in both employment and education and made greater progress than the low-tier countries in both dimensions.
Myanmar is one of the new countries in our data set this year. The country has seen a period of major political and economic reforms, culminating in the transition this year to the first elected government in more than five decades. Amid such changes, the country is experiencing a surge in interest from foreign investors. Myanmar's evolution is reflected in its SEDA scores. While the country's current-level score is in the second lowest quintile, its recent-progress score is in the top quintile. Progress has been particularly strong in health and income.
Converting Wealth and Growth into Well-Being. SEDA allows us to control for wealth and growth when assessing well-being. Consequently, we can identify countries that are converting wealth or growth into well-being at above average rates.
When it comes to converting wealth into well-being, several countries stand out. Among them are Vietnam, Rwanda, Albania, and Ethiopia. (See Lotus Nation: Sustaining Vietnam's Impressive Gains in Well-Being, BCG report, March 2016.) (See Exhibit 2.)
Meanwhile, three Balkan nations are leaders when it comes to converting growth into well-being: Croatia (which holds the number one position), Bosnia and Herzegovina, and Serbia. (See Exhibit 3.) Poland, which had the highest growth-to-well-being coefficient in 2015, continued its strong performance and is in the fifth spot this year.
China continues to produce well-being improvements in line with its robust economic growth from 2006 to 2014. The country's gains have been well above the rest of the world's in investments—health, education, and infrastructure. But China continues to lag behind the median in sustainability—particularly in the environment dimension.
India also has an above average wealth-to-well-being coefficient. India's overall progress, however, is slightly below what would be expected given its growth rate from 2006 to 2014.
Patterns Across Groups of Countries. Our 2016 analysis shows that most of the patterns we identified in 2015 persist—with some interesting variations.
- Both this year and last, we found that countries with high current-level scores in sustainability made the greatest progress in that area. Countries with low current-level sustainability scores posted recent progress below the median and so were falling further behind. This year, the pattern continues, with particularly strong gains by Eastern and Central European countries. The strong performance among some of those countries reflects changes that were in part a result of recently joining or being in the process of joining the EU.
- This year, most oil-rich countries (those that earn rents from oil that represent more than 10% of GDP) were again below average at converting both wealth and growth into well-being. In our 2015 and 2016 analyses, the current-level score for this group lagged behind the score for the rest of the world significantly in the area of governance.
- This year and last, we found that countries with faster economic growth tended to have much lower recent-progress scores in the environment. China, for example, posted strong economic growth from 2006 to 2014 but has a weak current-level score in the environment and is continuing to fall behind in that dimension.
- Our research also continues to highlight the impressive advances in sub-Saharan Africa. Last year, countries in the region posted gains in line with the median in education and infrastructure and were well above the median in health. This year, the group continues to outpace the median significantly in health and is slightly above the median in education.
- This year, we took a closer look at another topic: infrastructure. We divided countries in our data set into three groups according to current-level infrastructure scores: high, midlevel, and low. We found that countries with high current-level infrastructure scores did not post high recent-progress scores in that dimension—not surprising, given that they generally did not have as much room for improvement. Countries in the middle group made the most progress in infrastructure, much greater than that of the low current-level group. The weak progress of the bottom group has major implications for financial inclusion, as we discuss below.
Financial Inclusion and Well-Being
To understand how the private sector can contribute to well-being, we took a close look at the area of financial inclusion.
How can this be measured? The most basic financial service to which an individual can have access is an affordable financial account. Such accounts give people a safe way to deposit money, receive salary and other kinds of payments, and transfer funds to relatives. With that in mind, we used the World Bank's summary measure of financial inclusion: the percentage of individuals over the age of 15 who have a financial account, either a bank or a mobile-money account.
By this measure, there has been major progress over the past several years. From 2011 through 2014, the number of people with access to a financial account rose more than 25%, from 2.5 billion (51% of the world's adult population) to 3.2 billion (62%).
Progress, however, has not been uniform. Over the past decade, significant gains in financial inclusion have been made in East African countries such as Kenya, Uganda, and Tanzania. The growth in mobile accounts represents much of those gains. India and China have also made major strides. From 2011 to 2014, 185 million people in India and 188 million in China became first-time bank account holders.
In many wealthier countries, the challenge is one of depth—providing disadvantaged groups with financial services beyond very basic options and improving their usage rates. A key to achieving both goals is often the affordability of services. Among developed countries, the US made notable gains from 2011 to 2014, with the percentage of those over the age of 15 with an account jumping from 88% to 94%. But despite that progress, challenges remain; the unbanked rate in some states is more than twice the 6% national level.
As financial inclusion expands, what does this mean for well-being? Our SEDA analysis finds a clear and measurable connection between financial inclusion and well-being. This makes sense. Wealthier countries have more resources to invest in areas that support well-being. And given that financial inclusion tends to be higher in wealthier countries, it follows that countries with more financial inclusion would also have higher levels of well-being.
But even when we control for income, we see a clear and measurable relationship between financial inclusion and well-being. This means that among countries with the same income level, those with higher levels of financial inclusion are likely to have higher levels of well-being. In fact, we find that financial inclusion accounts for 11% of the difference in well-being among countries—above and beyond what can be explained by differences in income levels.
Why would this be? The logical answer is that financial inclusion is linked to many aspects of well-being that have little to do with income. And our analysis found that three other SEDA dimensions have a particularly strong association with financial inclusion—civil society, governance, and infrastructure—associations that hold even when we control for income.
The link to infrastructure is particularly noteworthy and understandable. Reliable electricity, access to the internet, and well-developed mobile-phone networks—all of which are captured in the SEDA infrastructure dimension—have been key tools for expanding access to financial services in many emerging economies.
Lessons in Expanding Financial Inclusion
Any real momentum in financial inclusion requires a solid foundation that consists of two building blocks:
- A sound and flexible regulatory structure that promotes innovation and competition while safeguarding consumers and the integrity of the financial system
- A robust infrastructure, including reliable electricity and telecommunications networks and a well-functioning payment infrastructure
Once that foundation is in place, the private sector can drive rapid innovation to expand financial inclusion. The pace of such innovation is reflected in an explosion of equity funding in the financial technology sector. In 2015, $22 billion was invested in privately held financial technology startups, up from just $4 billion in 2011.
We have examined four countries where private- and public-sector players have experimented with new approaches to expanding financial inclusion:
- The mobile-phone-based money transfer service M-Pesa, launched by telecommunications company Safaricom in Kenya, took off thanks in part to a flexible regulatory environment and the way the service leveraged the many small retailers in the country.
- In South Africa, strong financial regulations and the presence of large national retail chains have enabled new business models for increasing financial inclusion. Banks such as Commonwealth Bank have teamed up with large retailers, which serve as a massive distribution network for reaching previously unbanked citizens.
- In India, the government has been a major catalyst. A push to give all citizens a national ID, along with new regulations that allow companies other than financial institutions to operate as “payment banks,” is expanding financial inclusion.
- In Peru, the government has linked up with banks, telecommunications companies, and other private-sector players to promote the development of one mobile-payment system. The goal: to encourage companies to use that system to offer a slew of new, low-cost financial products and services to Peruvians who are currently excluded from the system.
These experiences highlight how various factors influence what works and what doesn't. And they underscore a critical lesson: approaches that are effective in one country are not always transferable to others.
The Private-Sector Opportunity
As we can see in our study of financial inclusion, private enterprises can create social benefits that strengthen well-being. And they can do this in the course of operating their core business—not as a side activity.
To avoid missing such opportunities, CEOs and other private-enterprise leaders—in particular, those with large footprints in emerging markets—can start by asking themselves two questions:
- Have we explored how our core business model can create social value?
- How integrated are our corporate social responsibility and government relations efforts with our core business model? Are they a distraction from core operations—or can we use them to amplify and document the social value we create through core activities?
The private sector has a major opportunity to contribute to the well-being of people around the world. And if companies do this effectively, they can boost shareholder value in the process.


