
An industry that exists to protect people from unforeseeable events and associated financial losses can’t be expected to come through a year like 2020 unscathed. And the insurance industry didn’t come through 2020 unscathed, certainly not from the perspective of shareholder returns.
Amid expectations of large payouts for all kinds of insurance companies—and the damage that low interest rates in developed markets inflicted on insurers—the average total shareholder return (TSR) of publicly held insurance companies fell into negative territory in 2020. The –5% average TSR for insurers was well below the 15% average shareholder return across industries, putting insurance near the bottom of the 33 sectors tracked by Boston Consulting Group.
This year has already been better, with insurance stocks making up some of the ground they lost in 2020. Perhaps there’s relief that, as bad as it was, the pandemic’s impact hasn’t been worse. Insurers helped people through a period of immense challenges without eroding their own economic foundations. The pandemic turned out to be an earnings event for the industry, not a balance sheet one.
Life insurance claims were financially and operationally manageable. In personal lines, a sharp decline in the number of cars on the road meant a significantly lower frequency of automobile claims, which more than offset the billions in premiums returned to policyholders. Commercial property and casualty (P&C) insurers had to deal with a high number of weather catastrophes in addition to pandemic-related losses from business interruptions and event cancellations. Offsetting these losses were a hardening market and a decline in the frequency of workers’ compensation claims as many people shifted to remote work.
Indeed, 2020 may have even contained a silver lining for insurers, forcing them to accelerate their adoption of digital technologies.
Indeed, 2020 may have even contained a silver lining for insurers, forcing them to accelerate their adoption of digital technologies. But the move toward digital technologies won’t be transformational for companies that treat 2020 as a one-time exception. For those that see it as an opportunity to reinvent their businesses and operating models, however, last year’s challenges may lead to an extended period of above-average shareholder returns.
Total Shareholder Returns from 2016 Through 2020
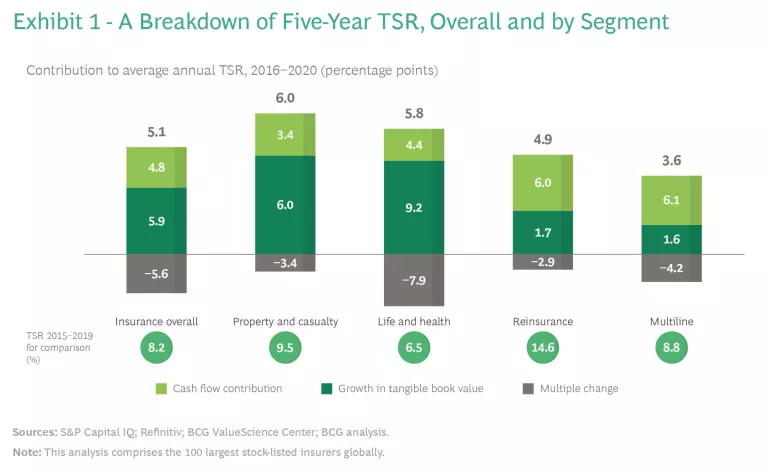
Insurers’ TSRs fell sharply in the last five years. The average annual TSR, weighted by market capitalization, was 5.1% from 2016 through 2020, 3 percentage points lower than in the previous five-year period—and significantly below the average insurer’s cost of equity. (We look at TSRs on a rolling five-year basis to illuminate long-term value creation; see “Methodology.”)
Methodology
In insurance, TSR derives from three sources: growth in tangible book value, change in the price to tangible book value multiple (P/TBV), and cash flow contribution (comprising dividend yield and share buybacks). Over the long run, tangible book value growth and cash flow are the major contributors to TSR. Over the short to medium term, changes in the P/TBV multiple matter a lot more. The most important challenge for management is making the right tradeoffs among increasing tangible book value, deploying free cash flow, and expanding or protecting valuation multiples. BCG’s TSR methodology helps insurers explore these tradeoffs and make informed decisions about factors such as portfolio focus, capital allocation, and business units’ financial targets.
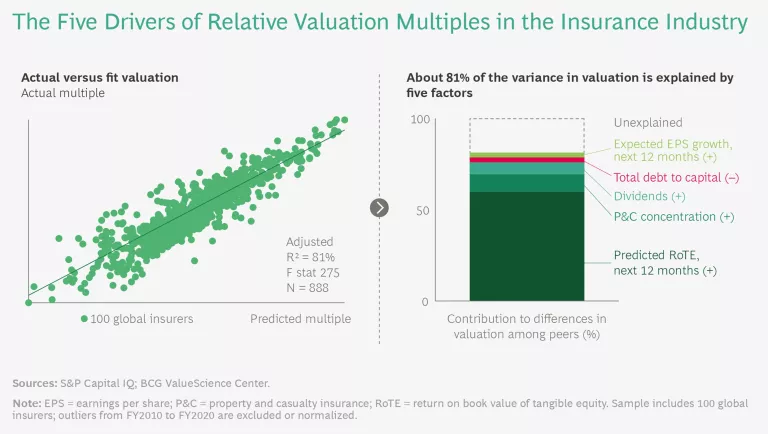
Making the right tradeoffs requires an accurate understanding of the impact of strategic and operational decisions not only on tangible book value and free cash flow but also on the valuation multiple. BCG’s Smart Multiple methodology uses regression analysis to estimate differences in valuation multiples. (See the exhibit.) In insurance, more than 80% of the variance in a company’s P/TBV multiple relative to its peers can be explained by fundamentals: profitability metrics (RoTE), balance sheet health (debt to capital ratio), forward growth expectations (expected EPS growth), and business mix (P&C concentration). When we help an insurer chart a course for superior shareholder value creation, we develop a plan that accounts for the tradeoffs among the TSR drivers (tangible book value growth and free cash flow, for example) and the expected impact of each factor on the client’s valuation multiple. Our analysis also considers risks and long-term strategic implications.
TSRs fell in every insurance segment. Reinsurers’ decline was the steepest, with an average five-year TSR that fell to 4.9% from almost 15%. Adding to the pandemic-related uncertainty that reinsurers are facing is the recent spike in natural catastrophes globally; there were more than 75 named storms in the US alone in 2020. Multiline insurance had the next biggest drop in the latest five-year period, falling more than 5 percentage points to 3.6%. P&C insurance also fell significantly, but it remained the highest performing segment. (See Exhibit 1.)
In every segment, price to tangible book value multiples (P/TBV) have had a negative impact on overall TSR performance. The pandemic has contributed to valuation declines by creating concerns about the magnitude of losses and by extending the already long period of low interest rates. Low-for-longer interest rates have been a negative for investment returns and have pressured returns on equity. In life insurance, in particular, interest rates have reduced the competitiveness of many products by increasing the costs of hedging for annuity guarantees and by lowering crediting rates for permanent life products. This is challenging life insurers’ efforts to attract new customers and grow.
The expectations of worsening returns—which prevail in every big insurance market—are behind the steady decline in insurance valuation multiples in developed markets. Exhibit 2 focuses on the decline in life and health valuations, though a largely similar drop would be evident in an analysis of P&C multiples.
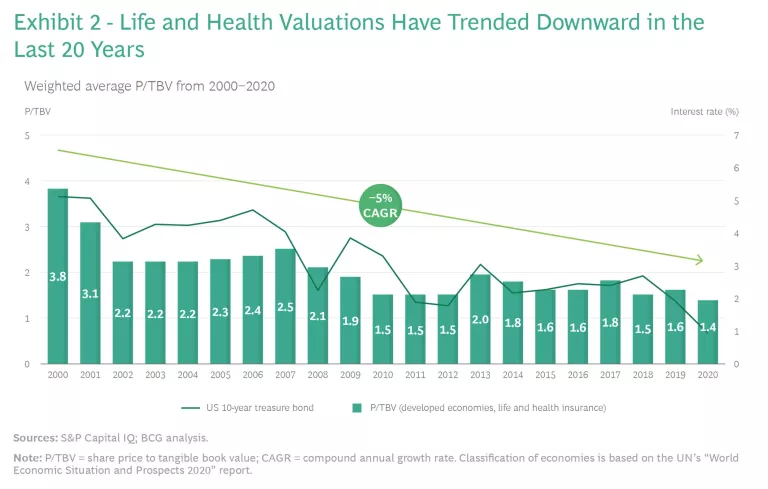
More than half of the difference in insurance valuation multiples globally is explained by differences in insurers’ return on tangible equity (RoTE), according to BCG’s Smart Multiple analysis. Downward pressure on insurance valuations is likely a reflection of investors’ expectations for further RoTE declines, especially in the life and reinsurance segments because of these segments’ outsize dependence on investment returns.
A Regional Analysis of Top-Quartile Insurers
Top-quartile insurers delivered TSRs that were roughly triple the 6% insurance industry median. This reinforces the value of a differentiated strategy and strong execution, two things generally exhibited by top-quartile carriers.
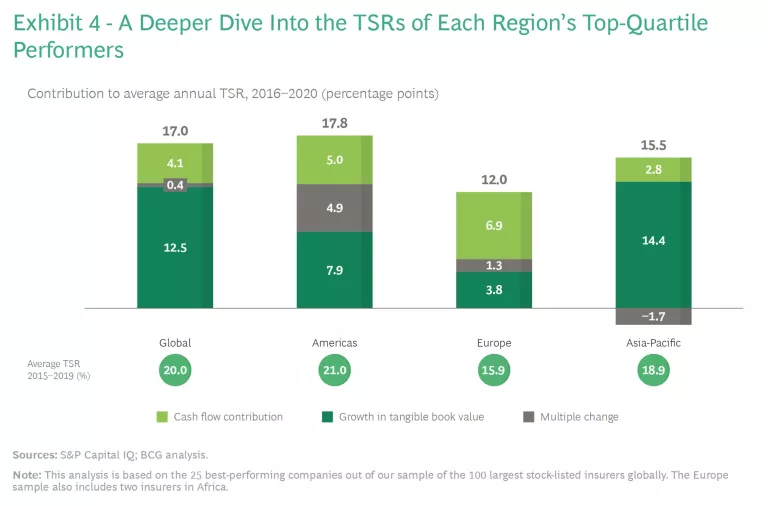
In most regions, tangible book value growth was the main source of the top quartile’s success. The only exception in the latest five-year period was Europe, where cash flow was the biggest contributor. In Asia-Pacific, tangible book value growth accounted for more than 90% of the TSR performance of top-quartile insurers; in the Americas, tangible book value growth accounted for more than 40%. Publicly traded insurers aren’t the only ones focused on growing their tangible book value in the US; mutual insurers focus on this metric too. (See “How US P&C Mutual Insurers Generate Value.”)
How US P&C Mutual Insurers Generate Value
Mutual P&C insurers are particularly prominent in the US, where they have more than 55% of the market. Five of the top ten US personal lines insurers are mutuals; the top two mutuals alone (including State Farm, the biggest personal lines insurer in the US) get more than 22% of the country’s personal lines premiums. Mutuals also have a solid presence in commercial P&C insurance, although that market is less consolidated and more global. The top two US mutuals in commercial P&C insurance have less than 8% of the market, compared with the roughly 11% combined share of the top two publicly traded commercial P&C insurers.
It isn’t possible to calculate TSRs for mutual insurers, but a good proxy for long-term value creation is tangible book value growth plus accumulated cash dividends. From 2016 through 2020, mutual insurers were a few percentage points behind publicly traded insurers according to this metric. The difference is mainly attributable to mutuals’ lower returns on tangible equity—in turn a function of their higher combined ratios and capital holdings. (See the exhibit.) With fewer options for accessing capital markets, mutual insurers have a different definition than publicly traded insurers for what constitutes “excess” capital and tend to be more cautious about deploying the capital they have.
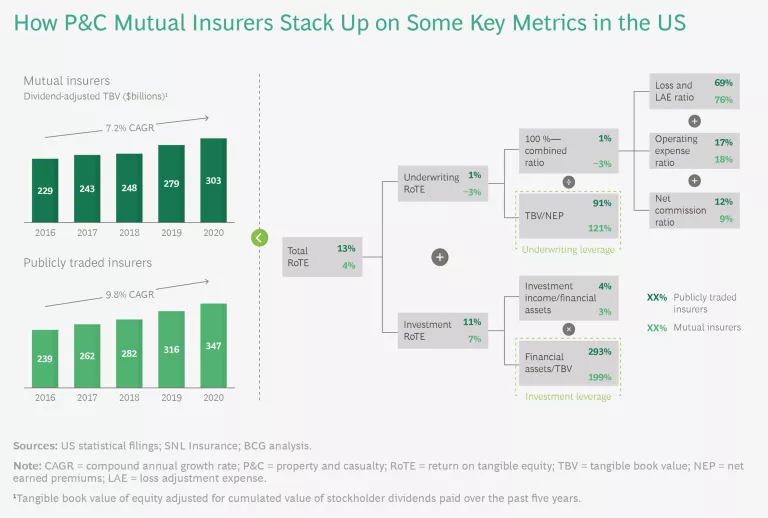
Underwriting is one of the areas where mutual insurers’ financial performance doesn’t match their publicly traded counterparts. Mutuals have a 103% combined ratio on a statutory basis, versus a 99% combined ratio for stock-traded insurers—a difference explained largely by a 7 percentage point loss ratio gap. Mutuals need financial strength like other insurers, but they are more apt to balance financial goals against the larger purpose they see themselves fulfilling with respect to a region or a group of customers. Over the last few years, US mutuals have been faster to reduce prices and slower to increase them than publicly traded insurers. This emphasis on affordability could work to the advantage of mutual insurers’ policyholders and add stability to the companies’ long-term performance.
Investment results for mutual insurers were close to those of publicly traded insurers in the most recent period (3% versus 4%), despite mutuals’ significantly higher exposure to equity in their investment portfolios (an average 30% equity exposure versus 7% for publicly traded insurers). Mutuals’ willingness to hold higher proportions of equity could be an advantage to mutuals in a low-interest-rate environment and could help them close some of the RoTE-performance gap, assuming they effectively optimize their investment functions.
Mutuals’ ample capital reserves—along with the generally lower pressure they’re under for short-term results—may give them an advantage in one significant way in the future. Specifically, it could allow them to make digital investments and upgrade their operations at a time when customers are looking for such changes.
The gaps between top- and bottom-quartile performers also differed widely by region. The biggest gap was in Asia-Pacific (22 percentage points) and the second biggest (19 percentage points) was in the Americas. Returns in Europe were less divergent and significantly lower, with top-quartile insurers generating TSRs 13 percentage points higher than bottom-quartile insurers. (See Exhibit 3.)
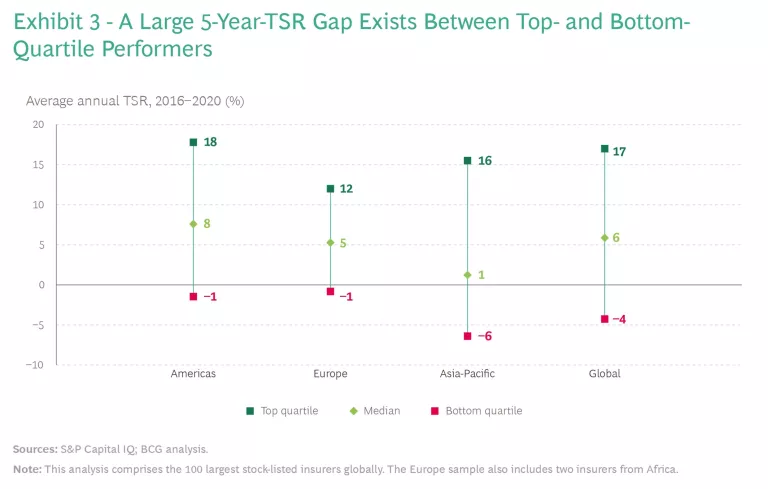
The Americas was the only region where valuation multiples were a significant help to the top quartile, contributing to more than a quarter of the companies’ TSRs. Multiple expansion only accounted for about a tenth of the TSR of Europe’s top-performing insurers. Multiples actually hurt the TSRs of top-quartile insurers in Asia-Pacific. (See Exhibit 4.)
Income investors have long valued European insurers for their dividends, given that the payout ratios have exceeded the competition in other regions. Premium growth in developed European markets has also been slow, limiting the opportunities to deploy capital at a high RoTE. Finally, the low-for-longer-rate environment has made profitable new business growth even harder for European insurers.
Across geographies, there is increasing evidence of a correlation between TSR and digital capabilities.
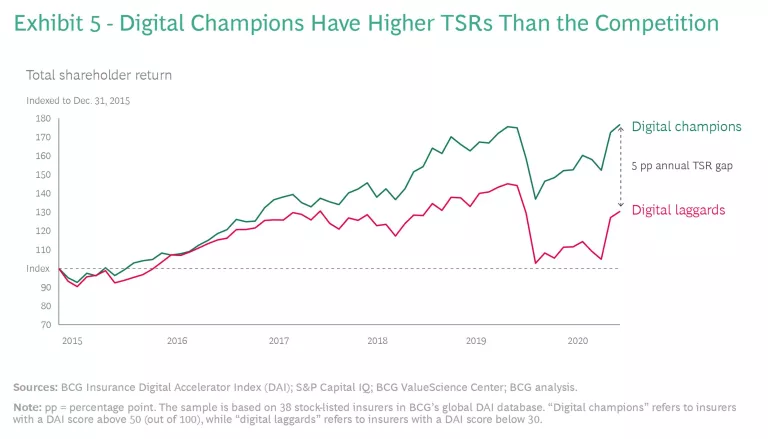
Across geographies, there is increasing evidence of a correlation between TSR and digital capabilities. In the most recent five-year period, “digital champions” (those companies near the top of BCG’s Digital Acceleration Index) had annual TSRs that were 5 percentage points higher than the “digital laggards” (those near the bottom; see Exhibit 5). Digital champions were also faster growing (approximately 6 percentage points higher annual gross written premium growth) and earned higher valuation multiples (1.8 times higher P/TBV multiples in 2020). Finally, digital champions had customer loyalty scores 8 points higher than digital laggards.
Digital leadership, of one sort or another, is a characteristic shared by several of this year’s top-quartile companies. It’s less obvious that two other characteristics generally seen as positives in business—scale and diversification—lead to better results in insurance. Only 3 of the top 25 TSR companies this year are multiline insurers with significant life and P&C businesses.
Size doesn’t guarantee effective scale; many large multinational insurers in our sample aren’t in the top quartile. In most cases, multinationals struggle to gain share against domestic carriers that have a better understanding of local markets. These domestic carriers have the right kind of scale: large, loyal customer bases; well-honed distribution networks; and a deep institutional knowledge of what works in the region. Such advantages are hard to overcome and should be carefully weighed against the fragmentation and complexity of larger, more diverse businesses.
Even though they may seem peripheral—and don’t fit neatly into a TSR waterfall chart—ESG initiatives are beginning to impact shareholder returns in the industry. An insurer not seen as environmentally responsible could, for instance, be excluded from the portfolios of large institutional investors. Such exclusions might lower its stock price and, in turn, the ability to raise capital.
Return on Equity Is Crucial
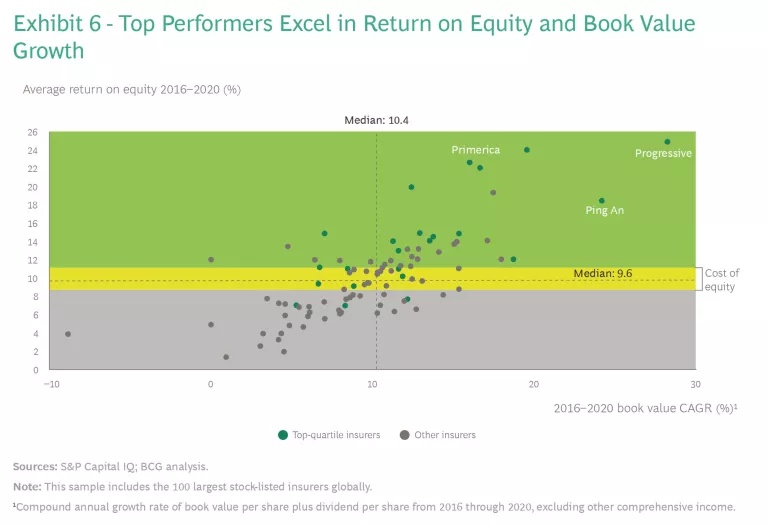
BCG’s research continues to show a strong correlation between RoE and growth in book value per share (after adding back dividends), which highlights the importance of capital productivity in long-tail, capital-intensive lines and growth in capital-light, fee-based businesses.
The RoE of 9.6% over the past five years means that many insurers weren’t making their cost of equity (which we estimate was between 9% and 11%, depending on geography and business mix). Top-quartile performers generally did not have this problem. And many top-quartile performers delivered not only high returns on equity but also high book value growth. (See Exhibit 6.)
For insurers whose RoE levels are below their cost of equity, the priority should be improving capital productivity. Only after they’ve accomplished this should they focus on book value growth. If these companies were to grow at their current RoE levels, they wouldn’t be creating shareholder value.
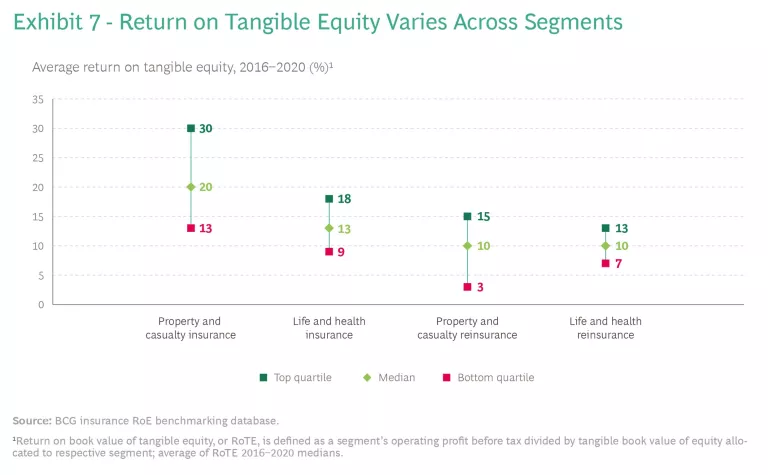
Return on tangible equity (RoTE), a measure closely related to return on equity, slipped in every insurance segment last year, reflecting the industry’s operating profit declines. The average five-year RoTE also slipped from the previous period. There were considerable segment differences, however. P&C insurers remained the best overall, thanks to their lower capital intensity and the short-tail dynamic of the business. But they also had the greatest company-to-company variance, owing to their many different models. Life and health insurers had lower returns on tangible equity but less variance. (See Exhibit 7.)
An RoTE-decomposition model provides a more detailed picture of how insurers achieve their returns on tangible equity. Exhibit 8 shows results from the three-fifths of insurers in our sample with significant P&C revenues (the segment with the highest average five-year TSR). These 60 or so companies got roughly half of their returns on tangible equity from investments between 2016 and 2020. And they did this at a time when yields were declining—to about 3% on average.
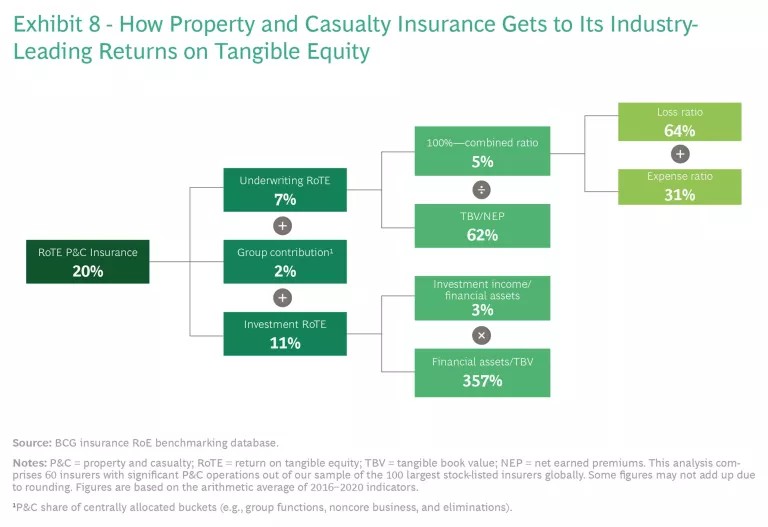
For individual insurers, the value of seeing RoTE components broken down like this, and expressed as industry-wide or segment-specific averages, is that it shows opportunities for change. In the case of one reinsurer with a healthy overall group RoTE, the decomposition highlighted some unprofitable underwriting pockets that were masked by the company’s otherwise high investment returns. In another situation, the decomposition prompted a P&C carrier to accelerate its move away from tied agents and toward independent agents and digital-direct sales.
The US-based life and health insurer Primerica (the number two company on our TSR list this year) is perhaps the preeminent example of an insurer that focuses on capital-light products. Savings and investment products, like mutual funds and managed investment products, helped give the company a 25% TSR in the latest five-year period, equal to 19 percentage points above the median.
Four Insurance Archetypes
A close look at the top performers’ business strategies reveals four successful archetypes.
The Data Analytics Standard-Bearer. The insurance industry hasn’t generally been on the leading edge in its use of data and analytics. This is not because insurance companies don’t have access to data—they do. But there are reasons, some regulatory, as to why insurers have been slow to transform their analytics approach despite the many ways they could. The insurers that have gone further—and done the most—have ended up with a big advantage.
A close look at the top performers’ business strategies reveals four successful archetypes.
No publicly traded insurer exemplifies this advantage like the US insurer Progressive, the number one company on our list, with a five-year TSR of 29%. Progressive, which dominates the US market in personal auto insurance, is one of the top insurers in matching risk to capital, in pricing, and in targeting prospects digitally. Among insurance companies, it stands out for its consistently profitable growth. As long as Progressive maintains its leadership in data analytics, its business will effectively be future-proof.
The Diversified Cash Generator. Diversified cash generators run their businesses in ways that allow them to make and uphold payout commitments to shareholders. One aspect of diversification has to do with product lines—which generally span both life and P&C businesses. The other aspect is geography; the companies that exemplify this archetype tend to operate in multiple countries.
As noted, being diversified in insurance is not necessarily a ticket to success—sometimes it’s the opposite. So, it’s no surprise that the companies that make this archetype work (like Zurich, whose five-year TSR of 18% makes it the sixth best-performing insurer on our list) generally take a very active portfolio management approach. They have strong performance management processes in place and are well-disciplined in their capital allocation, which allows them to meet their dividend-payout commitments.
The Ecosystem Player. Is it always best in insurance not to venture into other companies’ terrains? The example of Ping An suggests otherwise. The number three company on our list, with a five-year TSR of 20%, has expanded beyond its insurance roots into adjacencies that include wealth management, health care, automobile financing, and real estate. Its enormous investments in technology (approximately $15 billion over the last decade) have enabled it to develop best-in-class APIs and consumer services that are in some ways reminiscent of social media companies. People get a fun experience and a certain amount of gamification from Ping An. That gives the company a level of customer engagement that is rare for an insurer.
Ping An’s emergence in China during the country’s own period of hypergrowth has certainly fueled the insurer’s investments and helped it succeed. But so has Ping An’s commitment to reinvention and innovation—values that other insurers could focus on too.
The Capital-Light Product Developer. This last archetype has arisen in response to one of the industry’s unchanging realities—the capital-intensive nature of the business. Capital requirements put a ceiling on the returns of many insurance contracts, notably long-duration businesses such as life insurance and liability. By offering ancillary products or capital-light businesses with lower reserve requirements (including asset management, wealth management, and home protection services), insurers can improve their profitability and RoTE.
Imperatives for Insurers in 2021 and Beyond
As the pressure to transform their businesses models increases, insurers should keep these four actions top of mind.
Embrace a bionic business model. Insurance has always been an information business, with data that is broad and deep being used to make decisions. But the industry’s reliance on data hasn’t put it in a position of technology leadership, nor have most insurance companies adopted a bionic approach.
Bionic companies combine technological processing power with human traits, such as creativity and expertise, to achieve advances in insight, productivity, and servicing. Done well, bionic isn’t about supplanting human roles, but elevating them. As an example, consider some of the steps taken by the pan-Asian insurer AIA Group during the pandemic. AIA China now uses WeChat to communicate with its agents and social media to support lead generation. The company has also recently developed a tool called Air Sign to help agents finalize policy sales without in-person interactions and introduced a variety of other platforms for handling remote sales. Other insurers likewise moved during the pandemic to hybrid models that could propel them to bionic modes of operating.
The bionic approach leaves behind the binary thinking that permeates insurance. In the past, insurance processes could be manual or automated—but not both. Customer experiences could be engaging or cost-efficient—but not both. Bionic models allow for the simultaneous deployment of technology and human-centered assets, making it possible to more consistently achieve high value at a low cost. Becoming bionic also creates the possibility for much more accurate risk assessment, a win that goes to the very heart of insurance.
Some insurers are aiming to drive smart automation, supported by embedded intelligence, across high-cost or high-frequency interactions. In underwriting and claims, automation (or simply a better use of data and analytics) can be used to lower costs related to simple risks. This can free up an insurer’s human assets for more important situations—such as the underwriting of a complex risk for a large commercial account—where judgment and expertise, not raw processing power, make the difference.
While the shift to bionic is necessary, it isn’t possible for all insurers to make an overnight step change in their technical capabilities. For many, the gap between the current and target state is just too wide. This doesn’t make the journey itself any less urgent. The key to bionic reinvention is to systematically capture learnings from the start. Over time, this makes it easier to fine-tune strategies. Insurers that don’t get started now (or that haven’t already started) will be at a disadvantage.
Optimize the investment function. With few signs that interest rates will rise soon, insurers are looking to add some riskier assets to their portfolios. In a recent Goldman Sachs survey, most insurers said they were planning to increase the overall risks in their investment portfolios in search of higher returns. Carriers have a wide range of options for generating a higher yield; they can increase their stock holdings, collateralized loan obligations, private equity, and private placements, as well as their ownership of infrastructure and real estate assets.
There’s no mystery as to why insurance companies would consider such moves. Even as they take steps to increase their investment income, carriers are also under pressure to capture efficiencies in their investment functions to sustain or increase RoTE. How to address those two imperatives simultaneously is the question.
The answer lies in a well-defined investment process supported by clear policies and governance. This includes clear definitions of carriers’ asset and liability management profiles; of their targets for absolute and relative returns; of the criteria for picking asset managers for different asset classes; and of the KPIs and processes they will use to actively monitor performance.
Insurers should focus on three specific aspects of the investment function.
- Rigorous make-versus-buy mechanisms are particularly important as insurers change their allocations and take on new asset classes. Internal and external asset managers should be required to compete to manage different parts of the portfolio. It’s critical to look at the management of private assets since this is not an area in which most insurers have deep experience. Among other benefits, the competition will motivate captive asset managers to improve their performance.
- A second key to sound investment performance is the communication of granular and specific mandates to asset managers. Such mandates include asset-specific benchmarks. Effective mandates also provide appropriate targets for different businesses and geographies, as well as guidance for the maturity and subordination of securities. Granular mandates avoid the many problems of soft mandates, including internal accountability issues and uncertainty over investment priorities.
- Finally, insurers should increase the emphasis on performance accountability and use IT support tools to improve their reporting. Performance attribution reporting is key to incentivizing all stakeholders in the investment process. The best systems look at three kinds of returns—accounting, total, and risk adjusted—to ensure that income, unrealized gains and losses, and risk taking are within specified targets. Achieving this requires technology and data systems investment.
Lean into M&A. After the pandemic hit, many people expected a slowdown in insurance M&A activity. Instead, there was a 3% uptick, despite economic uncertainty. Whether or not M&A activity increases again this year, the themes that drove transactions in 2020 remain in place—and are likely to accelerate.
The first theme is portfolio restructuring. The challenges of successfully managing both a P&C and life insurance business have pushed some multiline insurers to exit one or the other. Among the prominent deals in this category was the MetLife sale of its P&C business to Farmers, a Zurich subsidiary.
A second theme of the current acquisitions is capabilities building. Many of the sought-after capabilities in insurance are digital in nature, which explains the spate of deals involving insurtechs (such as American Family’s purchase of Bold Penguin and MassMutual’s acquisitions of the fintech platform Flourish in 2020 and the online annuity marketplace Blueprint Income in early 2021).
Finally, there have been deals based on needed scale and synergies. The desire for scale in the independent-agent channel explains Allstate’s $4 billion acquisition of National General Holdings. It also explains a lot of activity in the runoff market, where private equity firms have been increasingly active.
We expect these three themes to remain relevant over the next few years; well-capitalized players are in a great position to take advantage of market dislocations to turbocharge their inorganic strategies.
The ESG Imperative
Many insurers are still in the initial stages of setting their ESG ambitions and evaluating how to reach them. On environmental issues, in particular, there are some geographic differences, with European insurers typically ahead of the competition in other regions.
ESG has important implications for insurers’ investments, internal operations, and underwriting. The approach to ESG should thus be a multipronged one. All three of these areas are getting attention from the new Net-Zero Insurance Alliance, formed by AXA, Allianz, Aviva, Munich Re, SCOR, Swiss Re, and Zurich.
Climate is the area of ESG where insurers have articulated the clearest and boldest ambitions, with many of them vowing to have net-zero investment portfolios as early as 2040. A growing number of insurers have developed the expertise to assess the ESG soundness of individual investments on an ad hoc basis. Some insurers are going further and embedding an ESG-assessment capability into their investment processes to ensure that the decisions they make in this important area are consistent and systematic.
Insurers must find ways of driving toward net zero in their investments.
The tactical considerations are somewhat different for insurers that have large third-party asset management businesses and those that do not. But no matter their situation, insurers must find ways of driving toward net zero in their investments. Most insurers are making a combination of changes—including adjusting their strategic asset allocations, fine-tuning the mandates they give to asset managers (whether captive or external), and pulling back on investments in the worst-emitting sectors.
Some insurers are close to achieving net-zero emissions in their operations; others won’t get there for a decade or more. All insurers should consider reducing travel, lowering data center emissions, increasing green office space, and working with suppliers that adhere to tighter standards.
Underwriting is the new frontier when it comes to ESG in insurance. ESG-aware underwriting can be a process of exclusion—the phasing out of certain kinds of insurance, such as coverage for a fossil fuel energy company. It should also include new opportunities, like products that support customers in their transitions to greener behaviors. For instance, a personal lines auto insurer could carve out a position as the preeminent underwriter of insurance for electric consumer vehicles.
The “E” part of ESG is clear, but what insurers ought to do with the other parts of this emerging imperative are up for discussion. They should nevertheless pick some places where they can be differentiated on social issues too. Increasingly in the future, companies with the best ESG reputations will have advantages with investors, customers, and employees.
The world is gradually emerging from one of the biggest health and economic shocks in decades. Painful as it has been, the pandemic would have been even harder without the protection that insurance affords individuals, small businesses, large corporations, nonprofit organizations, and governments. Could anyone doubt the relevance of insurance today?
But it is a diverse industry, and not every carrier that has been doing good is doing well. On the contrary, there is a huge value creation gap between the companies at the top and those in the middle or at the bottom. The gap is widening as the winners take decisive actions and continue to invest in new capabilities. They have no intention of relinquishing their lead.
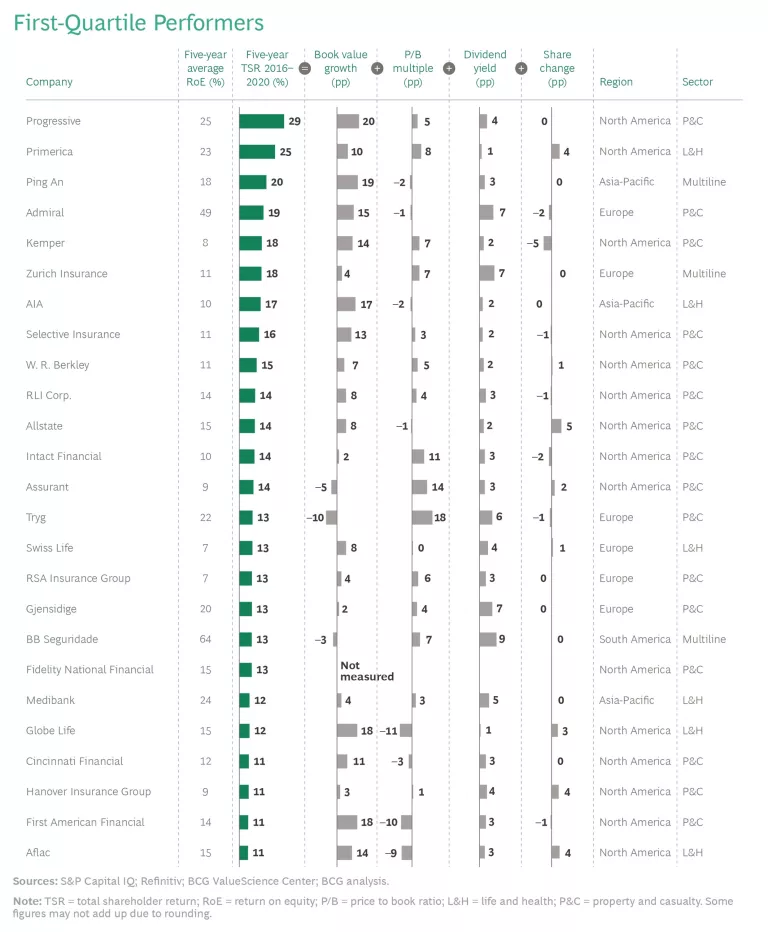
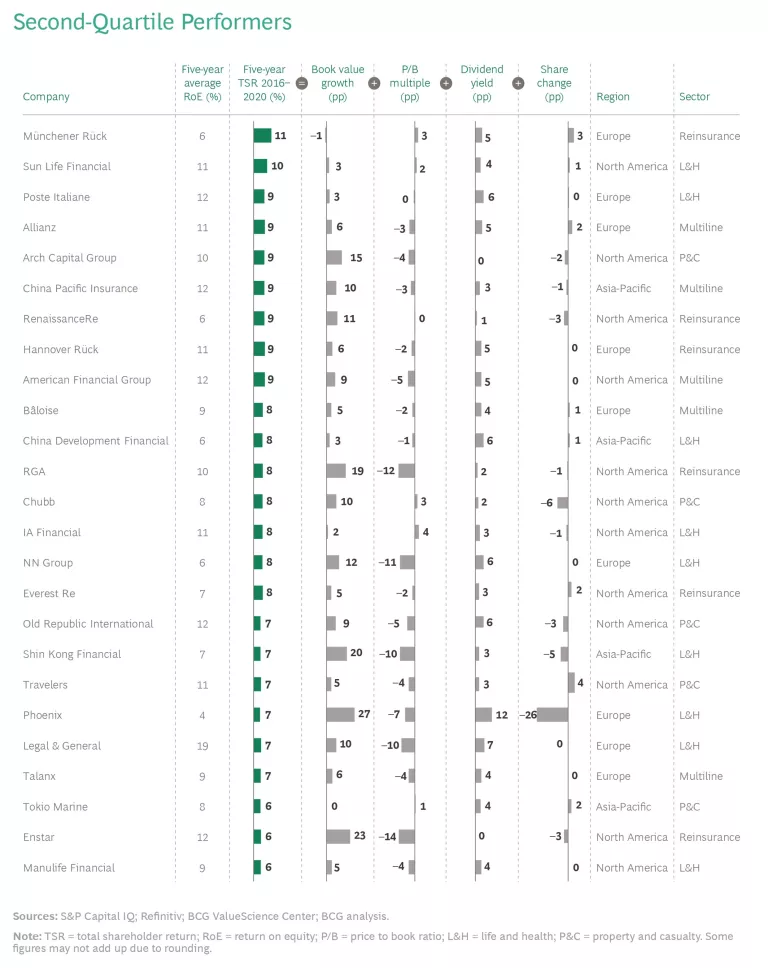
APPENDIX: First and Second Quartiles of Insurance TSR Returns Globally
The authors are also very grateful to Juergen Bohrmann, Martin Link, Ted Bonanno, Isabel Martinez Gaya, Filippo Novella, Nick Gagnon, Sebastian Kindlein, Virginia Barbieri, Tuvshin Tuul, Nitish Suddhoo and the BCG ValueScience Center for their assistance in the preparation of this report.
The authors are very grateful to Pia Tischhauser, Michael Bernaski, Lorenzo Fantini, and Rebecca Waddell. Their deep expertise was invaluable for the development of this report.


