What a difference five years make. In 2009, global equity markets were coming off the biggest decline in valuations since the Great Depression. Five years later, the companies in BCG’s Value Creators database delivered double-digit average annual total shareholder return (TSR) for the five-year period from 2009 through 2013.
Some readers may think that these strong returns are an artifact of the particular period covered by this year’s report. In other words, given that the market declined so much previous to this period, it is to be expected that returns would be especially healthy from such a depressed starting point.
That’s true—but only up to a point. When it comes to the period’s top performers, the story is more complicated—and more hopeful for any company that has experienced a period of below-average shareholder value. But before turning to the complications, let’s review broadly the basic results.
The World’s Top Value Creators
Just how good was the performance of the companies in the Value Creators database over the last five years? The average annual TSR for the 1,620 companies in this year’s sample was approximately 20 percent. The average annual TSR for the 26 industry sectors ranged from a low of 9 percent (in power and gas utilities) to a high of 35 percent (in fashion and luxury)—and all but one industry delivered double-digit average annual TSR. (See Exhibit 1.)
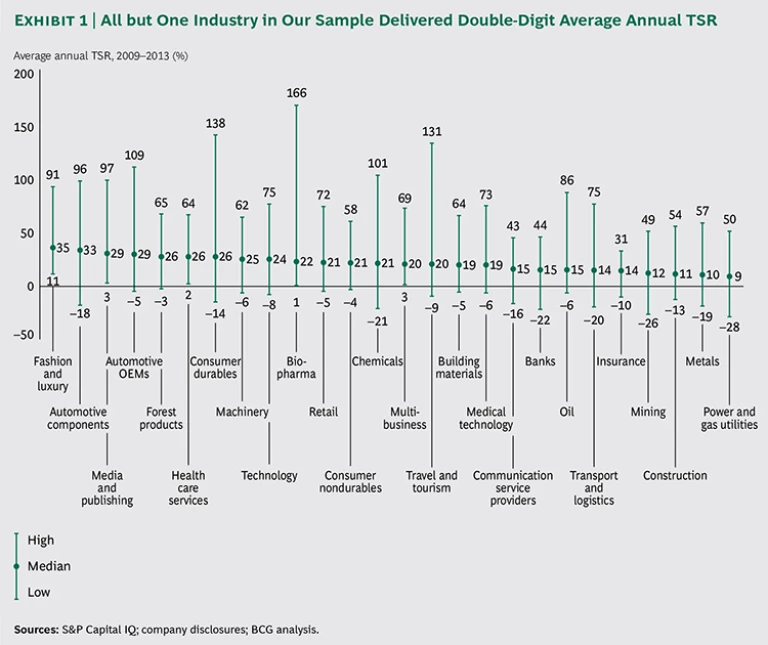
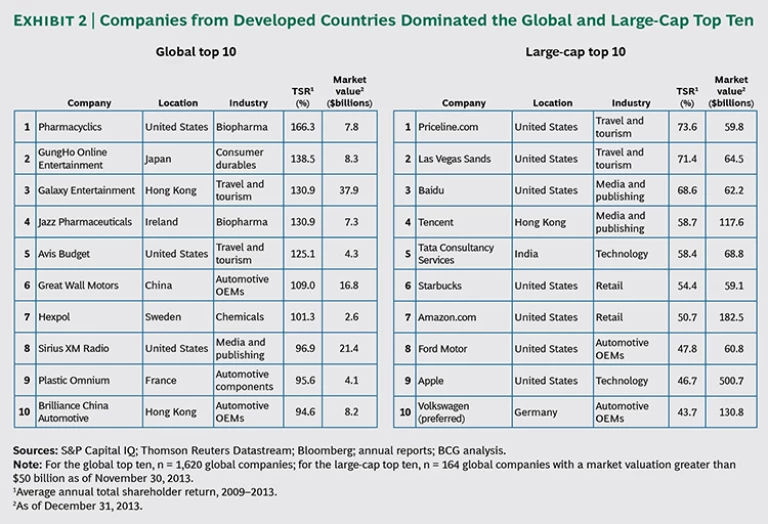
The leading companies in our sample, however, substantially outpaced not only their own industry average but also the total sample average. The average TSR of the top ten companies in each industry beat their industry averages by anywhere from 12 percentage points (in power and gas utilities) to 51 percentage points (in travel and tourism). The lesson for executives is this: being in a sector with below-average market performance is no excuse. No matter how bad an industry’s average performance is relative to other sectors and to the market as a whole, it is still possible for companies in that industry to deliver superior shareholder returns. What kind of TSR was necessary to achieve truly superior performance, given the sample average? A company had to deliver an average annual TSR of at least 31 percent to be in the top quartile of the global sample; between 18.6 percent and 56.4 percent, depending on the industry, to make it into the industry top ten; and at least 94.6 percent to make the global top ten. The most successful companies, seven out of the global top ten, delivered triple-digit average annual returns. And this year’s top value creator—for the second year in a row, the U.S. biopharma company Pharmacyclics—had an average annual TSR greater than 165 percent. (See the left-hand list in Exhibit 2.)
To put these results into perspective, this is the best performance of the top ten global companies in the 16 years we have been publishing the Value Creators report. The only two five-year periods in which the global top ten came close to generating equally high TSR were 1995-1999, at the height of the Internet bubble, and 2003-2007, when the market reached its peak before the 2008 financial crisis.
Unlike recent years, when companies from emerging markets dominated our global top ten, developed countries win the prize this year, with seven of the ten coming from the U.S., France, Japan, Ireland, and Sweden. When it comes to the world’s largest companies, six of the top ten are located in the U.S.—and a seventh, the Chinese Internet- search provider Baidu, is listed on a U.S. stock market. Leading U.S. large-cap value creators include Priceline.com and Las Vegas Sands, at number one and number two, respectively; retailers Starbucks and Amazon.com at numbers six and seven, auto company Ford Motor at number eight, and Apple (by far, the company with the biggest market valuation on our list) at number nine. (See the right-hand list in Exhibit 2.)
TSR Turnaround
Because the holding period of this year’s report starts in 2009, it’s important to ask, How much of the value creation performance of this year’s top value creators is due to these companies having been especially hard hit by the 2008 downturn, rather than to anything that they have done in the period since?
Exhibit 3 compares the performance of the 260 companies in our industry top-ten rankings with that of the roughly 35,000 companies in the MSCI All Country World Index. To capture the impact of the 2008 downturn, we created a TSR index in which the end of 2007 equals 100. As the exhibit shows, the MSCI index lost about 40 percent of its value in 2008. But the companies in our top-ten industry rankings lost even more—about 55 percent. In other words, at the beginning of the five-year holding period analyzed this year, the valuations of these companies were more depressed than the valuation of the average company.
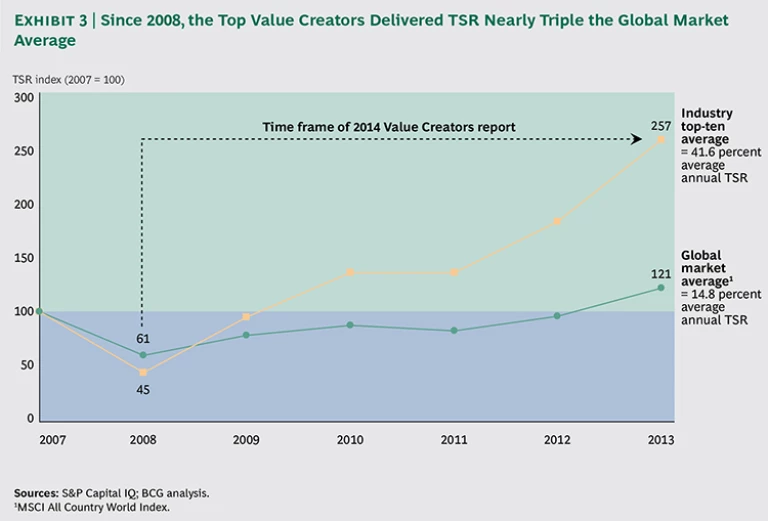
During the five-year holding period, the MSCI index went on to deliver approximately 15 percent annual average TSR. In contrast, our top-ten companies delivered about 42 percent—nearly three times as much. Of that 42 percent, we estimate that about 8 percentage points were the result of those companies’ lower starting point in 2008.
Put another way, about a fifth of the shareholder value that these companies generated during the five-year holding period was a function of their depressed starting point. The rest, however, was due to superior performance. One dramatic sign of this superior performance: whereas it took the MSCI index a full four years to win back the value destroyed in 2008, our industry top-ten companies had nearly done so by the end of 2009.
So although these companies benefited from an outsized market rebound, they obviously did a lot more than simply rise with the market. In fact, many of them achieved a comprehensive TSR turnaround. After an extended period of below-average value creation, they found a way to fundamentally transform their historical TSR trajectory and deliver superior value during the period of our study. To explore this phenomenon further, we decided to do some additional research this year to focus on the TSR-turnaround companies in our rankings.


