Today’s record-high valuations have game-changing implications for the importance of synergies. Synergies have always served to augment the case for an acquisition. In the current environment, they move to center stage, becoming the “make or break” element of the buy-side case. For every deal, it is essential to understand the different types of synergies, as well as the costs and the timeframe to achieve them. (See “The Basics of Synergies” and the related article from the 2018 M&A report, “Synergies Take Center Stage.”)
THE BASICS OF SYNERGIES
THE BASICS OF SYNERGIES
Synergies are the sources of improvement in earnings or cash flows (calculated as an annual run rate) that occurs when two businesses merge. By calculating the present value of the annual benefits and taking into account the expected time and cost to achieve them, companies can assess the potential for value creation above the simple sum of the parts.
Companies can achieve recurring revenue and cost synergies, as well as balance sheet synergies. (See the exhibit.)
Buyers can typically take concrete steps to capture cost and balance sheet synergies. But realizing revenue synergies is more complicated, and thus less certain, because a company must convince customers to continue doing business—or even expand their relationship—after the merger.
The timeframe for achieving synergies depends on many factors. Revenue synergies usually take longer to ramp up, while cost synergies can typically be realized relatively quickly. For global businesses, the complexity of integrating operations in multiple regions increases the time required to achieve synergies. Delays in decisions and activities that other initiatives depend on, such as strategic decisions about the headquarters location or rebranding, can lengthen the timeline. Progress can also be impeded if companies have pre-existing commitments to work councils about headcount levels. For the mergers covered in our data set, 70% of buyers estimated that they needed two to three years to achieve the full run rate of synergies. The average was 2.8 years.
The costs to achieve the full run rate of synergies are referred to as one-off costs or integration costs. These include both operating expenses and capex. For the mergers in our data set, estimated integration costs, on average, amounted to one full run rate of synergies. However, the integration costs for a specific merger depend strongly on the type of deal.
However, as buyers seek to convince their board and shareholders of the potential to extract more value from synergies, they face a variety of challenges. Although specifying synergy estimates at the time a deal is announced has a positive impact on share prices, the impact has diminished in recent years. Additionally, shareholders on the selling side are capturing a growing share of the value attributable to the synergies estimated near the announcement date. A review of these challenges sheds light on the scope of the problems that dealmakers face and points to a multifaceted solution.
The 2018 M&A Report
The 2018 M&A Report
- Synergies Take Center Stage
- Lofty Valuations Put a Spotlight on Synergies
- Elevating Synergies on the Board Agenda
Buyers Boost Synergy Estimates
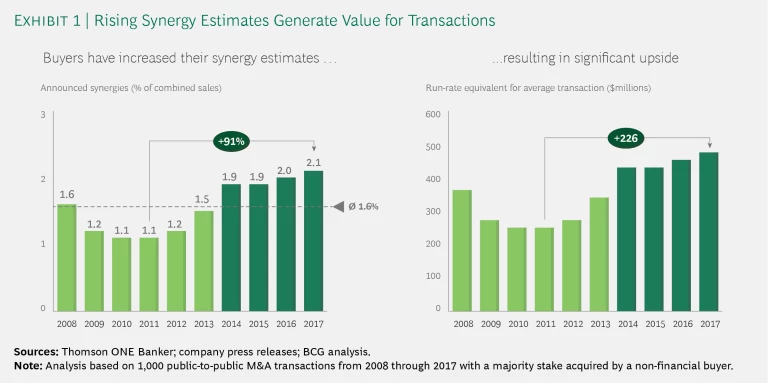
To determine if buyers are pursuing higher value from synergies, we collected a unique data set of the largest 100 public-to-public deals with corporate buyers for each of the past ten years. Within the full set of 1,000 transactions, roughly half of the deals included a synergy announcement. We found that the announced synergy estimates increased to a new high every year since 2013, exceeding the ten-year average of 1.6% of combined sales for each year. The most recent peak (2.1% in 2017) is almost twice the level announced in 2011 (1.1%). For the average deal in our sample, the 1-percentage-point increase in announced synergies translates into an increase in the targeted synergy run rate for pretax operating income of more than $200 million per year. (See Exhibit 1.) Applying the ten-year average EBITDA multiple of 12, this constitutes an implied increase in the enterprise value of more than $2.4 billion.
Synergy Potential Varies by Deal Type and Sector
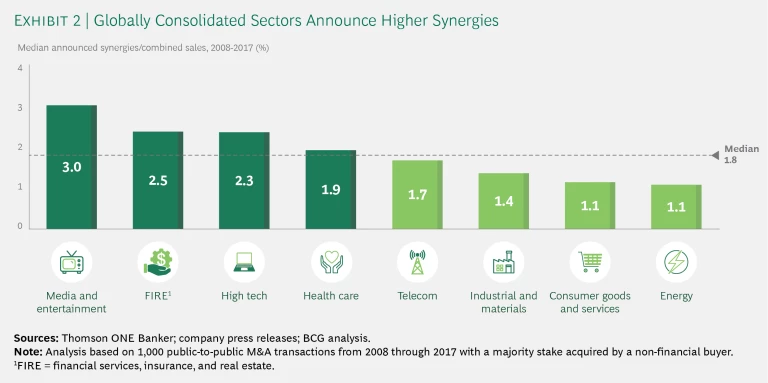
During the ten-year period studied, we observed significant differences among sectors. Globally consolidated sectors, such as financial services, insurance, and real estate (FIRE), health care, high tech, and media and entertainment, have announced synergies above the 1.8% median for all sectors. For industries that have seen less consolidation, such as energy and consumer goods and services, announced synergies fall below the overall median. (See Exhibit 2.) This finding reflects the fact that globally consolidated businesses are able to realize benefits of scale through, for example, creating shared-service centers and combining sales or procurement activities. In contrast, less consolidated industries often operate regional hubs that offer fewer opportunities to increase scale.
Meredith Corp.’s acquisition of Time Inc., announced in 2017, exemplifies the synergy potential of deals in the media industry. The combined company has sales of approximately $4.6 billion. It expects to realize $200 million to $250 million of pretax cost synergies within two years of deal closing. Most of the savings would come from cutting duplicative expenses related to overlapping corporate structures (such as sales organizations) and their obligations as listed companies (such as reporting and meeting requirements). Additionally, the companies expected to generate new revenue opportunities by distributing Time’s content through Meredith’s publishing platforms and television network.
In contrast, Royal Dutch Shell’s acquisition of BG Group, announced in 2015, illustrates why energy deals struggle to create synergies. Although the combined company has more than $300 billion in annual revenues, the initial synergy expectations amounted to only $2.5 billion. Because the companies’ exploration portfolios overlapped to only a small extent, the synergy potential was limited to modest reductions in overhead costs and exploration expenses. Such limited synergy potential often occurs in mergers involving companies with location-specific infrastructure and services. These companies have few opportunities to relocate or shut down operations after a merger. Opportunities for revenue synergy are also limited in such deals.
The dominant type of synergy in a particular deal also depends heavily on the type of acquisition and the deal rationale. At one end of the spectrum are mergers of equals that have significant overlaps in business lines, product assortment, and regions served. In such deals, companies typically focus on achieving cost synergies to improve profitability. The overlaps provide various opportunities to capture high cost synergies. Similar benefits generally exist in transactions aimed at mitigating the impact of declining revenues. Cost reduction through merger is one of the most important ways to counteract revenue decline and promote future profitability and growth. For mergers of companies in a growing market, or for acquisitions involving complementary businesses, the focus shifts to revenue synergies. However, even in these deals, cost synergies still play a crucial role and are often the main rationale.
Markets Reward Synergy Announcements
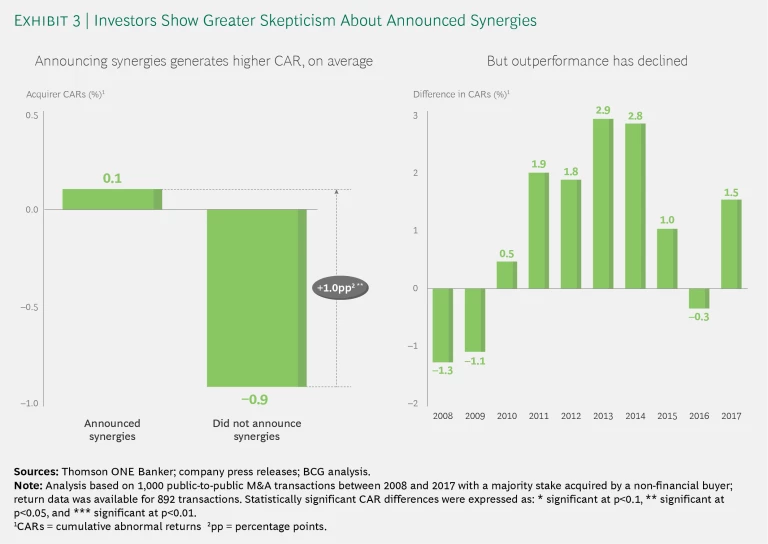
Markets generally welcome the announcement of synergies. Buyers’ CARs are 0.1%, on average, for transactions in which synergies are announced, compared with −0.9% for those without announced synergies. (See Exhibit 3.) A clear communication of synergies appears to be critical in preserving value and reducing share price volatility when a transaction is announced. This is in line with BCG’s previous findings on the importance of synergy announcements. (See “The Real Deal on M&A, Synergies, and Value,” BCG article, November 2016.)
However, buyers’ CARs in transactions with synergy announcements have decreased in recent years, reducing the difference between the CARs in deals with announced synergies and the CARs in deals without. The difference fell from 2.9% in 2013 to −0.3% in 2016 and then rebounded to 1.5% in 2017. The decline since 2014 appears to reflect investors’ increasing skepticism about companies’ ability to deliver on the higher synergies they announce.
The New Normal in Splitting Synergies: Buyers Get Less
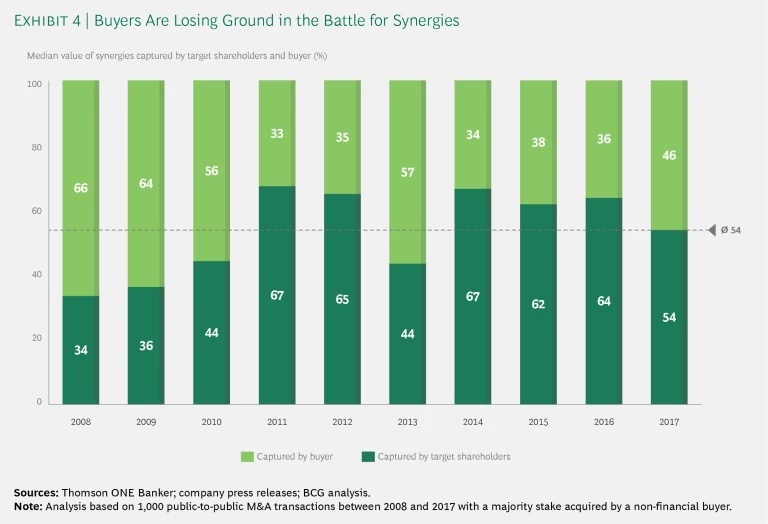
Over the long term, buyers have kept two-thirds of the value of expected synergies (See “How Successful M&A Deals Split the Synergies,” BCG article, March 2013). Their higher share of synergies compensated them for their responsibility to deliver the synergies after closing and for the associated risk. However, since 2007, the shareholders of target companies have captured, on average, 54% of the value of synergies, thanks to share price increases near the announcement date—before efforts to achieve the synergies even begin. (See Exhibit 4.) From 2008 through 2010, during and immediately after the financial crisis, the value captured by targets fell below the ten-year average. Since then, targets have generally captured value above the ten-year average. In a market characterized by a scarcity of acquisition opportunities, targets’ shareholders appear to be demanding a larger piece of the synergy pie.
Taken together, these findings make clear that it is more important than ever for buyers to extract maximum value from synergies. We discuss best practices for ensuring the accuracy of synergy estimates and communicating and capturing the value in the related article from the 2018 M&A report, “The 2018 M&A Report: Elevating Synergies on the Board Agenda.”


