A patient walks into a doctor’s office. He has severe back pain and is diagnosed with a herniated disc. Treatment options range from rest and physical therapy to invasive back surgery.
What the patient does not realize is just how much his treatment depends on the doctor he happens to see. A patient who visits one doctor can be up to five times more likely to receive surgery than a patient who visits another doctor. The option that will yield the better result is not always clear to the doctor, and this lack of scientific data on outcomes produces huge “practice variations” in treatment decisions–—with serious consequences in terms of health care costs and quality. This is a big problem not only for patients but also for payers, which end up footing the bill for what could be suboptimal care.
Back pain is just one example. Practice variation is commonly seen in the treatment of many other conditions, such as prostate cancer, and in decisions to perform such procedures as cataract surgery, cesarean section, and hip and knee replacement. Depending on where a patient lives and the doctor he sees, there can be more than a fivefold variation in decisions regarding hospitalization and surgery or other invasive treatments, even after correcting for differences in patient populations. The variation exists among countries, among regions within a country, among hospitals within a region, and even among doctors at the same hospital.
Payers—both public payers and private health insurers—are extremely well positioned to help reduce unwarranted practice variation. Payers have the data, the incentives, and the role in the value chain to make a difference. In our work with payers and our ongoing research in this area, we have looked at the underlying drivers of unwarranted practice variation and mapped out a strategy to help payers mitigate its effects and thereby to improve health care quality and reduce health care costs. By facilitating better decision making, payers can lower costs by €100 million to €200 million for every million lives covered, while at the same time improving patient outcomes. (This assumes an average health-care cost of €2,000 per individual covered for payers in the developed world.)
The Problem of Practice Variation
Variation in medical treatments, or practice variation, is very common.
Using this more conservative approach, we still found that treatment intensity for a given condition routinely varies by a factor of two or more among regions. For instance, a Medicare patient suffering from back pain who lives in Salt Lake City (a region in the ninetieth percentile for treatment intensity for back pain) will be 2.1 times more likely to receive back surgery than a comparable Medicare patient living in Napa, California (in the tenth percentile). And these differences are just as common and significant in other developed markets across the world.
These practice variations can be seen in the case of most diseases. The exception is where treatment is unavoidable, where the treatment choice is clear, and where differences in provider judgment are negligible, such as in hospital admission rates for hip fractures. However, these scenarios account for only about 15 percent of provided care.
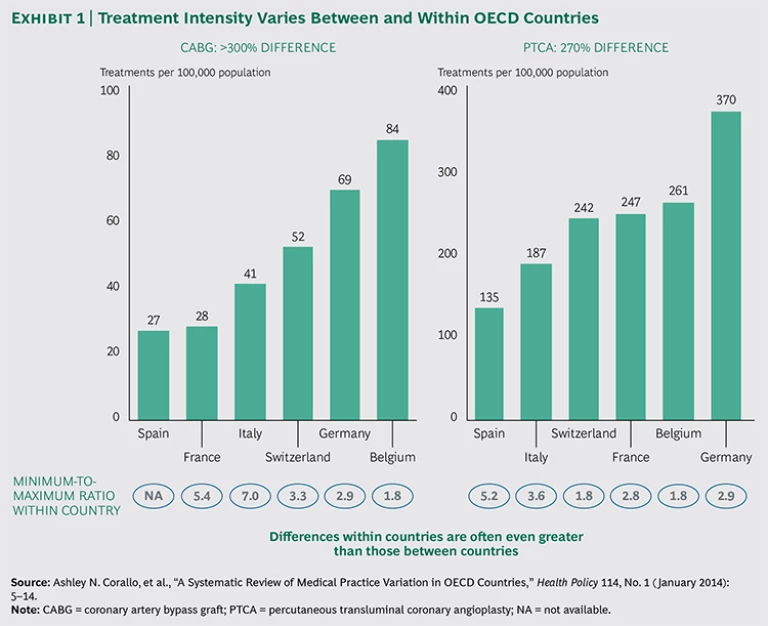
The 2014 Organisation for Economic Co-operation and Development (OECD) report Geographic Variations in Health Care confirms the existence of significant variations in treatment between and within 13 OECD member countries.
To gauge which measures can best be used to reap this potential, payers need to better understand what drives practice variation in the first place.
Certain cardiac procedures (such as coronary bypass and angioplasty) vary by more than threefold across countries—and even more across regions. For instance, the number of coronary artery bypass graft (CABG) procedures per 100,000 inhabitants in Belgium and Germany is more than twice that in France and Spain. The number of percutaneous transluminal coronary angioplasty procedures in Germany is twice as high as that in Italy.
Perhaps even more striking are the differences among regions within a single country. For every 100,000 people in some parts of Germany, for example, 45 patients will undergo CABG, whereas in other regions the number is nearly twice as high (87 treatments). In Switzerland, the regional variation in CABG treatment is more than threefold.
The OECD report shows similar variation for a number of other treatments, including knee replacements, cesarean sections, and hysterectomies. Knee replacement rates are four times higher in some countries than in others, and these rates can vary threefold across regions within a single country. This variation is not limited to surgical procedures; the report documents similar variations in diagnostic procedures (such as MRI and CT scans) and hospital admissions. The report’s conclusion: “While some of these variations reflect differences in patient needs and/or preferences, others do not. Instead, they are due to variations in medical practice styles, the ability of providers to generate demand beyond what is clinically necessary, or to unequal access to health care services. These unwarranted variations raise concerns.”
Substantial regional practice variation indicates overuse, underuse, or misuse of medical services. Patients who are over- or undertreated are likely to experience suboptimal outcomes. Overtreatment unnecessarily exposes them to the risk of complications and drives up health care costs. In the U.S. alone, overtreatment is responsible for an estimated $750 billion in avoidable costs each year.
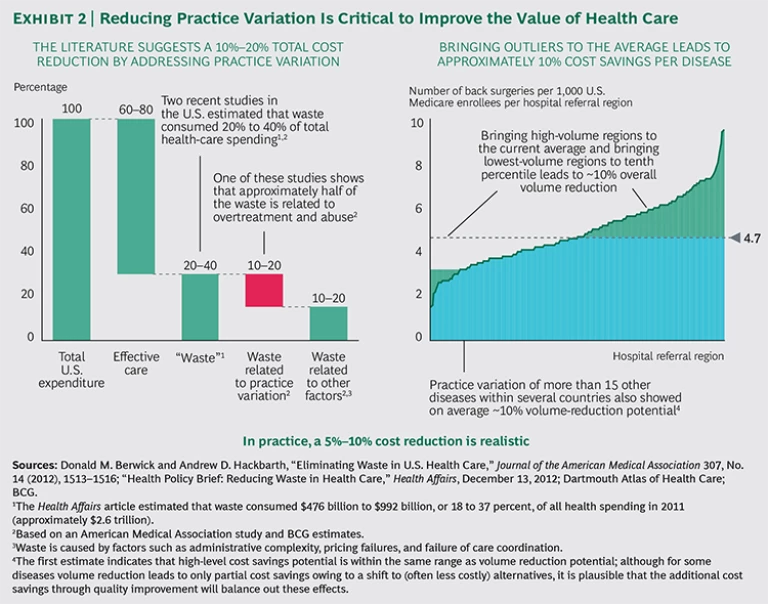
Our analysis indicates that a reduction in practice variation would lead to better outcomes, improved patient experience, and significantly lower health-care costs. Of the 20 to 40 percent of estimated “waste” in the health care system, practice variation accounts for approximately half. We also estimate that about half of that, or 5 to 10 percent of total costs, can be eliminated if payers systematically address practice variation. (See Exhibit 2.)
However, this does require payers to take the next step in their evolution from passive reimburser to active health-care facilitator. Through benchmarking data, they can analyze whether care is being delivered efficiently (high quality at a good price) and effectively (the right level of treatment). And they may even become active in prevention themselves (to reduce the need to treat). (For a look at the ways that leading payers have become more active in extracting value for their beneficiaries, see “The Shifting Role of Health Care Payers.”)
THE SHIFTING ROLE OF HEALTH CARE PAYERS
Payers have historically focused on a very narrow definition of their core business: reimbursement and administration of health care costs. However, some are now broadening their role to ensure that their members receive optimal outcomes for all spending. Leading payers are changing from passive health-care reimbursers to active health-care facilitators—and rightfully so. (See the exhibit below.) By focusing only on reimbursement and administration, payers can optimize just 3 to 10 percent of their business, but by addressing the value of care delivered, they cover the full scope of what they pay for on behalf of their members. Leading payers are becoming more active in three areas:
- Doing Things Right. They are demanding more value in delivery of care by assessing prices relative to the quality of treatment. This comparative data helps to inform discussions with providers and allows patients to better understand qualitative differences between providers.
- Doing the Right Things. Payers are also creating incentives for providers to make better and more consistent treatment decisions. This is the next frontier, where massive gains can be achieved by addressing overtreatment and undertreatment, and it is the focus of this report.
- Preventing the Need to Treat. Finally, payers are taking steps toward prevention. In theory, prevention represents the biggest prize of all, but in practice it is very difficult for payers to make headway on this front. However, a well-known prevention initiative, Vitality, sponsored by the health insurer Discovery in South Africa, has achieved excellent results by rewarding its members for healthy behaviors.
Doctors Often Have to Make Decisions in the Dark
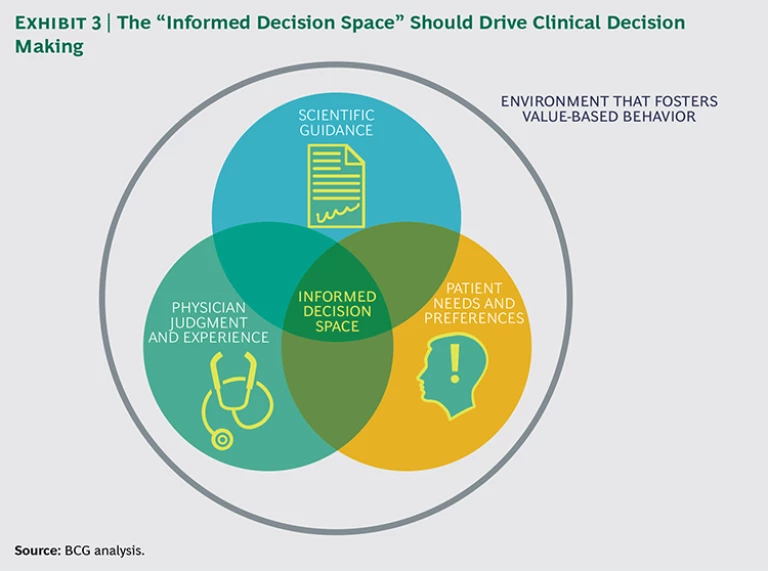
Optimal treatment requires informed decision making, for which three factors must converge: clear scientific guidance, patient involvement, and physician judgment and experience. (See Exhibit 3.) When these three factors come together, physicians make more-informed treatment decisions for their patients, diminishing unwarranted practice variation. It also helps to have a system with financial incentives in place to reward high-value care rather than high-volume care, though this alone is not enough.
Unfortunately, scientific guidance on optimal treatment choices is lacking for many medical conditions, patient involvement in decision making is limited, and doctors often have minimal insight into how their treatment choices and the outcomes of their treatments compare with those of their peers. As a result, the choice of treatment is based mainly on the individual physician’s education, judgment, and preferences.
Scientific Guidance on Treatment Options Is Lacking
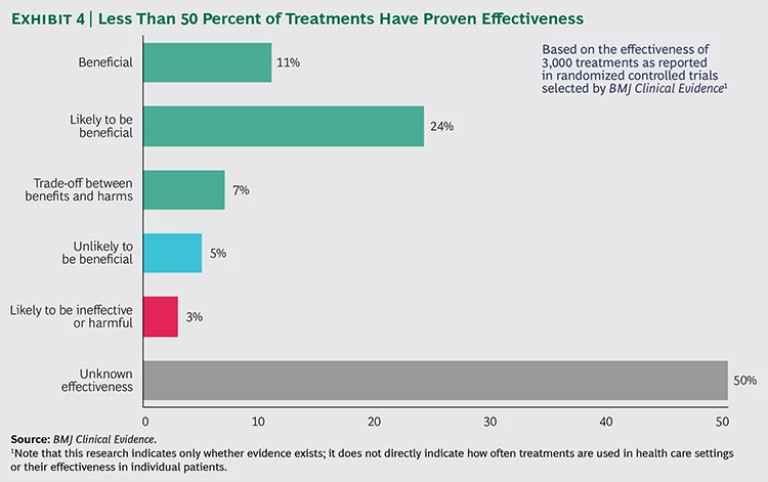
For many clinical interventions, the scientific evidence just doesn’t exist yet. Treatment guidelines may offer a menu of options and excellent advice on how to execute them—but little guidance on whether to do so. In a review of 3,000 interventions used to prevent and treat common clinical conditions, the journal BMJ Clinical Evidence found that more than 50 percent of these interventions were not supported by evidence of effectiveness.
In addition, providers have very little access to data on outcomes, given that the vast majority of metrics used in most health-care systems focus on processes rather than outcomes of care. If you ask urologists in virtually any country how often a prostatectomy to treat prostate cancer leads to incontinence or sexual dysfunction, only a few will have good statistics on their performance compared with that of their peers. If you ask how often a prostatectomy is chosen over a more conservative treatment like “watchful waiting” and how the outcomes (including complications such as incontinence and sexual dysfunction, as well as death) of the different approaches compare, even fewer will have the answer. At best, they will provide an estimate based on their own experience. This lack of clear, scientific evidence with which to guide treatment decisions contributes greatly to practice variation. Indeed, prostate cancer is one of the conditions with extreme regional practice variations.
Patient Involvement Is Limited
A patient may receive care from a doctor who takes the time to explain various treatment options and their advantages and risks, or the patient may simply be told that a specific treatment is needed. On the whole, patient preferences take a backseat to physician preferences when it comes to treatment decisions. In a survey of Dutch patients, 98 percent said they would like to be involved in clinical decisions, but in 63 percent of cases, patients were not even presented with multiple treatment options.
Often patients aren’t even aware that they have options. A 2014 Health Affairs article concluded that surgeon preference often trumps what’s best for patients.”
Physicians Rely on Individual Judgment and Preferences
Three main factors influence the judgment of providers as they make treatment decisions:
- Education, Training, and Experience. A 2012 Dartmouth Atlas Institute report found that the practice of medicine varies widely across medical centers, even in those affiliated with medical schools, where best practices should lead to a more uniform approach to treatment. The report concludes that resident training reflects the unique practice style of the teaching hospital, and the care that patients receive reflects that same practice style.
8 8 Anita Arora and Alicia True, What Kind of Physician Will You Be? Variation in Health Care and Its Importance for Residency Training, a report of the Dartmouth Atlas Project (October 30, 2012). - Available Capacity. Studies show that in hospitals with a high number of available beds, patients with conditions that do not necessarily require hospitalization have a greater likelihood of being admitted and spending an extended period in the hospital. The availability of hospital beds seemingly influences a physician’s decision (though perhaps unconsciously) about whether and when to admit and discharge patients.
9 9 E.S. Fisher, et al., “ Associations Among Hospital Capacity, Utilization, and Mortality of U.S. Medicare Beneficiaries, Controlling for Sociodemographic Factors,” Health Services Research 34, No. 6 (February 2000), 1351–1362. - Physician Preference. A 2013 working paper from the National Bureau of Economic Research grouped physicians into two categories: cowboys and comforters.
10 10 David Cutler, et al., “ Physician Beliefs and Patient Preferences: A New Look at Regional Variation in Health Care Spending,” National Bureau of Economic Research, Working Paper No. 19320 (2013). For severely ill patients, the cowboys routinely recommended intensive care, sometimes going beyond accepted guidelines, while the comforters consistently recommended more conservative treatment. The report concluded that 35 percent of end-of-life spending and 12 percent of total health-care spending is associated with physicians’ beliefs but unsupported by clinical evidence.
Financial Incentives Make the Problem Worse
Models of health care delivery and financial incentives for providers vary greatly around the world, and this can affect the treatment decisions of physicians and patients. For example, a 2013 BCG study showed that traditional fee-for-service reimbursement models in the U.S. led physicians to favor invasive care over preventive care. (See Alternative Payer Models Show Improved Health-Care Value, BCG Focus, May 2013.) This stands in contrast to HMOs and capitation models, in which financial incentives are more aligned between payers and providers. However, while delivery models and financial incentives undoubtedly play a role in clinical decision making, enormous variations in treatment decisions remain, even within the same system.
Health Care Payers Can Turn on The Lights
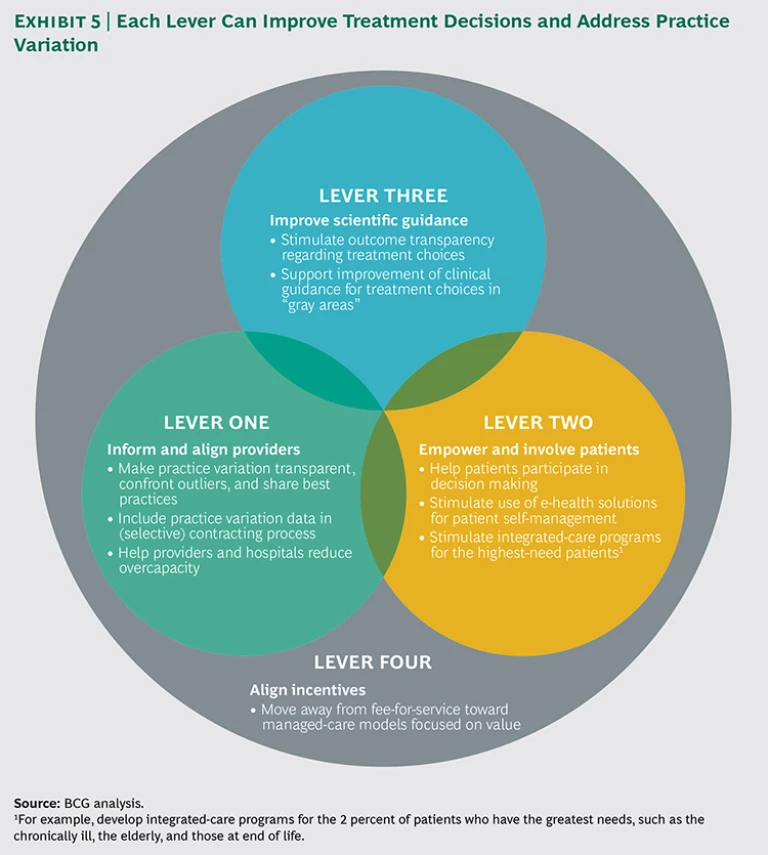
Health care payers, public and private, can shed light on unwarranted practice variation by analyzing and leveraging their huge and comprehensive data sets. This data can help create transparency of outcomes, inform providers on best practices, and guide contracting decisions. More generally, payers can use their unique position within the health care value chain to facilitate optimal treatment decisions and minimize perverse incentives that erode quality and value. We have identified four levers that can help reduce practice variation: inform and align providers, empower and involve patients, improve scientific guidance, and align incentives. (See Exhibit 5.) For each lever, we recommend several concrete actions that health payers can take.
Lever One: Inform and Align Providers
While payers have access to comprehensive claims data, most don’t use this data effectively. As a first step, payers should leverage this data to bring greater transparency to practice variation. On the basis of their findings, payers can identify outliers, share relevant data with physicians who overtreat or undertreat compared with their peers, and highlight best practices where possible.
Actions to Support Lever One
The following actions can be taken to inform and align providers.
Make practice variation transparent. Most payers already analyze claims data to identify intentional deception. Routine searches for bad apples are important—but bad apples are not the norm. The vast majority of overtreatment and undertreatment comes from physicians who are genuinely trying to do the best they can for their patients. But they don’t have access to benchmarking data. We believe payers are well positioned to leverage their data to achieve sweeping effects across the health care industry by making their findings transparent.
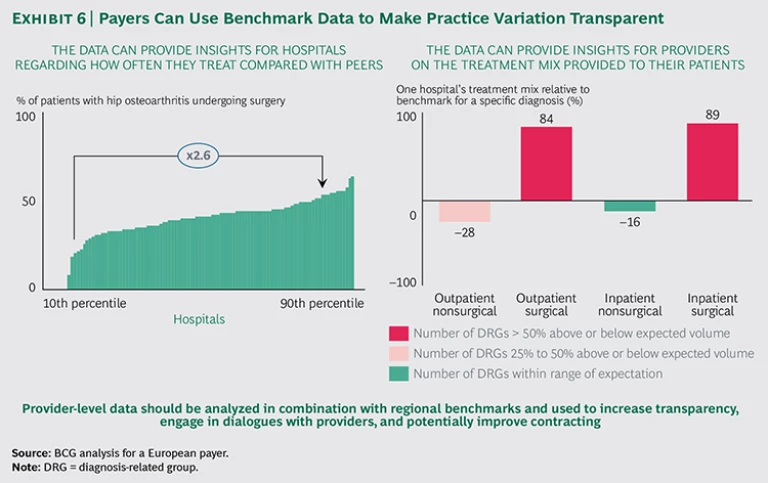
By systematically sharing benchmark data with clinicians who overtreat or undertreat relative to their peers, payers can engage in one-on-one dialogues or joint discussions with providers. (See Exhibit 6.) BCG has supported payers in data analysis and physician discussions; in the vast majority of cases, physicians had little to no prior insight into practice variation. They often did not know how they compared with other providers, and some were shocked by the data. As a result, physicians benefit enormously from comparative data and—when the positioning is right—very much appreciate the opportunity to see how they stack up in comparison with their peers. In a setting where physicians are working with limited data on patient outcomes and have no way to compare their performance with that of their peers, these conversations can provide unprecedented insights.
An open dialogue with physicians who treat twice as much as their peers may reveal valid justifications for this behavior. Physicians with specialized expertise may attract a large number of patients from outside the region who require more invasive treatments, or they may treat a population that skews toward a particular age, gender, or socioeconomic status. Most explanations can be validated by the payer’s claims data (by conducting analyses on average patient-travel distances, for example).
Some providers may argue that more invasive treatments produce better outcomes. When payers ask providers to support this assertion by sharing outcomes, they shift the burden of proof to the provider and create a powerful incentive for providers to measure outcomes—an important step on the path toward improved health-care value.
Include practice variation data in contracting. This action is applicable only in markets where health payers have room to maneuver when it comes to contracting with providers. In recent years, we have seen a number of leading insurers use benchmarking data to compare providers on value (that is, outcomes divided by cost). Using this approach, they can selectively contract for specific treatments (by not contracting with hospitals that have the poorest hip-replacement outcomes, for example), actively steer patients to hospitals with the best outcomes, and even link their payments to the value delivered to patients.
Payers may also use other, more readily available data-driven insights. For instance, selectively contracting with providers based on minimum-volume thresholds can be a useful proxy for good quality. This is because there is significant evidence that high-volume providers often achieve better outcomes and lower costs per patient—owing in part to accumulated experience and increased efficiencies.
Help providers and hospitals reduce overcapacity. Overcapacity (such as the availability of hospital beds) has a significant impact on providers’ treatment decisions. When beds are available, physicians show bias toward admitting patients. Because hospitals need to fill beds to cover fixed costs, there is also an institutional incentive to admit patients. If payers reduce the financial pressures on hospitals to fill beds, payers can help reduce unnecessary admissions.
Payers can also influence fixed costs for hospitals, thereby reducing pressure to fill beds unnecessarily. The majority of hospital expenses (60 percent) goes to employee salaries.
A Look at Lever One in Action
A leading European health-insurance company has invested significantly in recent years to become a leader in data-driven health-care procurement. The company regularly discusses with doctors their decisions about diagnostics, treatments, and the use of high-cost, branded medicines versus low-cost generics. They review data on regional, hospital, and individual levels and use this data when contracting with hospitals for specific treatments. Benchmark data on costs and quality protects them from contracting with low-performing hospitals.
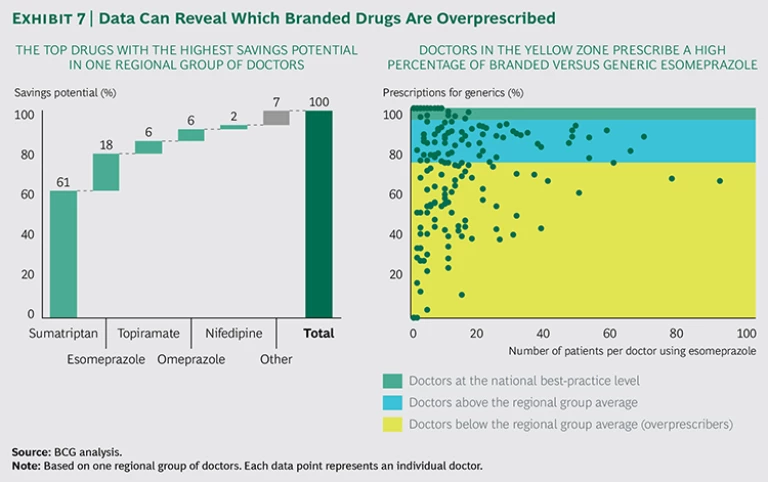
By shedding light on differences in prescription behavior among doctors, hospitals can realize significant savings while increasing the quality of care. Exhibit 7 illustrates how physicians vary in their prescription choices for branded versus generic drugs and the potential cost savings that would come from changing this behavior. By simply sharing this data, the payer achieved better financial results and higher awareness among doctors—without negatively affecting total patient care. In doing so, it improved the generic prescription rate for specific medications from 60 to 70 percent to more than 95 percent, leading to savings of more than €100 million in pharmaceutical costs.
Lever Two: Empower and Involve Patients
In choosing a course of treatment, doctors make countless judgment calls, weighing each patient’s unique medical history. Trained to battle disease and heal, doctors often have a bias to treat rather than to wait. Poorly informed patients and their relatives may also push a provider to do all that is possible, without fully understanding the risks associated with invasive treatments.
Deeply engaging patients in the decision process counterbalances the tendency toward overtreatment because empowered patients who understand the risks associated with various treatments typically choose less severe options than doctors would choose for them.
WHY PATIENT PREFERENCES MATTER : A CASE STUDY ON PROSTATE CANCER
In developed nations, prostate cancer is the most common cancer in men, and 3 percent of men overall in those nations die from this disease. However, an astonishing 50 percent of men who die from another cause have been living with prostate cancer meaning many more die with it than from it. That is, men over a certain age who have been diagnosed with localized disease are more likely to die from something else.
Physicians treating prostate cancer have a complex set of options. The most intensive treatment—prostatectomy—leads to better survival in many cases, especially for high-risk patients, but also runs risks such as incontinence and sexual dysfunction. Other treatment options (such as radiation therapy, chemotherapy, and hormone therapy) present a different set of risks and likely outcomes. Watchful waiting has much lower complication risks but a potentially higher mortality rate for specific groups.
Because individual preferences differ, it is essential that patients have the opportunity to consider how treatments will affect their quality of life. One patient may opt for surgery based on a strong desire to see his grandchildren grow up, while another may choose watchful waiting owing to a strong desire to avoid incontinence or sexual dysfunction. These preferences should be part of the treatment discussion.
Unfortunately, this is often not the case, as we can see from the high regional practice variation across and within countries. Dartmouth Atlas of Health Care data shows that prostatectomy rates in the U.S. vary by as much as 2.5 times (age-standardized and corrected for outliers) from one region to the next, and analyzing treatment mix reveals all kinds of variations, including emphasis on delayed treatment, emphasis on one treatment option, and an equal mix of all treatment options. (See the exhibit below.)
Tools to counteract these variations exist.
First, the International Consortium for Health Outcomes Measurement has developed a standard set—that is, minimum sets of outcomes and risk factors that it recommends all providers track—for localized prostate cancer. This tool provides an internationally agreed upon method for measuring outcomes that matter to patients, so providers and payers can compare performance globally and the impact of treatment choices on patient outcomes can be better understood.
Second, decision aids can be used to help patients weigh pros and cons. The National Health Service in the UK already provides Web-based decision-making tools for localized prostate cancer and these aids should provide up-to-date outcome data per treatment option.
Third, when providers actively solicit patient preferences, decisions are more in line with the patient’s life goals. Typically, this reduces costs as well, as patients tend to choose more conservative treatments.
The prostate cancer example shows how practice variation can be managed within a single patient group. In the future, international, data-based benchmarks, communicated through decision aids, may be used to engage patients in a sensitive treatment-decision process. This can consistently produce greater total health-care value at a lower overall system cost with higher satisfaction for individual patients.
Actions to Support Lever Two
We have identified three steps payers can take to more deeply empower and involve patients.
Help patients participate in decision making. Leading payers have begun to encourage the use of decision aids. Developed by leading physicians and supported by disease-specific patient representatives, these aids help patients better understand their condition, explore treatment options, and share their preferences.Some payers have started financing the research and development of these tools and reimbursing physicians who offer the aids to patients. For instance, the largest health plan in Hawaii sponsors statewide discussions on end-of-life treatments and reimburses physicians who show videos as part of their discussions of patient preferences. In doing so, they applied the fee-for-service concept more broadly, to reimburse not only treatment but also efforts to engage and inform patients.
Support e-health solutions for self-management. Enabling and encouraging patients to better manage their own health has huge potential, particularly in chronic care, where keeping disease under control prevents hospitalization. New digital technologies are already making a difference. In the U.S., for example, the Mayo Clinic piloted an interactive app designed to help patients rehabilitating from a stent procedure after an acute coronary syndrome. The app monitored their illness and taught lifestyle behaviors designed to avoid further cardiac issues. Patients who used the app had significantly better outcomes than patients in standard cardiac rehab, including improvements in body weight, blood pressure, and quality of life. Rehospitalizations and emergency room visits were reduced from 60 percent to 20 percent.
Support integrated-care programs for the highest-need patients. Typically, the top 1 percent of patients with the highest claims account for about 30 percent of all care costs reimbursed by payers.
A Look at Lever Two in Action
Numerous providers around the world are developing tools, apps, and services to help patients participate more actively in their treatment decisions. Here are three examples:
- In the UK, the National Health Service ran patient surveys that revealed that 48 percent of inpatients and 30 percent of outpatients wanted to be more involved in decisions about their care. In addition, 24 percent of patients in primary care did not feel that their general practitioner effectively involved them in decisions.
19 19 Overview of Shared Decision Making, Newcastle Magic team. Consequently, the NHS website now provides aids to encourage shared decision making between the patient and the physician. The cataract surgery aid, for example, asks patients to agree or disagree with a number of statements and provides evidence-based information on risks and outcomes, enabling a system-wide improvement in patient-engaged treatment decisions. - In the U.S., pioneering payers are using digital technologies to support patient health directly. BlueStar, an app from WellDoc, helps type 2 diabetes patients manage their disease between office visits. As the first app approved by the FDA, it was assessed according to existing drug regulations, because no regulations existed for apps at the time. The app is now being prescribed by doctors and delivered via online pharmacies. Payers reimburse when the app is used by a patient. With nearly 100,000 health-related apps available today, and strong interest from consumers, this is clearly a promising area. Payers should help to advance the most promising online tools and work to ensure some standardization in this emerging practice area.
- Also in the U.S., Kaiser Permanente helps terminally ill patients with home-based palliative care. An interdisciplinary team manages patients’ symptoms and pain, provides emotional and spiritual support, and coordinates personal care and physical therapy. In a randomized controlled trial conducted at Kaiser Permanente Colorado and Kaiser Permanente Hawaii, 71 percent of patients died at home, rather than in the hospital, in accordance with their wishes (versus 51 percent in standard care).
20 20 R. Brumley, et al., “ Increased Satisfaction with Care and Lower Costs: Results of a Randomized Trial of In-Home Palliative Care,” Journal of the American Geriatric Society 55, No. 7 (July 2007), 993–1000. David Brumley, et al., “ In-Home Palliative Care Allows More Patients to Die at Home, Leading to Higher Satisfaction and Lower Acute Care Utilization and Costs,” Agency for Healthcare Research and Quality Innovations Exchange (March 2009). This reduced hospitalizations by 39 percent and cut emergency room visits by 33 percent, resulting in a 37 percent reduction in cost of care, or approximately $7,500 per patient. Interestingly, this program did not have a financial objective; it was developed solely to accommodate the preferences of this specific patient group.
Lever Three: Improve Scientific Guidance
We all want to believe that modern medicine is founded upon scientific methods and evidence-based guidelines. But studies indicate that clear scientific guidance on the best treatment options is unavailable for more than 50 percent of common clinical interventions. Even when guidelines exist, compliance can be remarkably poor. Some physicians view guidelines as incomplete; others are comfortable relying upon their own experience.
Actions to Support Lever Three
Payers have a role to play when it comes to improving this guidance by supporting greater transparency of outcomes and by sponsoring much-needed research to improve clinical guidelines.
Stimulate outcome transparency. Health systems throughout the world are just beginning to document variations in health outcomes; they are doing so through physician-led quality registries. Transparency into outcomes drives much better guidelines and compliance with them.
If this process is applied to all well-defined patient groups, the benefits can scale across all health-care categories and geographies. This is the objective behind the International Consortium for Health Outcomes Measurement (ICHOM), an independent, nonprofit organization that has led the way in defining global standards for outcomes metrics. (See “ICHOM: Making Value-Based Health Care Happen.”)
ICHOM : MAKING VALUE-BASED HEALTH CARE HAPPEN
Health care leaders around the world are increasingly committed to providing value-based health care. However, standardized metrics on patient outcomes for many common medical conditions still don’t exist. To fill this gap, BCG, Sweden’s Karolinska Institute, and professor Michael E. Porter of Harvard Business School jointly established the International Consortium for Health Outcomes Measurement (ICHOM; www.ichom.org). ICHOM is a not-for-profit organization that brings together many of the most experienced clinical experts in the world to establish standard sets of outcomes for the most important diseases.
At the time of this writing, ICHOM has developed 12 standard sets—for coronary artery disease, localized prostate cancer, low-back pain, cataracts, Parkinson’s disease, and more. By measuring outcomes based on the ICHOM standard sets, providers around the world will be able to generate data to help improve physician performance, drive quality-focused funding by health care payers, and—most important—improve patient outcomes. ICHOM supports implementation of these standard sets and will develop additional sets in the coming months and years. By 2017, ICHOM aims to have implemented standard sets for more than 50 of the diseases with the highest disease burden worldwide. In this way, ICHOM is working to improve patients’ quality of life worldwide.
Support improved clinical guidance. Health care payers have an important role to play in supporting academic research. This is especially important in the gray areas where the choice of treatment is not straightforward and clinical guidance is weak or nonexistent.
Today, 65 to 90 percent of clinical research on therapies is conducted or supported by the pharmaceutical industry—and this research is generally focused on assessing the effectiveness of a new medicine. This type of research has led to massive medical breakthroughs over the last several decades. However, to increase health care value (that is, to deliver better patient outcomes at the same or lower total cost for a given condition) research is needed to better understand how differences and unwarranted variations in treatments today ultimately affect patient outcomes. Some researchers have led the way in this type of research. An Australian team has demonstrated the impact of unwarranted treatments in several important areas, including overprescribing of antibiotics, unnecessary X-rays for low-back pain, and unwarranted total knee replacements.
By investing in R&D, payers can help lower health care costs while improving quality. And yet health care payers currently invest minimal funds in R&D (0.1 percent of revenues per year at best). Other industries typically spend 1 to 7 percent of revenues on R&D, and the pharmaceutical industry spends a massive 18 percent of its revenues on R&D.
A Look at Lever Three in Action
The examples below illustrate how registries improve scientific guidance:
- TASTE Trial inScandinavia. The Thrombus Aspiration in ST-Elevation Myocardial Infarction in Sweden (TASTE) trial demonstrated that the commonly used thrombectomy does not improve overall survival for a normal population of heart attack patients. The New England Journal of Medicine described the randomized registry trial design as “a disruptive technology, a technology that transforms existing standards, procedures, and cost structures.” Because this trial approach leverages existing patient registries, it enables analysis of real-world outcomes for a normal population of patients, supports randomization at a small fraction of total trial cost, and reduces time to access appropriate trial cohorts. This is an excellent example of leveraging existing outcome studies to challenge traditional science-based guidelines and to support their continuous improvement.
- Cataract Registry in Sweden. The cataract registry in Sweden identified patients at risk for postoperative endophthalmitis (PE), a debilitating surgical complication with close to a 50 percent risk of blindness. The registry showed that prophylactic use of antibiotics should be a standard procedure because it significantly lowers the risk of PE. It has also helped identify high-risk patients and now ensures that the most experienced surgeons handle these cases. As a result, cases of PE have declined dramatically in Sweden, to the lowest incidence levels worldwide.
24 24 Stefan Larsson, et al., “ Use of 13 Disease Registries in 5 Countries Demonstrates the Potential to Use Outcome Data to Improve Health Care’s Value,” Health Affairs 31, No. 1 (January 2012): 220–227, before print December 2011, doi: 10.1377/hlthaff.2011.0762.
Lever Four: Align Incentives
Most health systems currently have incentives that can drive up practice variation. In the fee-for-service model, doing more equates to being paid more. We don’t believe that greed is a main driver for practice variation—if it were, we would see a huge amount of overtreatment. But perverse incentives are not helping. Doctors who take the time to educate and inform patients—to encourage prevention, promote a healthy lifestyle, or share the possible complications of various treatments—are often not reimbursed for this effort.
Actions to Support Lever Four
It is crucial for payers to find smarter reimbursement mechanisms that align incentives with value-based health care.
Move toward managed care models focused on value. Health care systems around the world are taking cautious steps away from the fee-for-service model, focusing instead on payment models that align incentives (for payers, providers, and patients) with the value of the care delivered. Although this approach can increase risk for providers, it can also enhance their autonomy to deliver optimal care for the population. This can be done by bundling care (by charging one fee for all care required for a specific patient), using HMOs that better align the incentives of health insurers and providers, or implementing capitation (in which physicians are paid a set, risk-adjusted fee per patient in the population they serve rather than per procedure or service provided). In these scenarios, physicians are financially liable for any excessive spending but also able to benefit when they provide care at a lower cost.
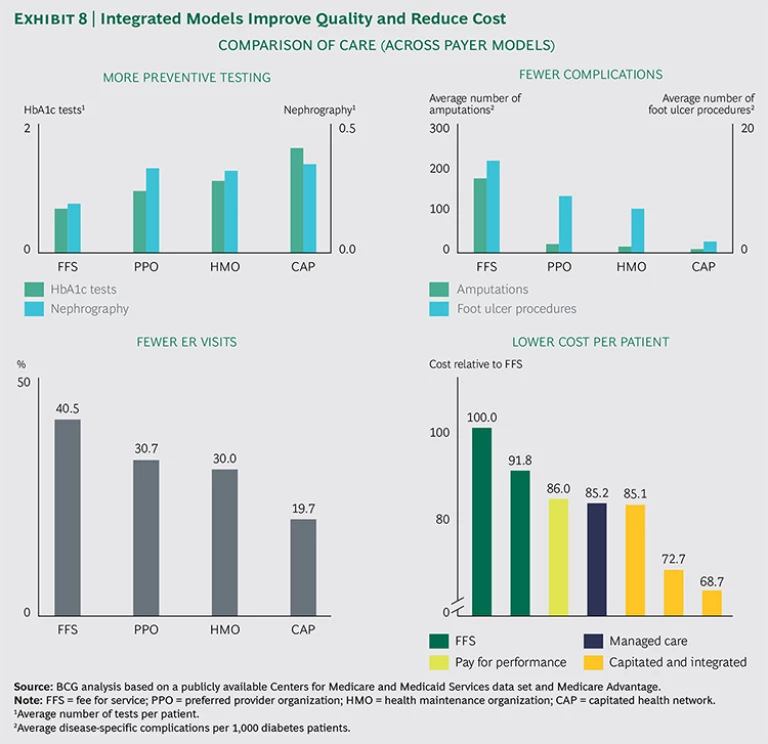
BCG analysis has shown that plans with higher alignment deliver higher-quality care than fee-for-service medicine, while significantly reducing costs. The impact can be very significant: proven higher quality and 15 to 30 percent lower costs. (See Exhibit 8.) We recognize that not all payers have the freedom to experiment with alternative reimbursement models, but payers should at least engage in discussions with regulators to create the room to experiment.
Decreasing Practice Variation—Where to Start
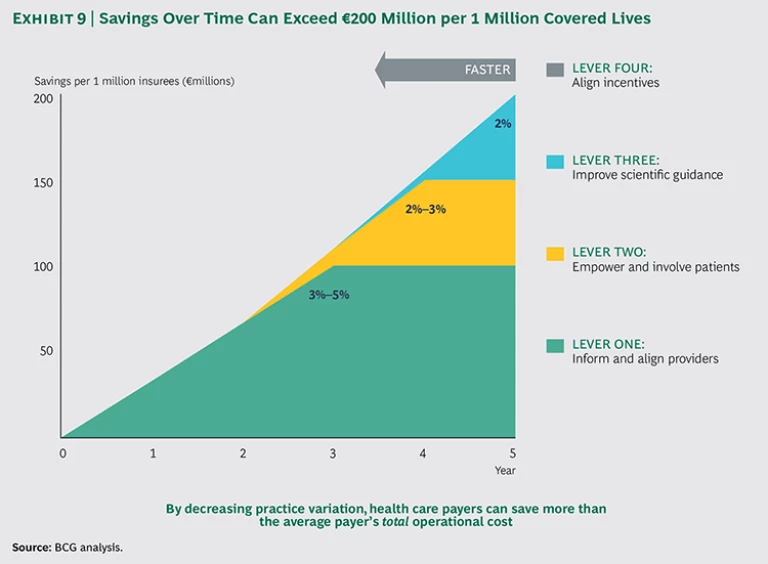
Although cost saving is just one of the benefits that will come from reducing practice variation (maximizing value to members is the ultimate goal), it provides a useful shorthand to illustrate the potential rewards for payers. We have seen that full implementation of the four levers can lead to savings of €100 million to €200 million per million covered lives over three to five years, or 5 to 10 percent of total health-care costs. Even for payers that implement just one or two of the levers, the impact can be very significant. Here is a breakdown of potential cost savings:
- Lever One—Inform and Align Providers: 3 to 5 Percent Cost Savings. By creating transparency, identifying suspicious cases, asking the right questions, and transferring the burden of proof from the payer to the provider, payers have achieved 3 to 5 percent cost savings. The goal is to help providers change their behavior (by sharing information with outliers and incentivizing value-based health care). If warranted, payers can steer patient volume away from physicians who are unable to improve their results or change their behavior.
- Lever Two—Empower and Involve Patients: 2 to 3 Percent Cost Savings. Well-informed patients tend to make less-invasive treatment choices, and providers are more likely to choose a conservative treatment when patients express that preference. Empowering patients can lead to additional cost savings of 2 to 3 percent. The overall benefit of patient empowerment extends beyond cost savings, given that patients will receive treatments that are fully in line with their personal preferences.
- Lever Three—Improve Scientific Guidance: 2 Percent or More Cost Savings. When clinicians have access to stronger scientific evidence and guidelines on diseases, they can direct patients to optimal treatment options, including less-invasive treatments and fewer complications. We estimate a 2 percent additional cost savings from improved scientific guidance after applying levers one and two. The benefits of this lever can be much higher if levers one and two have not yet been used to their potential.
- Lever Four—Align Incentives: Enable and Speed Up Potential from the Other Levers. As providers take greater responsibility for improving health care value and prioritizing cost-effective treatments, the payer can focus less on costs and team up with the providers to jointly maximize value. Providers focused on value will advocate for preventive care, engage more in innovation and clinical research, and take a more active role in ensuring that care is delivered in the most effective and efficient way.
Not all of these recommendations can be achieved in the short term. Levers one and two could lead to short- to medium-term results (one to three years), whereas levers three and four likely won’t deliver results for three or more years. (See Exhibit 9.) The precise savings over time will also vary depending on several factors, including market specifics (such as system dynamics and the level of trust between the payer and providers), the forcefulness with which the payer implements the levers, and the order of implementation. Nonetheless, it is important to make these investments now—and leading payers are indeed doing so already.
Develop a Strategy
Because every country has its own unique legal, cultural, and business dynamics, each individual payer’s strategy and market position will vary. There is no one-size-fits-all roadmap; however, a number of steps will be relevant for all payers when applying the levers to decrease practice variation:
- Decide where to focus your efforts. Based on your current market position, where can you most effectively create change? What restrictions need to be taken into account? Legal issues, for example, can make sharing risk with providers difficult. Or a payer with a low market share may have limited potential to selectively contract or introduce value-based reimbursement models.
- Prioritize care areas. Identify which diseases, patient groups, medical procedures, therapeutics, and diagnostics have the highest potential to improve outcomes that matter to patients and offer the largest potential in terms of reducing overall costs. Care areas with large practice variation and uncertainty regarding treatment choices are good targets.
- Define the levers that are most effective for each care area. Once payers have quantified the size and drivers of practice variation for a select care area, they should define the levers that can most effectively address overtreatment and undertreatment. For example, diabetes and other chronic diseases have more practice variation within primary care than secondary care and benefit greatly from patient self-management. On the other hand, surgical interventions (such as hip and knee replacements) benefit most from the levers that help patients participate in decision making and inform and align providers. Pushing on the “wrong” levers is not only ineffective, it risks undermining physicians’ trust.
- Establish short- and long-term goals. Organizations should distinguish between short-term levers that can yield tangible results within a one- to two-year time frame and longer-term levers that yield benefits on a three- to five-year horizon. Long-term strategies should be initiated in parallel with short-term strategies, because they take more time to yield results. Levers that inform and align providers and empower patients represent shorter-term goals, while improving scientific guidance and alignment across the system represent longer-term strategies.
Key Success Factors
Though every market is unique, certain key success factors will be relevant for payers in all markets, especially payers that seek to inform and align providers.
Invest in Data Analytics Capabilities
Payers have the data in-house to generate significant insights into provider behavior. This data is often not available to providers, so it is crucial to share it and thus allow them the opportunity to improve. With such large data sets, it is important to build the capability to analyze them well. Claims data can be segmented and analyzed to reveal how costs are split over different treatments and providers. By analyzing this data, payers can interpret differences in treatment intensity for specific diagnoses. For example, payers can identify doctors who most often opt for surgical procedures versus more conservative approaches for patients with low-back pain. It is important to adjust for population differences and any unique provider characteristics. Ideally, payers would build algorithms that can compare all hospitals for all treatments, automatically correcting for factors such as population and hospital type, in order to identify patterns that can be shared with providers and patients to help drive both tactical and strategic decision making.
Translate Insights into Compelling Materials
One of the main challenges we hear in our discussions with clients about practice variation is: Now that I know someone is an outlier, how do I actually change the behavior? A constructive discussion with providers about their behavior as compared with peers, even without “sticks or carrots,” delivers up to 50 percent of the savings. To be effective, it is crucial to develop and share clear and visually compelling benchmark discussion documents. Payer representatives must treat this as an open and constructive discussion with providers and be prepared to both acknowledge valid counterarguments and stand firm when counterarguments do not fully explain the behavior.
For situations where constructive discussion is not enough, payers can consider innovative contracting strategies, financial incentives, steering of patients, and other tactics that can help reduce unwarranted practice variation.
Build Trust with Providers and Patients
To effectively influence treatment decisions and reduce practice variation, payers need a sufficient level of trust from providers and patients. Without that trust, payers will make limited headway. Payers can build trust through the following strategies:
- A Focus on Value, Not Cost. When engaging with providers and patients, focus on achieving the best health outcomes, not just on cost containment. A one-sided harangue about the costs of overtreatment will alienate, while an evidence-based discussion about the perils of overtreatment and undertreatment can illuminate.
- Patient-Centered Levers. Patients are more likely to heed advice and use tools provided by someone they know and trust, such as doctors and patient advocacy groups; therefore, it is advisable to channel patient-centered levers using trusted sources and facilitate and reimburse to support this behavior.
- Provider-Centered Levers. Providers are likely to respond positively when presented with an opportunity to learn from benchmarking data—but not if their medical authority is challenged. Start with data transparency and give providers a chance to improve their performance before moving toward more strict measures (except, of course, in cases of outright fraud).
Reducing practice variation can have a major impact on the health care industry, but only if we are asking the right questions—and providing incentives for the right treatment. Quality of care is not simply a measure of how skillfully a certain procedure is done. Quality of care should also be defined by whether the procedure or treatment was necessary in the first place.
If we know that physicians in one region are doing twice as many surgeries for back pain as physicians treating the same condition in another region, we must ask which approach is in the patient’s best interest. How, without access to data on outcomes, can the physicians doing twice as many surgeries know if those procedures lead to better results for patients? And how are these physicians supposed to know that they conduct an unusually high number of surgeries in the first place?
The vast majority of overall health care costs are driven by physicians—and that is as it should be. But we also owe it to patients (that is, all of us) to ensure that decisions about which diagnostic test to run, which drug to prescribe, and which course of treatment to choose are driven by both the doctor and the patient and informed by strong scientific evidence—evidence informed by data on patient outcomes.
Public payers and private insurers have an opportunity to shine a bright light and reduce the darkness. Now is the time to step up.
Acknowledgments
The authors would like to thank their BCG colleagues Jennifer Clawson, Joachim Engelhard, Josephine Linthorst, Gabriel Osterdahl, and Neil Soderlund for their contributions to the research.