
The years since 2016’s seismic political events on both sides of the Atlantic have been surprisingly ordinary for the M&A market. Despite persistent uncertainty and a less favorable regulatory environment in the US, deal activity—in terms of both value and volume—remained fairly steady in 2017 compared with 2016. And the first half of 2018 brought abundant reasons for anxiety, as many feared that dizzying market plunges and escalating trade wars would suppress deal making. But a pullback did not materialize. Deal value in the first half of 2018 exceeded the first-half average for the period dating back to 2009. Somehow, dealmakers have not let themselves be diverted from their core pursuit.
The resilience of the M&A market is especially remarkable in the face of ever-increasing valuation multiples. Targets are, on average, more expensive today than they were in 1999, at the height of the dot-com bubble, or in 2008, shortly before the collapse of Lehman Brothers. Indeed, acquisitions are more expensive today than at any time observed in our sample of transactions dating back to 1990. Despite the frothiness, shareholders still support and motivate deal making. For five consecutive years, they have rewarded buyers with positive announcement returns—a major departure from the historical pattern. Along with steady investor support, deal making has been incentivized by a variety of other factors, including slow organic growth, the need to add digital capabilities, and the availability of cheap funding. In this environment, dealmakers seeking to convince their board and shareholders that an acquisition creates value have a clear imperative: prove that synergies justify a high valuation.
The 2018 M&A Report
The 2018 M&A Report
- Synergies Take Center Stage
- Lofty Valuations Put a Spotlight on Synergies
- Elevating Synergies on the Board Agenda
The 2018 M&A Report examines the trends that have moved synergies to center stage in deal making and how dealmakers and investors have responded. Analyzing a unique data set of the 1,000 largest public-to-public deals over the past ten years, we find that the synergy estimates in deal announcements have increased to a new high every year since 2013. Investors reward buyers that include synergy estimates in their announcements with higher returns around the announcement date. But their enthusiasm appears to be waning. Buyers’ announcement returns in transactions with synergy estimates have decreased in recent years, an indication that investors have become skeptical about companies’ ability to deliver on their increasingly bold promises.
Perhaps even more alarming, buyers are giving away a higher share of the total synergies in order to afford their deals. Historically, buyers have kept two-thirds of the value of expected synergies—their reward for bearing risk and shouldering responsibility for realizing the synergies after closing. In today’s seller’s market, buyers are keeping less than half of the synergy potential, with the remainder going to targets’ shareholders at closing.
Taken together, these trends have elevated synergies to the top of the board agenda at every company that is considering an acquisition. Board members and executives must have a clear understanding of whether the anticipated synergies are realistic, the time frame and approach to realize them, and how to communicate them to the market.
Dealmakers Keep Calm And Carry On
M&A activity remained healthy in 2017, despite being a bit of a mixed bag. Deal value was in line with 2016, but fell 27% from 2015’s record level. Part of the reason was the decline in the number of megadeals (those valued at $10 billion or higher), which dropped more than 50% from 2015. Although the number of very large deals declined, the total number of deals held steady. About 36,000 deals were announced in 2017, in line with 2016 and still above the long-term average. (See Exhibit 1.)
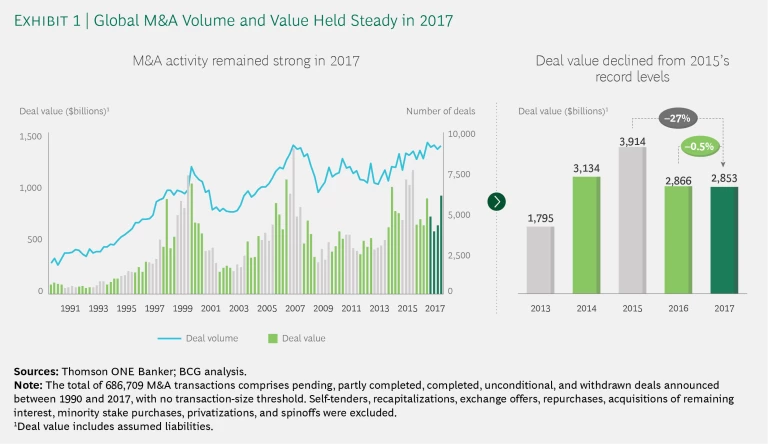
The mixed results may signal that uncertainty about the political environment diverted some executives’ attention from deal making. But the dampening was more like a steady drizzle than a heavy downpour. The modest pullback cannot be blamed on shareholders’ disinterest in deals. They rewarded acquirers with positive returns for the fifth year in a row.
Above-Average Deal Value in Early 2018
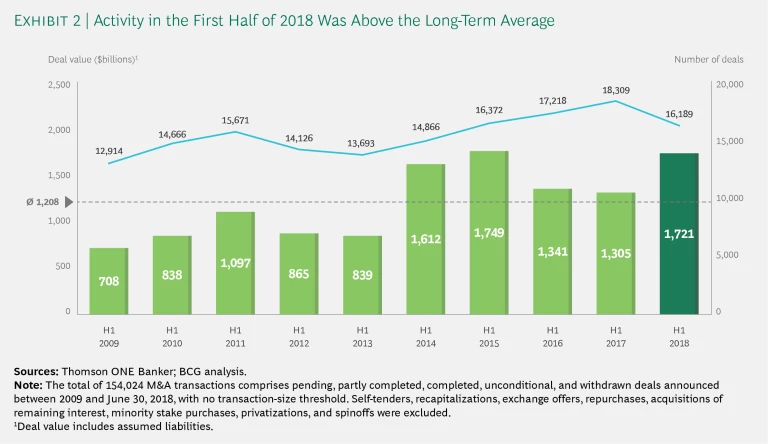
Unflinching investor support, along with still-cheap funding and slow organic growth, helped push global deal making to a rapid pace in early 2018. Indeed, deal value in the first half of 2018 was higher than the first-half average for 2009 through 2017 and only slightly below the first-half figure in the record-setting year of 2015. Total deal value was $1.7 trillion, with more than 16,000 deals globally. (See Exhibit 2.)
Megadeals helped drive the surge in first-half deal making. Buyers announced 22 megadeals, which is almost twice the historical average and the highest semiannual volume since 2015. Two megadeals were announced in the US business services industry: Cigna said it would acquire Express Scripts in a transaction valued at $69.8 billion, and Blackstone, together with co-investors, revealed plans to acquire the Financial and Risk unit of Thomson Reuters for $17 billion. In the food and beverage industry, Keurig Green Mountain announced its planned takeover of Dr. Pepper Snapple in a reverse merger transaction valued at $18.7 billion. In the telecom sector, T-Mobile US and Sprint announced their long-anticipated merger, with an implied deal value of $26.8 billion. In Europe’s energy market, the German electricity company E.ON said it would acquire a controlling stake in Innogy, a subsidiary of its competitor RWE. In the deal, valued at $19.3 billion, E.ON would transfer shares and parts of its renewable energy business to RWE.
Among 2018’s most notable deals was Walmart’s acquisition of the Indian e-commerce leader Flipkart for $16 billion, beating a bid by Amazon. This deal was seen as a major win for Walmart; the retail giant enhanced its e-commerce capabilities and achieved a greater presence in India’s emerging market. The transaction exemplifies a deal rationale frequently seen in 2018: in order to remain competitive and ensure future growth, major players such as Walmart are pursuing acquisitions beyond their traditional core capabilities and markets.
Corporate tax reform in the US is among the factors creating a favorable backdrop for deal making. (See “US Tax Reform Promotes Deal Making.”) Leading companies, including Apple and Microsoft, have already started to repatriate offshore cash to the US, as mandated by the new law. Because M&A activity is among the top uses for repatriated cash, deal making will likely receive a boost, at least to some degree.
US TAX REFORM PROMOTES DEAL MAKING
US TAX REFORM PROMOTES DEAL MAKING
US tax reform, enacted in December 2017 with the 2017 Tax Cuts and Jobs Act, incentivizes new investment patterns that have major implications for deal making globally. (See “The Impact of US Tax Reform on Corporate Strategy and M&A,” BCG article, February 2018.) The most significant provisions of the new law are a reduction in the corporate tax rate from 35% to 21%; mandatory repatriation of offshore cash, with a one-time tax of 15.5%; immediate expensing of investment in tangible business property; and new limits on interest deductibility of 30% of EBITDA.
There are five key strategic implications for business leaders:
- Higher earnings power will make year-end 2017 market valuations appear more in line with historical norms. For the S&P 500, the decline in effective tax rates (from approximately 27% to somewhere in the range of 15% to 18%) will bring an increase in earnings per share on the order of 12% to 16%.
- Lower taxes will increase the number of noncore asset sales—either direct sales or two-part transactions in which buyers acquire portfolios and then sell the assets they don’t want. At the old 35% rate, taxes forced companies to either live with their noncore assets or devise complex deal structures to avoid a big hit. Under the new 21% rate, after-tax proceeds from asset sales will increase by up to 22%, depending on the asset’s tax basis. With this change, deals can be assessed with greater emphasis on their business and financial merits and less concern for the tax bite.
- Increased corporate earnings power and quality, as well as liquidity, will help to stimulate investments and M&A. We expect that a significant increase in corporate liquidity—up to $4 trillion cash—will be unlocked through repatriated offshore cash and higher corporate earnings.
- Immediate expensing will have a positive impact on M&A in asset-heavy industries. The new law allows companies to expense the full purchase price of tangible assets in the year of purchase. For companies in asset-heavy industries, the value of immediate expensing could be up to 3% of the purchase price. This means buyers that are looking for a particular asset or business can much more efficiently acquire an entire company and sell off the pieces they don’t want.
- Because the tax cuts are not permanent, debate over the longevity of the new tax levels will inject new uncertainty into deal making. Asset values and capital allocation decisions are both affected by the prospective number of years that the law’s key provisions remain in effect. An assessment of the risk that the US will reinstate a less permissive tax regime should be a key component of corporate planning.
Taken together, the implications of tax reform point to the potential for a new wave of acquisitions and divestitures by US companies. Outbound M&A will increase as these companies put their repatriated cash to work, while lower taxes on the proceeds of asset sales make it more attractive to sell nonstrategic assets.
Notwithstanding the surge in activity, some dealmakers are concerned that the good times will soon be in the rearview mirror. High valuation levels, tightening monetary policy, changing regulations, rising protectionism, geopolitical worries, and volatility in capital markets are among the factors keeping them awake at night.
But even if a downturn occurs, executives should not regard it as a death knell for deal making. Our analysis shows that deals executed during economic downturns outperform those done during times of strong economic performance. (See “As Prices Peak, Should Dealmakers Wait for the Next Downturn?,” BCG article, March 2018.) Experienced dealmakers with a clear sense of the risks know how to capture advantages in times of uncertainty and a poor economic environment.
Four Major Trends
Economic conditions and sector dynamics are just two of the many factors that dealmakers must consider. The broader trends shaping the M&A market also play a crucial role in shaping decisions. Four trends stand out today.
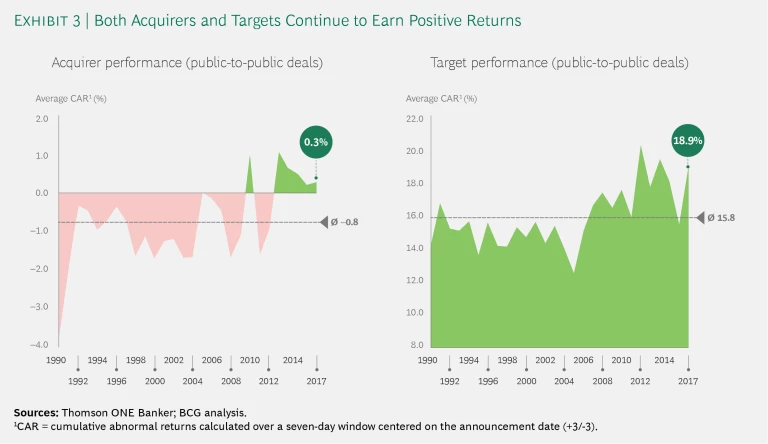
Investors place their bets on dealmakers. As noted, investors continue to buck the historical trend of punishing acquirers. Until recently, investors typically reacted to an announced deal by pricing the target’s shares somewhere near the bid price, while the acquirer’s stock fell on concerns of earnings dilution, poor fit, excessive diversification, or some other factor. For the past five years, however, the cumulative abnormal returns (CARs) of both targets and acquirers have been positive, indicating that investors are placing their bets on dealmakers. For acquirers, CARs centered on the announcement date reached an average of 0.3% in 2017, compared with the historical (since 1990) average of -0.8%. A CAR of 0.3% translates into a significant valuation lift for large buyers. For example, if Amazon’s acquisition of Whole Foods had resulted in a CAR of 0.3%, the e-commerce giant’s market cap would have increased by $ 1.4 billion. Targets saw their CARs reach 18.9% in 2017, above the average of 15.8%. (See Exhibit 3.)
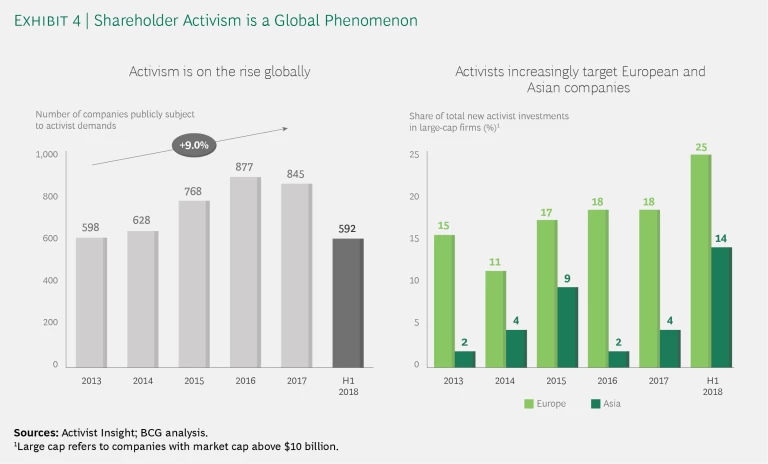
Shareholder activism is the new normal. Shareholder activism remained a prominent feature of the corporate landscape in 2017. Activists launched 845 campaigns globally, a slight decline from 2016. Activists continued to make their presence felt in 2018, initiating 592 campaigns through June 30. As of that date, the share of campaigns targeting large-cap companies (those with more than $10 billion in market cap) rose to 28%, a significant increase over the five-year average of approximately 20%. Even activist investors that take small stakes in large companies are making their voices heard.
Activist investments at European and Asian large-cap companies increased significantly in the first half of 2018. New activist investments in these regions accounted for 39% of the global total, up from 22% in 2017. (See Exhibit 4.)
Along with the shift in regional focus, we also detect changes in the activist agenda. Moving beyond traditional topics, such as corporate governance, approximately one in six activist campaigns focuses on M&A-related agendas. The increased attention to M&A agendas is most evident in Europe, coinciding with the uptick in activist campaigns.
For example, Elliott Management, one of the busiest activist investors, successfully pushed for higher offers from acquirers during the takeovers of NXP Semiconductors and STADA Arzneimittel. In other instances, activists’ demands included divestments (such as Third Point Partners’ demand for significant divestments by Nestlé) or dividing a company into smaller parts (such as RBR Capital’s campaign to break up Credit Suisse and Elliott’s similar efforts at Thyssenkrupp).
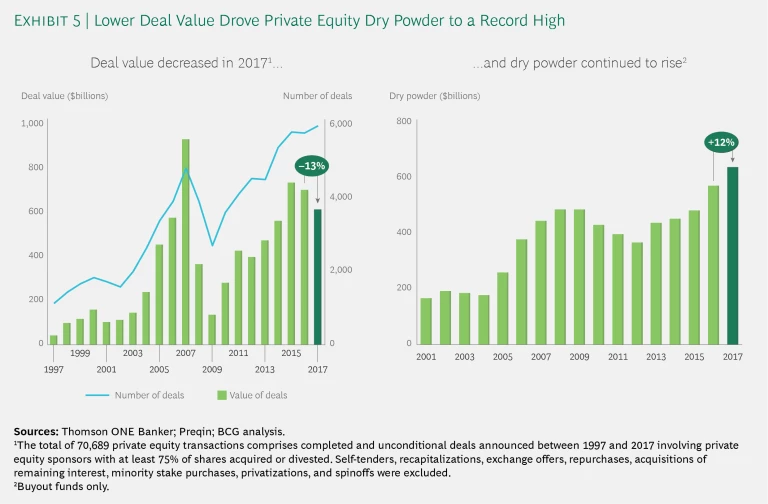
Private equity struggles to find attractive targets. The value of deals made by private equity (PE) firms in 2017 dropped 13% from 2016’s level. Reserves of dry powder increased by 12%, continuing the streak of annual records. (See Exhibit 5.)
Yet even as the value of PE deals declined in 2017, the number of deals (approximately 5,800) increased year over year, as did their share of total deal volume (16%). As a result, the average size of deals involving a PE firm fell by 16% compared with 2016. In the US, the share of the total PE volume represented by mid-cap deals (transaction value of $100 million to $1 billion) increased from 48% in 2016 to 62% 2017. In Europe, mid-cap deal volume as a share of total PE volume also grew significantly, continuing a strong upward trend. PE firms increasingly find themselves competing for attractive targets with other buyers, such as cash-rich corporate acquirers. In order to find attractive targets, PE firms seem to have lowered their target transaction size. They also increasingly engage in add-on acquisitions to their existing portfolio companies.
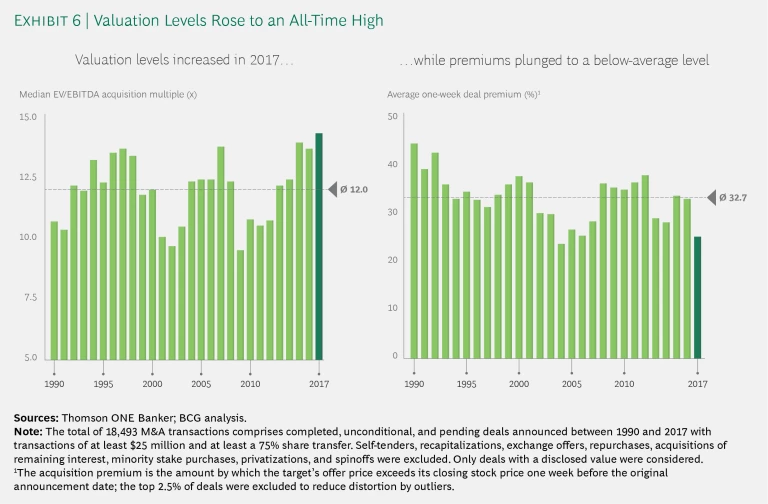
Transaction multiples keep rising. Steady investor support and PE firms’ high reserves of dry powder are factors that would normally foster M&A deals. So why did deal values decline slightly in 2017? An imbalance between supply and demand appears to be the most likely reason. Appealing large-scale targets have become scarce, and acquisition multiples have risen to record highs. The median transaction multiple in 2017 was 14.2 times EBITDA. This represents a 4.6% increase from 2016, in line with the 5% annual increase, on average, since 2009. At the same time, acquirers reduced takeover premiums, on average, from 32.4% in 2016 to 24.8% in 2017. As a result, acquisition premiums are significantly below the long-term average of 32.7%. (See Exhibit 6.)
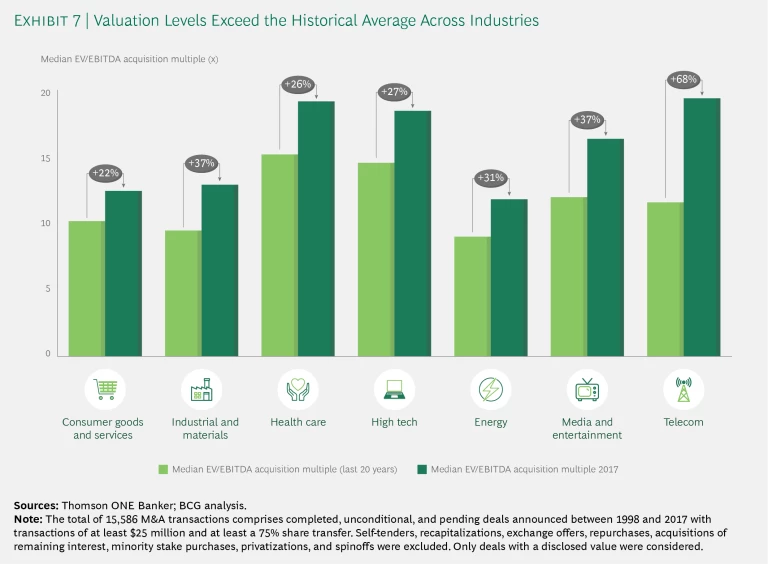
The trend of rising valuation multiples in M&A transactions was broad-based across industries in 2017; historic highs were reached in many business sectors. (See Exhibit 7.) In the telecom sector, for example, the median EV/EBITDA multiple for acquisitions exceeded the historical median by 68%. Financial institutions are bucking the trend. These companies face downward pressure on valuations as they cope with ongoing fallout from the financial crisis, low interest rates, and competitive pressure from new players, such as fintechs.
The high transaction multiples coincide with a strong bull market for equities. Even when considering the cyclically adjusted Shiller P/E ratio, valuation levels in the US and Europe increased above their respective averages. In US equity markets, the Shiller P/E ratio exceeded the average from 2014 through 2017. European equity markets are catching up. In 2017, the Shiller P/E ratio outpaced the historical average by a larger margin than in the preceding three years. (See Exhibit 8.)
With valuations rising to new heights, buyers must find ways to justify paying inflated prices for targets. Capturing more value from synergies is chief among the ways to accomplish this. We explore this imperative in the related article from the 2018 M&A report, “The 2018 M&A Report: Lofty Valuations Put a Spotlight on Synergies.”


