BCG's Six SBI Benchmarks
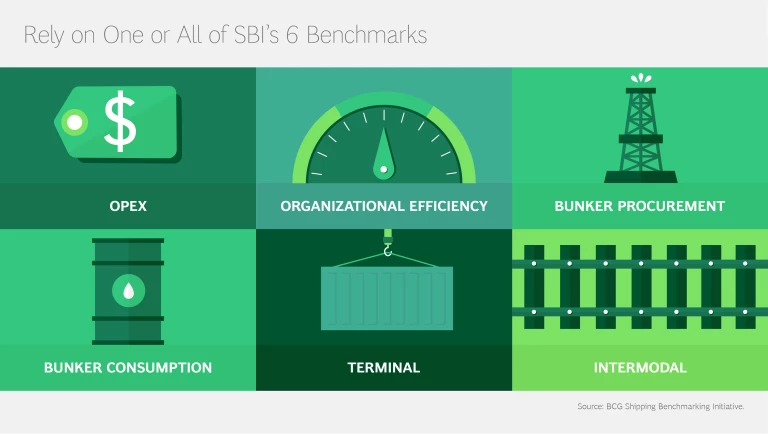
Vessel Opex
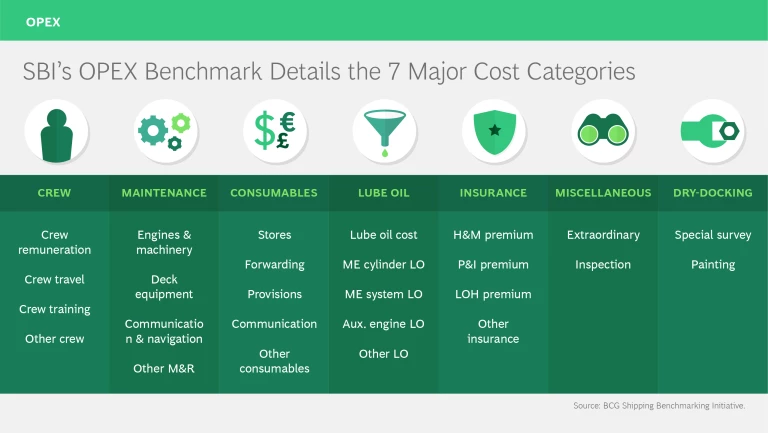
Learn how your operating costs compare to your competitors’ across more than 20 different categories.
BCG’s operating cost benchmark provides the detailed information you need about your fleet’s cost-competitiveness, providing specifics down to the vessel level. Whether you operate containers, dry bulks, tankers, gas carriers, or off-shore vessels, the Vessel OPEX Benchmark can tell you how your vessel operating costs compare to those of your competitors across more than 20 different categories.
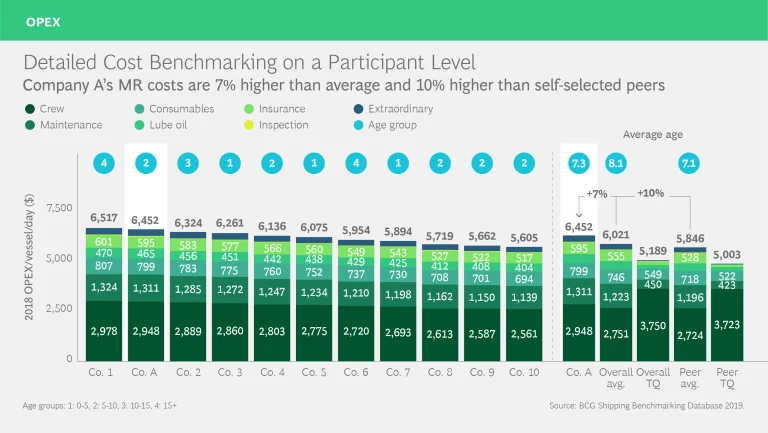
The benchmark enables you to see and understand how your fleet performs against fleets of comparable type, size, age, trading area, and more—both in the aggregate and at vessel level.
The Vessel OPEX Benchmark gives you a sense of the latest trends and developments in shipping costs. And it provides the tools you need to discover and examine unexpected cost deviations, which you can use as a data-driven guide to your next optimization projects.
With the Vessel OPEX benchmark, you will be able to see how the cost structures of the top-quartile performers differ from the those of the rest of sector, how the industry’s cost pressures are changing, and in which areas your costs seem to deviate from the average. These data will allow you to conduct an in-depth performance review of vessel classes, cost categories, and management practices, and target the places where improvements will have the most dramatic effects.
Carbon Emissions
Benchmark your carbon emissions performance and decarbonization strategy against your competitors.
The Carbon Emissions Benchmark offers a comprehensive view of your company’s decarbonization journey, including detailed analyses at vessel- and company-level. In accordance with the IMO CII regulation, the benchmark helps monitor your carbon emissions performance against your competitors and provides insight on decarbonization levers to focus on.
Whether you aim to position yourself as a decarbonization frontrunner, future-proof your operations for upcoming regulations, or simply to stay up to date with industry decarbonization trends, the Carbon Emissions Benchmark provides a comprehensive solution.
The benchmark is split into two dimensions to create a holistic view of your company’s carbon emissions. The quantitative, vessel-level dimension zeroes in on the AER, CII, and EEOI performance of your fleet while also offering detailed analyses on the underlying drivers of carbon emissions. The qualitative, company-level dimensions, based on a brief survey, focuses n strategies, investments, and enablers of maritime decarbonization. Participating companies receive a visually-rich, customized benchmarking report, complete with all relevant analyses per vessel class.
What the SBI Delivers
A Personalized Report
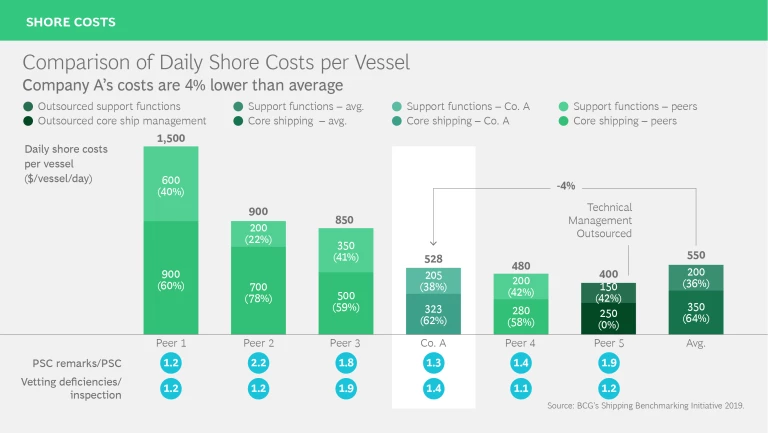
As a participant, you receive detailed analyses and clear graphic displays of your competitive position. You get company and vessel comparison on costs, segmented by size, type, age, trade, and more. Moreover, you receive in-depth analysis of the major underlying performance drivers, comparisons between your vessels’ performance and those of your competition, and a quality and sustainability analysis compared to your fleet’s cost level.
A Personalized Data File
SBI uses advanced digital technology to offer not just personalized reports but the tools to access the underlying data that goes into the reports. An easy-to-navigate interface allows your analysts to examine the data and conduct further analyses on their own.
A Tailored Executive Presentation
A structured face-to-face review of your key findings is designed to spark a provocative discussion with your management team. SBI analysts will also offer a number of insight-driven best practices and suggestions for cost-savings.
Advanced Analytics
Interactive dashboards built on Tableau and Alteryx include analyses on industry trends, cost developments, and more. They give you a user-friendly window into your business and help you decide whether you are doing the right thing with respect to day-to-day operations or longer-term investments.
Explore more
Shipping Industry and Marine Ports