
Developing the right products is mission critical for all software companies. And yet, for many companies, R&D spending is a black box. They allocate capital without a clear strategy and without the right metrics and governance to understand how that money is being spent. This approach impedes innovation and growth.
Without visibility into investments, companies are unable to measure R&D effectiveness. Consequently, they continually make poor capital and resource allocation decisions: companies overinvest in ill-conceived products and features that are not strategic and don’t translate into shareholder value, and they underinvest in promising areas that could help them capitalize on market opportunities. (Companies can use our proprietary tool to determine their R&D effectiveness.)
Best-in-class software companies are allocating more to R&D than ever before. Those growing the fastest typically spend more than 20% of their revenues on R&D and as much as 40% to 50% when trying to expand beyond their core products. At this scale, missteps can quickly erode a company’s shareholder value and its competitive position.
Best-in-class companies are allocating more to R&D than ever before. But missteps can quickly erode shareholder value.
To help software companies inject more rigor into R&D spending decisions, we created a measurement framework. It enables companies to improve how they allocate R&D capital and resources so as to boost company performance. But the measurement framework is only a start. Making innovation effective also demands a rigorous decision process—one that enables companies to balance and allocate R&D spending in a de-averaged way across products and engineering activities, gain visibility into spending using a holistic set of metrics, and ensure leadership oversight and governance. Such a stringent process enables a company to align its R&D spending with its strategy, continually rebalance and optimize spending, and maximize return on R&D investments.
The Drivers of Disruption
Several macro trends have contributed to the disruption in today’s $500 billion software industry. Significantly, software development is increasingly becoming democratized. Smaller companies can bring products to market faster and cheaper than ever before, largely owing to three advances:
- The mainstreaming of cloud-native applications; platforms as a service and infrastructure as a service together represent a market that is already roughly $100 billion, and yet it continues to grow by about 30% per year
- The sharp increase in the number of open source frameworks and tools and their swift adoption across the software stack
- The growing use of rapid application development and the implementation of low-code and no-code platforms
Also driving disruption is customers’ continued shift to software as a service (SaaS) and the “consumerization” of enterprise software. (SaaS is a $200 billion market, and it is growing at about 15% per year.) The SaaS business and delivery model has made software cheaper and easier to buy. At the same time, the model has enabled enterprise software vendors to deliver innovation more rapidly and iteratively. The result is a change in how companies buy software and their expectations. Now, individual business functions (such as marketing, HR, and procurement) are increasingly making the software-buying decisions—outlining software specifications, evaluating prospective solutions, and negotiating for features tailored to their individual organizations. These software buyers are also demanding a rapid time to value and a consumer-grade user experience.
To add fuel to the fire, a surge of private investment in enterprise software—$150 billion in 2018 alone—is giving early-stage and growth-stage technology companies the resources to take on larger competitors.
In this fluid environment, getting R&D investments right is absolutely vital. This holds true for large and small software companies alike.
To identify the industry’s R&D investment challenges, we studied software companies of various sizes that are at various levels of maturity. Our findings revealed that most struggle with three key questions:
- How should software companies assess the impact of R&D investments?
- How should R&D investments be allocated across products and engineering activities?
- How should software companies ensure leadership visibility into R&D spending and continuously rebalance it?
Introducing the Research and Development Index
Let’s tackle the first question: How should software companies assess the impact of R&D investments? Our analysis of 35 publicly traded software companies shows that the median R&D spending among high-growth companies is 26% of revenues. (See Exhibit 1.) High-growth companies, such as those in the cloud computing segment, tend to spend more on R&D than low-growth companies, such as those in the traditional middleware segment.
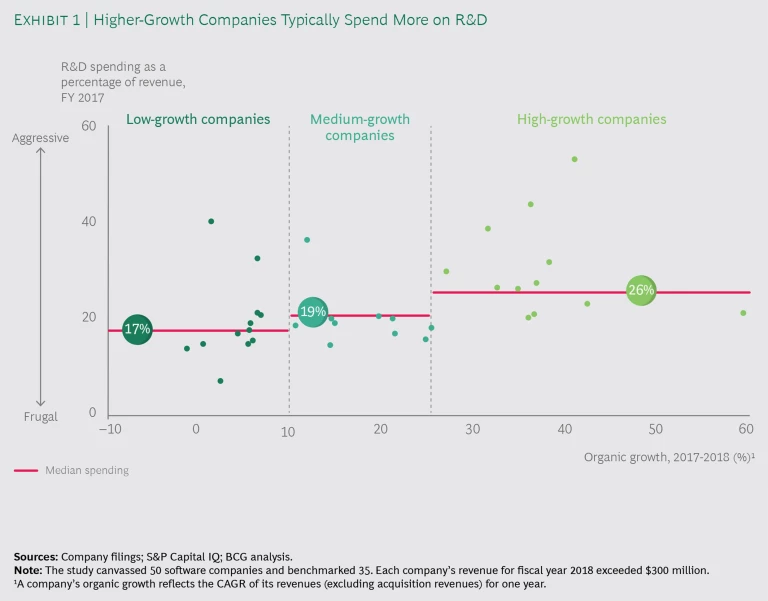
However, 26% of revenues shouldn’t be construed as the ideal, because each company’s market position, product offering, and R&D challenges are specific to it. (See “R&D Challenges and Pain Points.”) In addition, spending more isn’t necessarily better. So how should an individual company determine how much to spend?
R&D CHALLENGES AND PAIN POINTS
R&D CHALLENGES AND PAIN POINTS
In principle, companies need to do a few seemingly simple things to keep their software development on track: define a strategy so that leaders can set R&D priorities, determine where investments are being made and adjust spending as necessary, and establish metrics to measure outcomes and drive continuous improvement. In reality, most companies struggle for a variety of reasons that fall into six broad categories:
- No Clear Strategy or Overall Vision. Companies often lack a coherent innovation strategy and clear priorities. Without a guiding vision, companies tend to overinvest in core products that have driven growth historically but have limited potential for future returns. At the same time, they underinvest in newer products that have the potential to generate future growth.
- Insufficient Collaboration. Business unit leaders and budget owners sometimes resist coordinating R&D efforts to maintain their independence. But when business units work separately, they often waste resources by duplicating R&D efforts or prioritizing innovation that does not support company-wide efforts. Making matters worse, individual business unit budgets are usually too small to pursue significant innovation or keep up with the newest technology trends.
- A Lack of Transparency and Tracking. Sometimes business units resist R&D budget transparency to protect their budgets from scrutiny. Even when that’s not the case, however, it can still be difficult for companies to track R&D capital expenditures systematically, and often there’s no framework or process for tracking R&D operating expenses. As a workaround, some companies distribute R&D expenses across business units’ budgets. But the benefits of this approach are limited, because there is no clear owner with the insight, power, and accountability to ensure the investments are directed properly.
- Misaligned Incentives. Most incentives encourage employees to focus on near-term revenue, an approach that hinders mid- to long-term innovation. When choosing between an investment that will create incremental revenue next year or one that will have more significant revenue in five years, most business unit leaders will choose the former. Attempts to shift leaders’ focus are often frustrated because time frames are poorly defined. For example, what qualifies an innovation investment as near term, midterm, or long term?
- Legacy Technology. Many software solutions, particularly cash cow legacy products, are built on outdated technology platforms. Over time, significant technical debt accrues as a result of the costs to update and refactor these solutions in order to add new functionality and ensure consistent reliability. These required investments can be significant, taking away R&D funds that are critical to drive innovation in growth areas.
- Limited Innovative Culture. Successful R&D spending relies on an innovative culture and a forward-looking leadership mindset. Often, company cultures are too focused on legacy products and expertise that has historically resulted in success. Willingness to take risks and experiment in new innovative areas is often not rewarded—and, in many cases, even discouraged, owing to the inherent risk of failure.
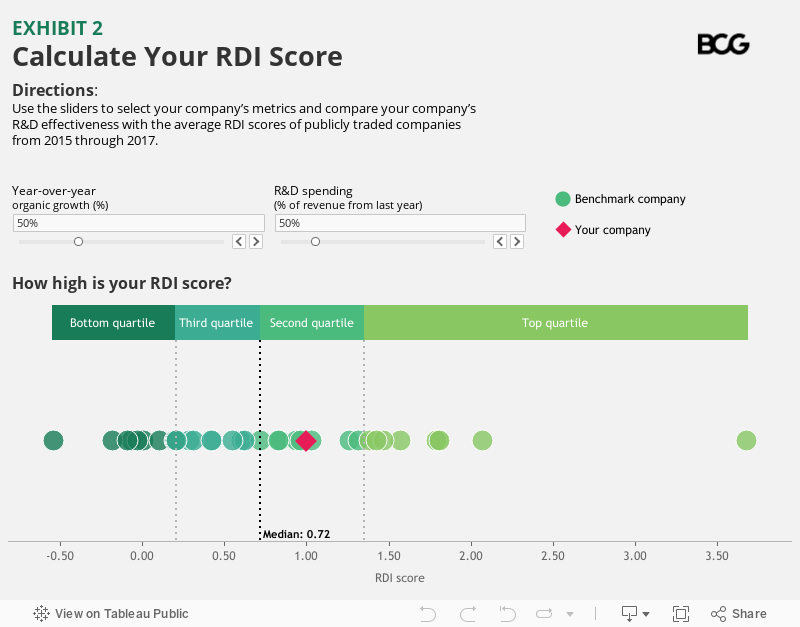
We developed a new metric—the Research and Development Index (RDI)—that reflects the impact of R&D investments on revenue growth. RDI divides the change in organic revenue (which excludes acquisition revenue) year-over-year for one year by R&D spending as a percentage of revenues during the first year. Best-in-class companies have an RDI score that is higher than 1.4, while the median score is about 0.7. (See Exhibit 2.)
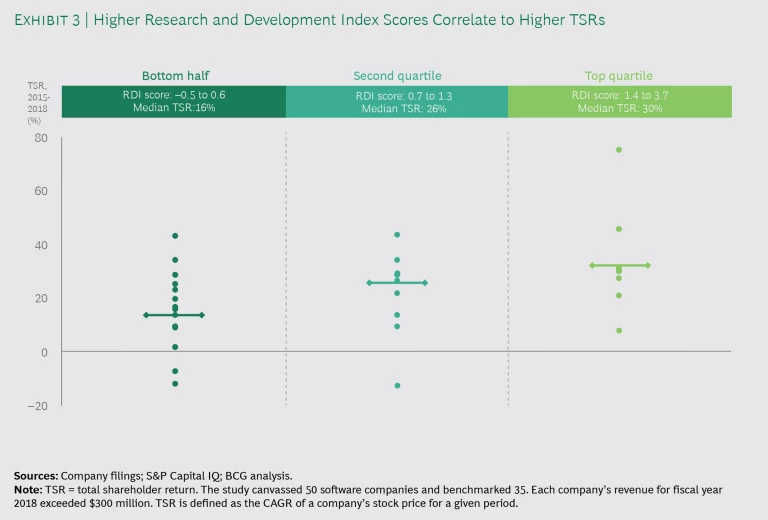
RDI is a powerful measure of R&D effectiveness. And by correlating the score of each company in our analysis to its total shareholder return (TSR), we found that companies with higher RDI scores also had higher TSRs—a correlation that held true for one-, three-, and five-year time periods. (See Exhibit 3.) TSR is the metric that many investment funds prefer to use to assess company performance, because TSR incorporates multiple performance factors: revenue growth, change in margins, valuation multiples, and direct distributions of free cash flow to shareholders.
Leaders who determine their company’s RDI score can get a good sense of whether they need to further assess their R&D allocations. But RDI is only the first step in assessing and reallocating R&D investments.
Reallocating R&D Spending to Rebalance the Product Portfolio and Engineering Activities
Let’s now take a look at the second question: How should R&D investments be distributed across products and engineering activities?
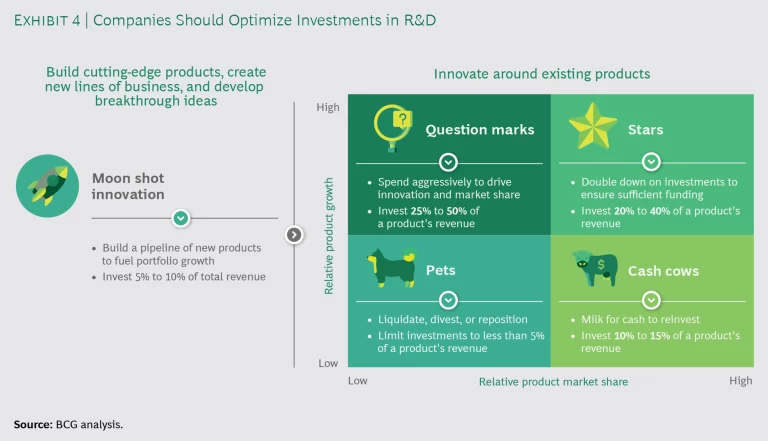
Companies that derive a large share of revenue from legacy products whose market share is high but whose growth potential is flat or declining should allocate their R&D spending to two endeavors. The first is moon shot innovation that builds cutting-edge products, creates new lines of business, and develops breakthrough ideas. The second is innovation that is closely related to existing products. (See Exhibit 4.) These companies should earmark 5% to 10% of their total revenues to moon shot innovation.
However, although moon shot projects are important, most companies should focus on the crucial issue of how to innovate around existing products.
The fact is that not all existing products or activities are equal—nor do they serve the same strategic purpose. Yet when allocating R&D capital and resources, many companies do not adequately reassess their offering and determine how to reapportion their investments. For example, many companies do not compare their spending on developing new products with their spending on updating core ones.
Companies need to rebalance R&D spending across products in proportion to each one’s current revenue and growth potential.
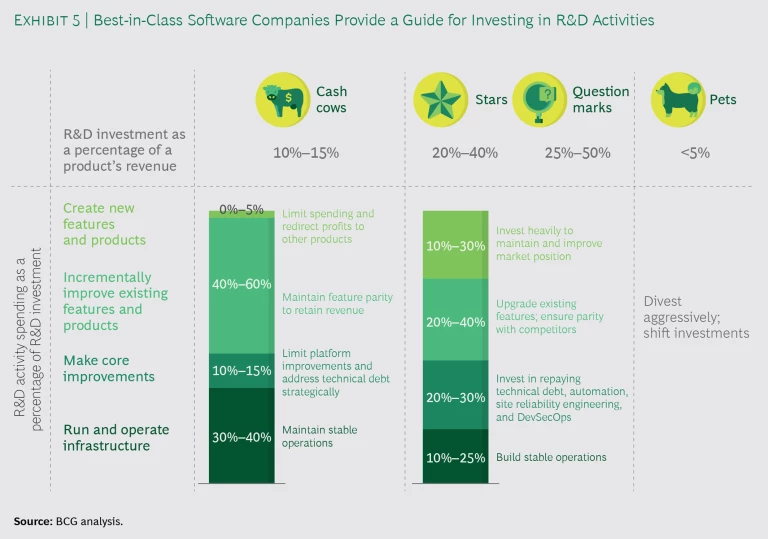
Companies need to rebalance R&D spending across products in proportion to each product’s current revenue and growth potential. A helpful tool is the growth-share matrix. Companies should assign all products—those that are on the market and in development—to one of four strategic categories:
- The stars are products with high growth and high market share that are also strategic winners. Companies should double down on their investments in these products to strengthen their competitive positions and continue to drive growth. Best-in-class companies usually commit 20% to 40% of each product’s current revenue to R&D.
- Products that have high growth but relatively low market share are question marks. These are typically newer products in strategic markets. Companies should invest aggressively in these products to drive innovation in order to improve the products, create competitive moats, and boost market share. Best-in-class companies usually commit 25% to 50% of each product’s current revenue to R&D.
- The cash cows are legacy products whose market share is high but whose growth is flat or declining. Companies should invest just enough to maintain feature parity with competitors’ products and stem a rapid decline in revenue. Companies should minimize investments in code refactoring, improvements that are unrelated to paid features, and advancements to the software platform. Best-in-class companies usually commit 10% to 15% of each product’s current revenue to R&D.
- Products with low growth rates and low market share are pets that should be liquidated, divested, or repositioned.
With their growth-share matrix in hand, companies can begin to understand how to ratchet up or down their investments and the tradeoffs involved. The overall approach should be to decrease investments in pets and cash cows, while increasing investments in stars and question marks.
Even within each of these strategic categories, companies commonly misallocate capital because they mistakenly prioritize projects with little or no value. Leaders need to consider how they will invest in four types of R&D activities:
- Creating new features and products that can expand the total addressable market (TAM)
- Incrementally improving existing features and products, such as those used by existing customers, to ensure parity with competitors
- Making core improvements by, for example, investing in site reliability engineering improvements, DevSecOps, and automation, as well as refactoring to repay technical debt and architecture enhancement costs
- Maintaining essential operations, including quality and support
How much a company invests in these activities will vary for each strategic category. All too often, companies overinvest in some activities (for example, platform improvements) to the detriment of the others (for example, new feature development). For a product in the stars category, roughly 10% to 30% of its R&D investment should be allocated toward new functionality that can expand TAM, and another 20% to 30% should be allocated toward core scalability improvements. Meanwhile, the mix is very different for a cash cow product: companies should allocate almost 40% to 60% of their R&D spending on cash cow products toward maintaining feature parity and revenue level while minimizing platform investments and managing technical debt. (See Exhibit 5.)
Installing a Complete Set of Metrics
Finally, let’s consider the third question: How should software companies ensure leadership visibility into R&D spending and continuously rebalance it? The first step is to install a set of KPIs and metrics. The investment percentages described above are a guide for R&D spending and fall under the category of portfolio allocation metrics.
In addition to portfolio allocation metrics, however, companies need three ongoing management metrics: financial and business KPIs to measure value created, leading indicators to see if a project or product is on track to deliver value, and process metrics to track if engineering processes are working as designed. (See Exhibit 6.)
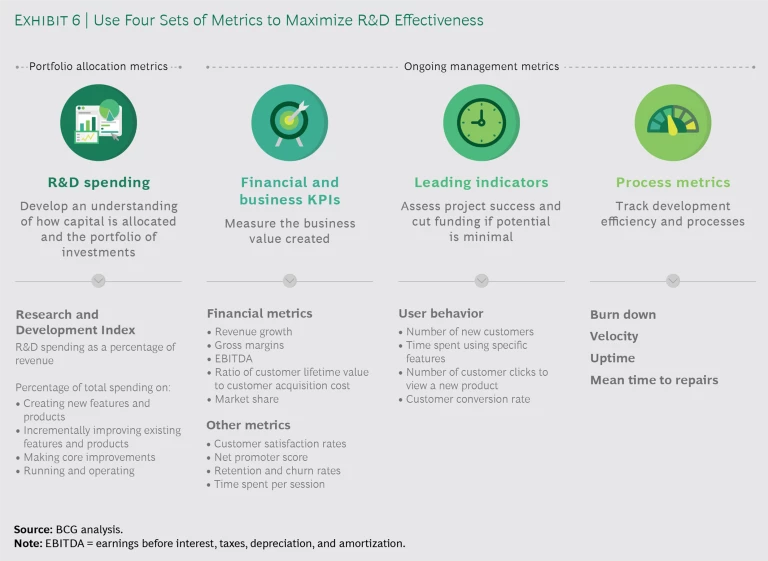
In our experience, most companies do a decent job of tracking and using various lagging financial and business KPIs, such as revenue growth, gross margins, and the ratio of customer lifetime value to customer acquisition cost. Most companies also monitor their customer satisfaction rates and net promotor scores. But because these are lagging performance indicators, they don’t help companies identify nonperforming R&D investments early on.
It’s critical that companies also define leading indicators of effectiveness. These metrics are often as simple as the number of new registrants, the average number of hours a user spends in an application or feature, or the impact on select objectives and key results. Companies and teams need to design these leading indicators thoughtfully and invest in telemetric, analytic, and management systems to measure and track them.
Meanwhile, there is a mix of metrics that measure process effectiveness, including burn down and velocity, both of which help identify if a product is delivered on time. Other metrics in this category include the escape rate, uptime, and the mean time to repair, all of which determine if a product is stable or if it has quality problems.
Implementing a combination of these four sets of metrics, along with determining the company’s RDI score, helps leaders monitor and tune their R&D engine, identify and put an end to long-running “science experiments,” ensure commercial and business viability, and drive a culture of accountability.
Ensuring Leadership Oversight and Governance
Most of the companies we studied conduct quarterly or a semiannual business reviews to track R&D priorities and progress. But leaders should use these reviews to achieve two additional goals: first, objectively triage investments and adjust spending, and second, shelve underperforming projects. That final action is critically important. Most companies let R&D projects drag on for too long without having clear potential for creating business value. By continuing to direct attention and funding to underperformers, more promising ideas are sometimes starved for resources.
Companies can maximize return on R&D by creating a culture that doesn’t view identifying and discontinuing underperforming projects as a failure but, rather, as a necessary part of innovating and iteratively testing products. For example, Alphabet’s X division, formerly known as Google X, specializes in projects called moon shots. But teams are encouraged to raise concerns about their projects’ ability to succeed. In 2015, more than 100 potential projects were canceled. When a team of engineers decided to abandon a project after two years, they were all given bonuses.
Companies can also foster better governance by simultaneously empowering business units and making them more accountable. A large US-based software company’s R&D planning and allocation process is centrally run, but governance is executed at a business unit level with central oversight. Each business unit has a tailored mix of metrics and reallocation processes to best suits its needs. For example, one business unit has a quarterly R&D review process, while another business unit conducts a more-extensive review process semiannually but balances the portfolio more frequently as needed.
As companies push to respond to the marketplace, many forgo adequate R&D oversight, assuming that it will impede creativity and slow innovation. However, best-in-class, results-oriented companies leverage oversight and governance to turbocharge innovation, increase accountability, and drive a better product-market fit. In fact, these companies find that focused governance is essential to keep the organization strategically aligned and to shine a light into what is otherwise a black box of R&D spending. Fundamentally, these companies know that spending money on R&D—even a great amount of money—doesn’t guarantee that they will be innovative.


