This is the second in a series of online articles published in advance of The Boston Consulting Group’s 2012 Value Creators Report. In February 2012, we identified the key value-creation trends in 2011. In the fall of 2012, we will publish the full report, including detailed rankings of the top performers worldwide and in 20 industries for the five-year period from 2007 through 2011.
Related Article: The Rise of the Cash Machine
As global economic recovery has been buffeted by events ranging from the Japanese earthquake and tsunami to the ongoing fiscal crisis in the euro zone, investors have become more pessimistic about the level of total shareholder returns (TSR) that companies will deliver. In response, investors have significantly shifted their focus to the strength of a company’s free-cash-flow yield as a primary indicator of its current health and value-creation potential, as well as on direct distributions of cash in the form of dividends as an increasingly important component of TSR.
This is the picture that emerges from a recent survey conducted by The Boston Consulting Group. During the first quarter of 2012, BCG invited approximately 650 portfolio managers and buy-side and sell-side analysts to participate in an online survey. The survey is the fourth in a series that BCG has conducted since 2009, probing investors’ views on the global economic environment and priorities for business value creation.
We received 165 responses to our 2012 survey (a response rate of about 25 percent) from individuals at firms that, collectively, are responsible for approximately $1.2 trillion in assets under management and cover a wide range of industries and locations. Four key findings stand out:
- Renewed Pessimism. Respondents have shifted from the “cautious bullishness” we identified last year to a more pessimistic take on the global economy. They believe the recovery is happening more slowly than they thought it would last year and expect less economic growth, less earnings growth, and lower TSR in 2012 and subsequent years as a result.
- The Primacy of Free-Cash-Flow Yield. In an environment in which investors have scaled back their expectations for growth, respondents have made a company’s free-cash-flow yield their top investment criterion. And they increasingly want to see more of that yield in the form of higher dividend-payout ratios, a value creation strategy that, earlier this year, we dubbed “The Rise of the Cash Machine.”
- Diverging Views of the U.S. and Europe. Investors are also differentiating more carefully between regions such as Europe, with relatively poor prospects for future growth, and those such as the U.S., where prospects are more promising. Investors who focus on European equities are significantly more pessimistic than those who focus on U.S. equities.
- The Imperative of Alignment. Given the impact of the ongoing volatility in equity markets on investor expectations, it is critical for senior executives to develop and communicate a clear and compelling investment thesis, in which an organization’s business, financial, and investor strategies are carefully aligned and mutually reinforcing. Although our survey suggests that companies are getting better at such alignment, nearly two-thirds of investors continue to believe that the companies they follow are not well aligned across these three dimensions.
Renewed Pessimism
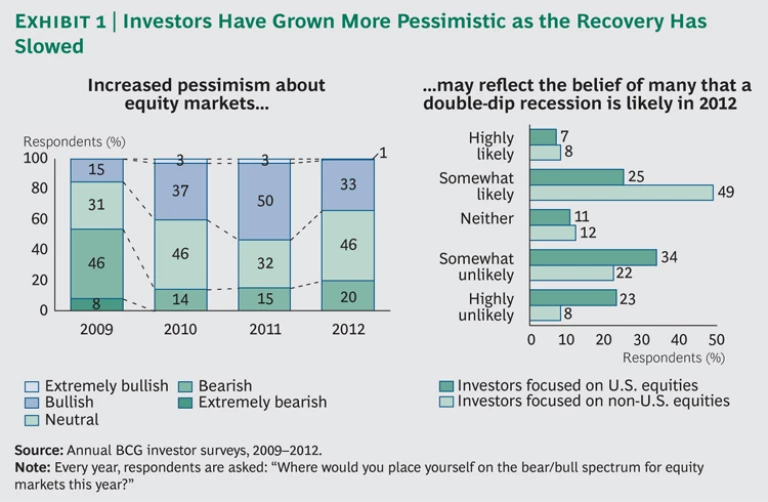
The biggest change in the survey results, compared with last year, is the marked increase in pessimism about the prospects of the global economy and global equity markets. Last year, for example, the number of respondents to our survey who said that they were “extremely bullish” or “bullish” about equity markets grew by a substantial 13 percentage points from the year before to include a majority (53 percent) of respondents. This year, however, the portion of bullish or extremely bullish respondents has declined to about a third (34 percent), a level that corresponds roughly to that found in our 2010 survey. (See Exhibit 1.)
The Primacy of Free-Cash-Flow Yield
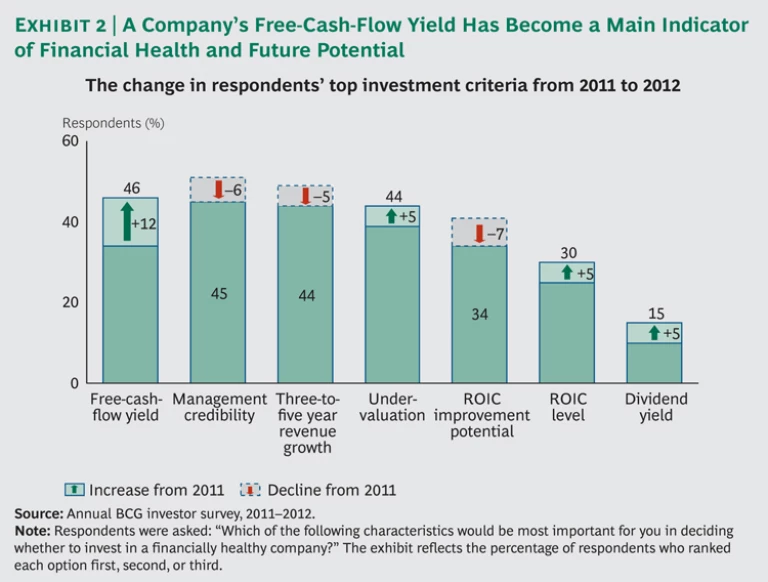
This increased pessimism is also reflected in the top investment criteria of the respondents to our survey. Every year, we ask survey participants: “Which characteristics would be most important for you in deciding whether to invest in a financially healthy company?” Exhibit 2 compares the responses in the 2012 survey with those in 2011.
The Primacy of Free-Cash-Flow Yield
What is most striking is the dramatic increase in the importance of free-cash-flow yield, which has risen 12 percentage points since last year to take the number one spot. Also growing in importance are two related criteria: levels of return on invested capital (ROIC), which help to highlight the financial health of a business, and dividend yield, an indication of how much cash is returned directly to investors.
This rise is accompanied by a relative drop in importance of the criteria that the survey calls “management credibility” and “three-to-five year revenue growth.” This is not to say that somehow the quality of a company’s management team and its future growth prospects have ceased to be important for these investors. After all, both criteria are within 1 or 2 percentage points of the leader. However, at a time when many companies have become much more efficient in the aftermath of the global financial crisis (to the degree that in the U.S., corporate profits are at an all-time high), and when prospects for future growth have dimmed, a company’s capacity to generate superior free-cash-flow yield is becoming an increasingly important indicator of future financial health. What’s more, the fact that dividend yield has risen in importance signals that, as far as these investors are concerned, there is more than one way to deliver above-average TSR. One survey respondent put it this way: “Correct the identity crisis. It’s OK not to be a growth company. A company can still generate a ton of value by getting valued properly, growing earnings strongly, and returning most of their free cash flow to investors.”
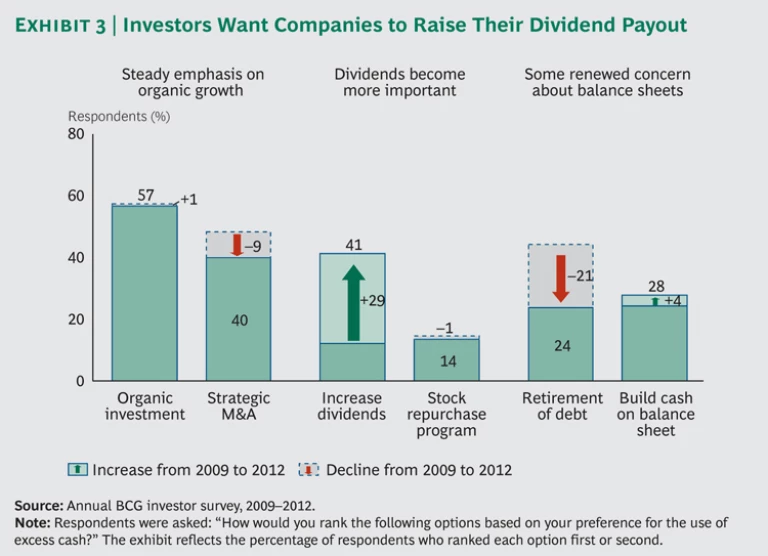
This perspective becomes even clearer when we look at respondents’ opinions on the use of a company’s free cash flow. Every year, we ask respondents to rank their preferences for a company’s use of excess cash. Exhibit 3 takes a longer view and compares the 2012 responses to those in our first survey in 2009, in the midst of the global economic downturn. As the exhibit makes clear, investments in organic growth remain the number one priority but barely rank higher than they did in 2009 (and significantly lower than they did last year). At the same time, strategic M&A has dropped 9 percentage points, perhaps reflecting growing concern about the riskiness of M&A in today’s volatile economic environment.
What’s more, in a world in which growth of any kind is hard to find, paying a higher percentage of free cash flow directly to investors in the form of dividends has become an increasingly important priority. This reinforces one of the key conclusions of last year’s survey: investors want management teams to be disciplined stewards of capital—to strike a delicate balance between investing in profitable organic growth and returning excess free cash flow to shareholders.
The growing importance of dividend yield was also a consistent theme in the comments of the respondents to our survey, and they cited a variety of reasons for it. In a period of relatively modest average TSR (and low stock-price appreciation), dividend yield becomes a relatively more meaningful component of TSR. Or, as one respondent put it, “all else being equal in terms of value creation, a big dividend yield is like running a 100-meter dash, but I get to start on the 40-meter line.” What’s more, as previous BCG research has demonstrated, significant dividend increases that are sustained over time often strengthen a company’s market valuation. “If you bring back the dividend constituency,” said another respondent, “you bring back some of the confidence and some demand for a company’s stock. And you put a floor on the multiple.” Finally, increasing dividends can even benefit a company’s growth agenda. “High payout ratios discipline management to focus its attention on the core business,” one respondent pointed out. “It makes executives more creative in looking for growth without spending too much money and taking unnecessary risks.”
Exhibit 3 also suggests that respondents in the survey prefer to see free-cash-flow distributions in the form of dividends rather than share buybacks. This is largely due to the fact that 69 percent of them believe that companies do a poor job of timing their share repurchases. “There are many companies that have a current market value well below the levels at which shares were repurchased in the last five to ten years,” said one survey respondent. “For that reason, we are significantly more dividend focused.”
Diverging Views of the U.S. and Europe
It’s important, however, to note that the aggregate survey findings mask some significant differences between investors who focus on U.S. equities and those focused on Europe. The fact is, the respondents see the two economies differently and, therefore, have somewhat different priorities.
Earlier this year, BCG drew attention to the fact that nine of the top-ten large-cap value creators in 2011 were U.S. companies. What’s more, of the local stock markets in 40 countries, the only developed economy in the world with a positive TSR in 2011 was the U.S. (2 percent, according to the S&P 500, and 8 percent for the Dow Jones Industrial Average). This positive performance was in contrast to across-the-board declines in European equity markets.
So it makes sense that, even as they share a growing pessimism about the world economy as a whole, respondents also make a clear distinction between economic prospects in the U.S. and Europe. For example, half of the respondents who focus on U.S. equities believe that U.S. GDP growth will be in the modest but still relatively healthy neighborhood of 2 to 3 percent—and a full two-thirds of respondents who focus on non-U.S. (and primarily European) equities think so. By contrast, majorities of both groups think European GDP growth will be between 0 and 1 percent—and more than a third of respondents in both groups actually expect negative growth for Europe in 2012.
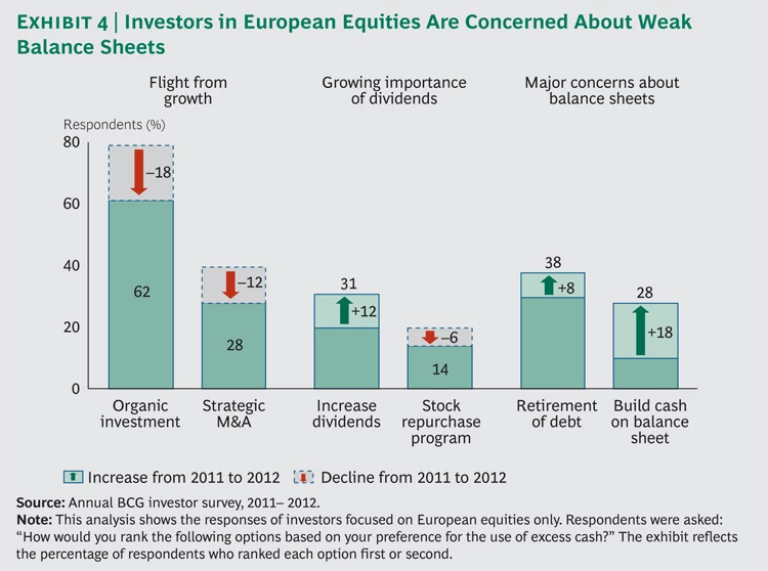
This divergent view of the two economies explains one of the more curious findings in Exhibit 3: some renewal of concern about the health of company balance sheets and a desire for companies to improve their cash positions. At first, we were surprised by this result—especially given the record amounts of cash on company balance sheets. The explanation came when we separated out the responses to this question from those who focus on European equities and compared them with those of last year. (See Exhibit 4.) The results suggest both a substantial flight from growth investments and a pronounced increase in concerns about shoring up company balance sheets. Once again, this is an indicator that the euro zone’s continuing fiscal crisis is having a major impact on investor confidence and expectations.
The Imperative of Alignment
What are the implications of our survey results for a company’s strategy to deliver attractive and sustainable TSR? Clearly, investors are looking for companies with strong free cash flow and a growth agenda disciplined by relatively high dividend and buyback-payout ratios. In short, companies have to be excellent stewards of capital and strike a delicate balance between investing in growth and returning cash to shareholders.
For a number of years, BCG has been emphasizing the importance of clear alignment across a company’s business, financial, and investor strategies. More than a third (37 percent) of our survey’s respondents said that the companies they had invested in were well aligned across these three dimensions. That represents considerable improvement since 2009, in the aftermath of the global financial crisis, when only 22 percent thought so. Nevertheless, nearly two-thirds (63 percent) continue to believe that the companies they were following or invest in were only “partly” or even “poorly” aligned. Imagine what they must think of the companies in which they have chosen not to invest.
We believe that four steps are especially important in defining a company’s value-creation strategy in today’s investment environment:
- Transform the agenda. The respondents to our survey clearly believe that equity markets are entering a phase in which organic revenue growth, earnings growth, and share price appreciation will be considerably below the historic norm for a number of years. Companies can choose not to accept this new normal—but only if they transform their business model, competitive position, and value-creation strategy to drive stronger margins and organic growth that will deliver superior free-cash-flow generation and TSR.
- Don’t give up on growth. Because organic growth prospects are so limited, the transformation needs to include a rigorous review of the company’s growth strategies. Do business units have realistic plans for where and how they will grow profitably in the future? Have they identified the full range of organic and acquisitive organic growth opportunities in what is likely to be a relatively low-growth economy? Executives must keep in mind, however, that investors want companies to be highly selective in growth investments. They are looking for disciplined growth, not growth at any cost.
- Strike the right balance between growth investments and payout. At the same time, companies need to recognize that investors are expecting higher payout ratios and yields in today’s low-growth environment. Getting the balance right between growth investments and cash payout and the resulting yield will be a critical value-creation challenge in the years to come, with major implications for a company’s financial strategy as well as investor strategy and messaging.
- Define a compelling investment thesis. As the above makes clear, the investor priorities reflected in our survey should be an important—but not the only—consideration in a company’s investment choices. And yet, strikingly few companies have a coherent process for managing their investment choices to deliver attractive and sustainable TSR. By developing an explicit corporate investment thesis, much as professional investors do, a company can more effectively assess the tradeoffs among competing priorities and evaluate the performance of its investment decisions over time.
BCG will expand its consideration of these and related topics in our next annual Value Creators report, which will be published in the fall of 2012.


