Consumer products manufacturers continue to spend heavily on trade—more than $60 billion per year in the U.S. and more than $500 billion per year globally. Trade spending—from price discounts to promotions to displays—has grown at an alarming rate for years. For example, it outpaced the growth rate of revenues by 3 percentage points and of volume by 7 percentage points from 2008 through 2010 at the manufacturers we surveyed. All the while, manufacturers have faced the persistent challenge of ensuring that these expenditures promote profitable growth.
Three external factors have fueled the escalation of trade spending: stronger retailers, slower demand growth, and rising commodity prices. The retailer landscape is shifting because of consolidation, the increasing sophistication of private-label products, and the emergence of e-commerce. Over the past decade, retailer margins have increased at the expense of consumer products manufacturers, in total shifting 5 percent of the available profit pool. In most categories and channels, the growth of consumer demand has slowed or stalled, increasing the need for “push” marketing. Retailers have also used trade concessions to “charge back” list price increases intended to offset rising commodity prices. And manufacturers have applied trade spending to mitigate the volume losses attributable to these price increases.
To make matters worse, many manufacturers lack the capabilities, processes, and tools to manage these escalating trade investments strategically. And they may have only limited understanding of which trade investments yield the highest returns. As we will discuss, leading manufacturers have adopted what we regard as best practice: designing programs that “pay for performance.”
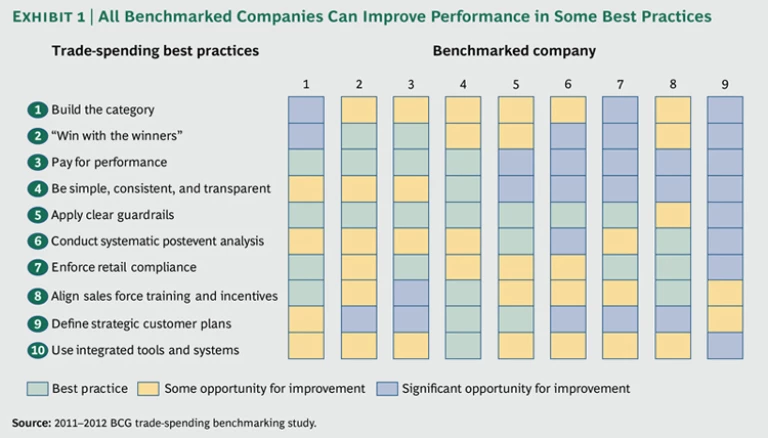
To gain insights into benchmarks and best practices, The Boston Consulting Group recently surveyed nine U.S. consumer-products companies. We gathered data on gross revenues, unit volume, and trade spending over time. To understand design and execution choices, we interviewed leaders of sales, sales finance, and trade marketing, as well as leaders of trade strategy and execution. This allowed us to identify ten best practices for trade spending. Performance varied considerably among the benchmarked companies with respect to these practices. We found that all of the companies had opportunities to improve their performance in at least some of the best practices; no company had a “perfect” program. (See Exhibit 1.)
In this report, we provide an overview of the benchmarking and discuss three opportunities to improve the returns on trade investments: prioritizing investments with the “winners” that will deliver profitable growth; analyzing returns and applying the insights to advance performance systematically at each retailer and event; and designing a trade structure and program to pay retailers for their performance, rather than on the basis of relationships or activities. Last, we present a set of questions that manufacturers can use to assess their starting point in the multiyear effort to transition to a more effective trade program.
Because our benchmarking participants represented a wide variety of companies (based on category, size, and geographic scope), we believe the trends and insights discussed below are broadly applicable to consumer products manufacturers globally, although our benchmarking was limited to the U.S. market. In discussing the practices we observed, we are not analyzing or commenting on their compliance with applicable laws. Manufacturers should seek legal advice before implementing the practices outlined in this report.


