This is the first in a series of online articles published as part of The Boston Consulting Group’s 2012 Value Creators Report. The full report will be published in September.
In 2011, global equity markets reversed direction, declining in value for the first time since the crisis year of 2008. The MSCI All Country World Investable Market Index of total shareholder return (TSR) was down by approximately 6 percent last year, reflecting investor concerns about the sovereign-debt crisis in Europe and the sustainability of a global economic recovery.
Of course, some companies, local markets, and industry sectors did far better—or far worse—than the average. Who were the winners and losers in 2011? Which companies, countries, and industries have continued to create value in the face of significant economic headwinds? And what, if anything, do the results tell us about the dynamics of value creation in today’s economy?
To answer these questions, The Boston Consulting Group recently analyzed the 2011 TSR of more than 5,000 companies across 40 countries and 37 industry sectors. There were three key findings:
- Broad declines in TSR meant that there were far fewer safe havens for investors. The equity markets of only 6 countries out of the 40 covered by the MSCI index delivered positive TSR in 2011. And only a quarter of the 37 industry sectors did so.
- Although the average returns were negative, the top single-year value creators in 2011 still managed to deliver attractive shareholder returns. The top-ten companies in our sample of 112 large-cap companies (those companies with year-end market valuations greater than €40 billion, or about $52 billion, generated TSRs from 26 to 45 percent.
- Dividends and other direct distributions to shareholders are on the rise, and they may have played an outsized role in the performance of many of the top companies and leading industry sectors.
Fewer Safe Havens
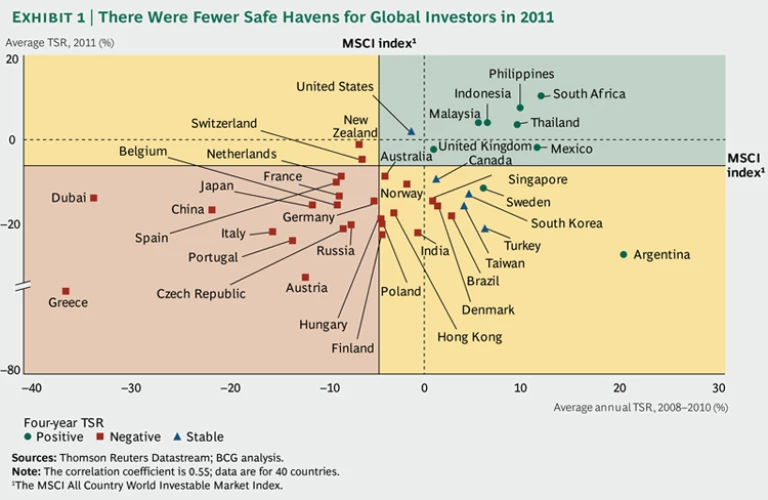
To get a sense of the trends that shaped value creation last year, we compared the performance of equity markets around the world. Exhibit 1 plots the average TSR performance of 40 local stock markets around the world for 2011 (on the y-axis) and the average annual TSR for the cumulative period from 2008 through 2010 (on the x-axis). The shape and color of each data point shows which countries had net positive TSR since the crisis year of 2008 (green circles), which countries had yet to recoup their 2008 losses (red squares), and which countries had more or less broken even (blue triangles).
What Exhibit 1 reveals is that there were fewer and fewer safe havens for global investors. Only six countries had positive TSR in 2011: the U.S. and a set of developing countries—Indonesia, Malaysia, the Philippines, South Africa, and Thailand—that we have dubbed “the emerging emerging markets.” Among the countries we studied, South Africa had the highest market-average TSR (10 percent), followed by the Philippines (8 percent). But these emerging emerging markets remain a highly volatile group. Argentina, which in 2010 had a market average TSR of 54 percent (the highest among the countries we studied), reversed direction in 2011 with a market average TSR of –27 percent. Only Austria and Greece did worse.
The impact of Europe’s sovereign-debt crisis clearly affected equity markets across the continent, including the markets of countries that are outside the euro zone. Last year, for instance, we identified Denmark, Finland, and Sweden as three “Nordic highfliers” with a strong market-average performance that separated them from other European countries suffering debt problems, such as Greece, Portugal, and Italy. In 2011, however, the equity markets of these Nordic countries generated negative returns. Finland, the only one of the three in the euro zone, had returns of –23 percent, the fourth-worst performance in Europe. This retreat into the red also caused Denmark, which by the end of 2010 had recovered its 2008 losses, to fall back into negative territory by the end of 2011. Only Sweden maintained a positive TSR from 2008 through 2011. Finally, despite continued economic growth, the BRIC countries (Brazil, Russia, India, and China) continued their dismal stock-market performance. All four experienced shareholder losses in the double digits in 2011, reflecting the decline in the unsustainably high expectations that investors had for economic growth in these countries.
U.S. Companies Dominate the Top Ten
In 2010, developed-world multinationals took seven of the ten places on our top-ten list of single-year large-cap value creators. We speculated that this performance signaled a “return to quality”—that is, a tendency on the part of global investors to focus on established companies with strong cash flows, clear sources of competitive advantage, and high-quality management teams. In 2011, that trend continued, with developed-world multinationals taking all ten spots on the list. The big difference this year: all but one—British American Tobacco (number six)—are based in the U.S. (See Exhibit 2.)
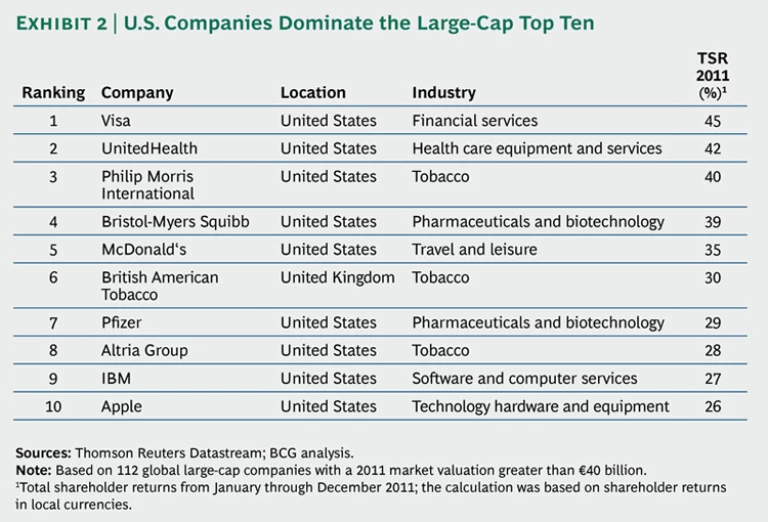
What explains this dominance of U.S. companies on the list? In part, it may be because the U.S. was the only developed economy in the world with a positive TSR in 2011—2 percent according to the S&P 500 (and a hefty 8 percent according to the Dow Jones Industrial Average). Meanwhile, the across-the-board decline of European equity markets may have kept even the best-performing European multinationals from appearing on the top-ten list. Far more interesting than the location of the top-ten companies, however, is the type of company that dominates the list. Three companies—credit-card-services provider Visa (number one), health insurer UnitedHealth (number two), and consumer electronics juggernaut Apple (number ten)—are the kind of strong-growth companies that one would expect to see on a list of the top value creators.
The rest, however, are what in previous BCG publications we have called cash machines—that is, companies that create value less through growing revenues than through some combination of continuously improving margins, increasing asset productivity, and returning a substantial portion of free cash flow to shareholders in the form of dividends or share repurchases.
The tobacco sector, for example, is an especially pure version of the cash machine strategy, which explains why tobacco companies Philip Morris International (number three), British American Tobacco (number six), and Altria Group (number eight) all made the top-ten list this year. Another highly successful cash machine is McDonald’s. In recent years, it has pursued a strategy of squeezing more sales out of existing locations rather than opening new restaurants, thus greatly improving margins.
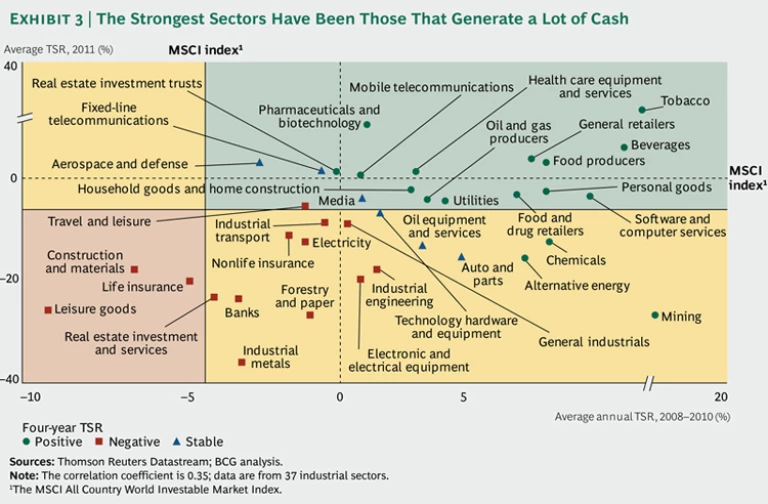
The robustness of the cash machine strategy for value creation in 2011 was also reflected in the sector results. (See Exhibit 3.) The strongest sectors in 2011 were tobacco (a TSR of 30 percent) and pharmaceuticals and biotechnology (10 percent), which explains, in part, the presence of Bristol-Myers Squibb (number four) and Pfizer (number seven) on the list. Other relatively stable, cash-generating sectors, such as beverages, general retailers, and food producers, also performed well. And even some cash-generating sectors that globally did not create value in 2011, such as utilities and personal goods, were still able to retain a positive TSR for the four years since the 2008 financial crisis.
The Power of Cash Distributions
A key element of a cash-machine value-creation strategy is to return a substantial portion of free cash flow to investors in the form of dividends or stock buybacks. There is considerable evidence that such direct distributions of cash have played a key role in the success of many of the companies on the top-ten list.
With the exception of Apple, which pays no dividends, all of the top-ten companies increased their dividends in 2011. Since 2003, for instance, IBM has increased its quarterly dividend by 400 percent, and 2011 was the eighth year in a row that the company announced percent increases in the double digits. (All told, IBM has returned more than $109 billion to shareholders in the form of dividends and share repurchases since 2003.)
McDonald’s, which has increased its annual payout to shareholders every year since 1976, had a 2011 dividend yield of 4 percent, according to Thomson Reuters Datastream, well above the S&P 500 average. High yields may also explain the appearance of big pharmaceutical companies on the top-ten list. Pfizer (number seven), for example, had a 2011 dividend yield of 5 percent.
Of course, this is not to say that the dividend yield of these companies constituted the major source of their TSR in 2011. BCG’s research has shown that for leading value creators, the main component of single-year TSR performance is growth in a company’s valuation multiple.
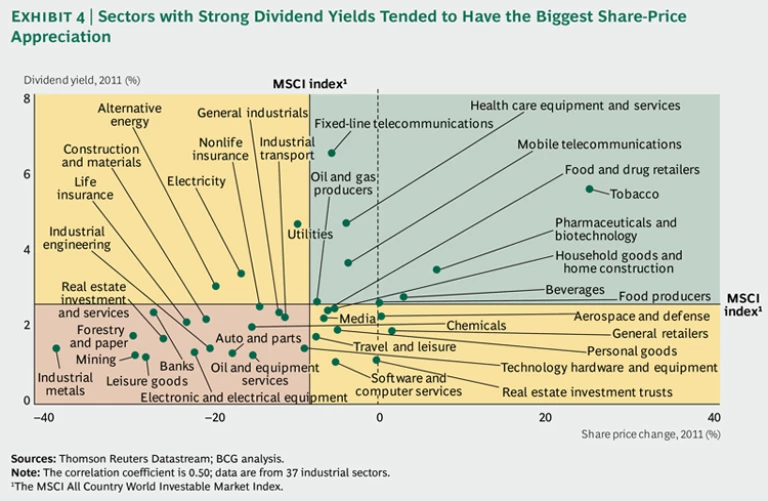
But higher dividend payouts, in addition to directly creating shareholder value, can have a major positive impact on a company’s multiple. Exhibit 4 compares the 2011 dividend yield in our 37 industry sectors (on the y-axis) with the change (positive or negative) in the price of shares in each sector (on the x-axis). The exhibit illustrates that many of the sectors with the highest yields were also those with the strongest share-price appreciation.
At a time when the yield on bonds is extremely low, and short-term interest rates are near zero, we expect this trend toward higher direct distributions to shareholders to continue. It is driven by multiple factors: the massive amounts of cash that companies have been accumulating on their balance sheets, the ongoing difficulty in finding new avenues for profitable growth, and certain demographic trends, such as the retirement of the baby-boom generation, which is stimulating a shift in focus on the part of a whole generation of investors toward stable income and preservation of capital. Who knows? Perhaps even Apple will start returning at least some of its nearly $100 billion in cash to investors in 2012.
Questions for the Future
Keep in mind that single-year TSR performance is a poor indicator of long-term value creation, and there is no guarantee that the companies at the top of this year’s list will be there next year. Among the questions that we will be tracking throughout the coming year are the following:
- Are the generally poor shareholder results of 2011 a harbinger of a further slowdown in the global economy—or even a double-dip recession? Europe is already tipping toward negative economic growth, a trend likely to be exacerbated by continuing fiscal austerity. Will Europe’s economic troubles spread to other markets such as the U.S.? And if so, what impact will that have on global equity markets?
- How sustainable is the cash machine strategy for value creation, especially if economic conditions worsen? At what point does sluggish—or even negative—growth begin to affect profitability and the ability of companies to fund a strong dividend or share buybacks?
- In the U.S., dividend payout ratios remain at record lows—despite recent increases. Just how high can such payout ratios go? And what would be the impact on TSR if companies returned to the much higher payout ratios of decades past?
We will be exploring these and other questions in our 2012 Value Creators Report in September.


