The 2013 Value Creators rankings are based on an analysis of total shareholder return at 1,616 global companies for the five-year period from 2008 through 2012.
To arrive at this sample, we began with TSR data for more than 9,000 companies provided by Thomson Reuters. We eliminated all companies that were not listed on a world stock exchange for the full five years of our study or that did not have at least 25 percent of their shares available on public capital markets. We further refined the sample by organizing the remaining companies into 25 industry groups and establishing an appropriate market-valuation hurdle to eliminate the smallest companies in each industry. (The size of the market valuation hurdle for each industry can be found in the tables in “Industry Rankings.”)
In addition to analyzing our 1,616-company comprehensive sample, we separately evaluated those companies with market valuations of more than $50 billion. We have included rankings for these large-cap companies in “Global Rankings.”
The global and industry rankings are based on five-year TSR performance from 2008 through 2012. We also show TSR performance for 2013, through May 30. In addition, for all but two of the industry rankings, we break down TSR performance into the six investor-oriented financial metrics used in the BCG TSR model: sales growth, margin change, multiple change, dividend yield, change in the number of shares outstanding, and change in net debt. For two industries—banking and insurance—we use a slightly different approach to TSR disaggregation in order to deal with the analytical complexity of measuring value creation in those sectors.
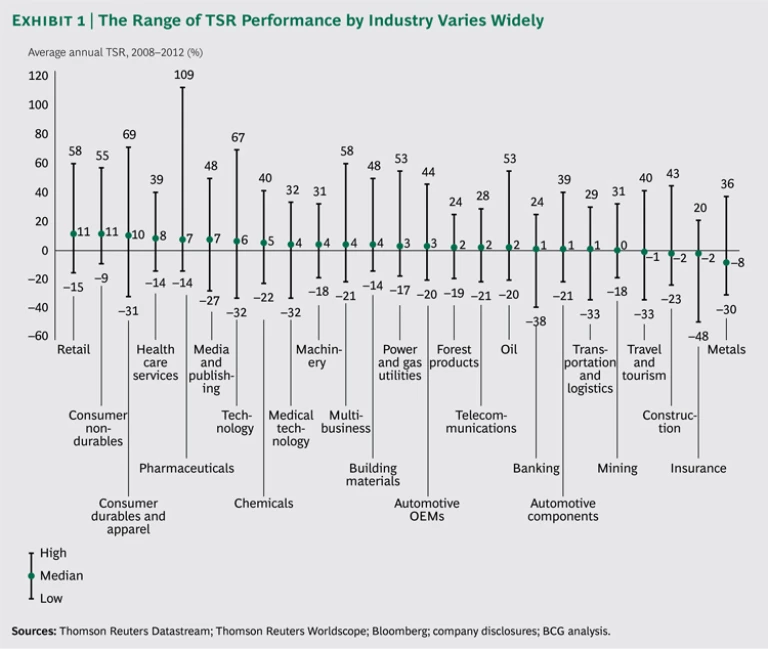
The average annual TSR for the 1,616 companies in our sample was approximately 4 percent. The average annual TSR for the 25 industry sectors ranged from 11 percent (in retail and consumer nondurables) to –8 percent (in metals). (See Exhibit 1.)
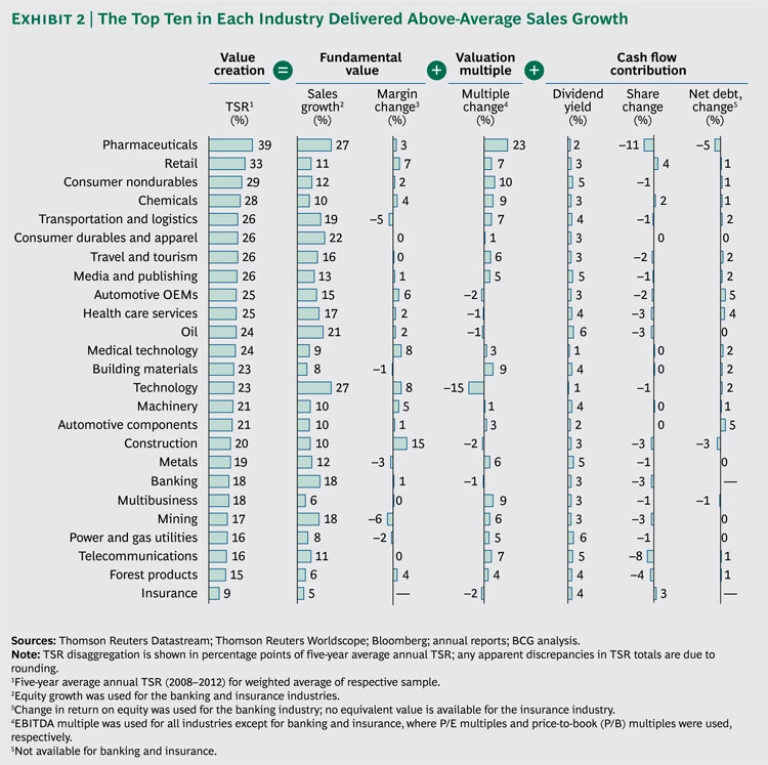
As always, the leading companies in our sample substantially outpaced not only their own industry average but also the total sample average. The average TSR of the top ten companies in each industry outpaced their industry averages by between 11 percentage points (in insurance) and 32 percentage points (in pharmaceuticals). (See Exhibit 2.) The lesson for executives is this: Coming from a sector with below-average market performance is no excuse. No matter how bad an industry’s average performance is relative to other sectors and to the market as a whole, it is still possible for companies in that industry to deliver superior shareholder returns.
What kind of improvement in TSR was necessary to achieve truly superior performance, given the sample average? A company had to deliver an average annual TSR of at least 12 percent per year to be in the top quartile of the global sample and at least 49.2 percent to make the top ten. The most successful companies delivered TSR of more than 60 percent per year. This year’s top value creator—U.S. biopharma company Pharmacyclics—had an average annual TSR greater than 100 percent.
The rankings suggest four other broad trends of interest:
- Companies from emerging markets continue to dominate our global top ten, with the majority coming from countries such as Brazil, the Philippines, Russia, and Thailand.
- When it comes to the world’s largest companies, however, the balance shifts back toward the developed world. Although this year’s number-one large-cap value creator is the Chinese online media company Tencent, seven of the top ten companies in this category are from developed-world economies—including familiar companies such as Danish pharmaceutical manufacturer Novo Nordisk at number three, South Korean powerhouse Samsung Electronics at number four, Spanish retailer Inditex at number five, and Apple (by far, the company with the biggest market valuation on our list) at number six.
- Despite below-average global GDP growth in the years since the 2008 financial crisis, the winners in each of the 25 sectors that we studied found ways to deliver annual sales growth at rates considerably above the average—from 6 percent per year, on average, for the top ten value creators in the forest products and multibusiness sectors to 27 percent per year for the top ten in the pharmaceutical and technology industries (as shown in Exhibit 2).
- In some sectors, dividend yields were a major contributor to top performance. For example, dividends accounted for roughly a quarter of the average TSR (24 percent) delivered by the oil industry’s top ten, more than a third of the average TSR (16 percent) delivered by the power and gas utilities top ten, and almost half of the average TSR (9 percent) delivered by the insurance top ten (as shown in Exhibit 2).


