Whether the subject is sports teams, educational institutions, or global companies, it is in the nature of performance rankings to focus on the very best. BCG’s annual Value Creators report is no exception. Every year, we publish rankings of the ten companies that have delivered the highest total shareholder return (TSR) both globally and in a broad cross section of industrial sectors. (For an explanation of TSR as a capstone metric for value creation, see “The Components of TSR.”)
THE COMPONENTS OF TSR
Total shareholder return measures the combination of share-price gains and dividend yield for a company’s stock over a given period of time. It is the most comprehensive metric for measuring a company’s shareholder-value-creation performance.
TSR is the product of multiple factors. Regular readers of the Value Creators report should be familiar with BCG’s model for quantifying the relative contribution of TSR’s various sources. (See the exhibit below.) The model uses the combination of revenue (sales) growth and change in margins as an indicator of a company’s improvement in fundamental value. It then uses the change in the company’s valuation multiple to determine the impact of investor expectations on TSR. Together, these two factors determine the change in a company’s market capitalization and the capital gain or loss to investors. Finally, the model tracks the distribution of free cash flow to investors and debt holders in the form of dividends, share repurchases, and repayments of debt to determine the contribution of free-cash-flow payouts to a company’s TSR.
The important thing to remember is that all these factors interact with one another—sometimes in unexpected ways. A company may grow its revenue through an EPS-accretive acquisition and yet not create any TSR, because the new acquisition has the effect of eroding gross margins. And some forms of cash contribution (for example, dividends) have a more positive impact on a company’s valuation multiple than others (for example, share buybacks). Because of these interactions, we recommend that companies take a holistic approach to value creation strategy.
This year, however, we are doing something different. In addition to this year’s rankings of the top performers for the five-year period from 2010 through 2014, we are profiling some companies that don’t appear in our top-ten rankings but that have delivered strong TSR relative to their peers despite the fact that their industry or sector has faced serious economic headwinds. This year, we focus on value creation “for the rest of us.”
A Highly Selective Group
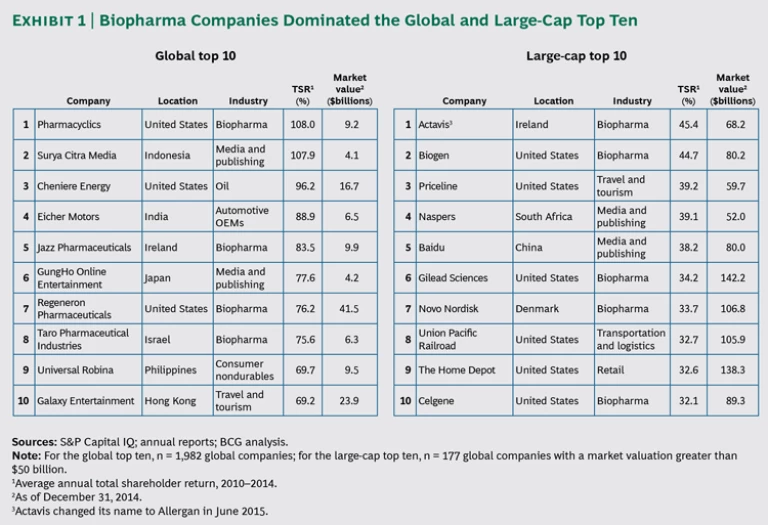
To be included in our 2015 rankings, companies had to deliver extraordinary TSR. Average annual TSR is the amount of TSR that a company delivers, on average, in each of the five years covered by this year’s report. The average annual TSR for the median company of the 1,982 companies in this year’s sample was 14.6 percent. But to reach the top quartile of the sample, a company had to deliver an average annual TSR of at least 23.3 percent. And to make the global top ten, a company had to deliver an average annual TSR of 69.2 percent. The U.S. biopharma company Pharmacyclics was the top value creator for the third year in a row, with a triple-digit average annual TSR of 108 percent. (See the left-hand list in Exhibit 1.)
Without taking anything away from the achievement of the companies listed in Exhibit 1, it is only fair to point out that structural factors can play a large part in determining which companies make our top-ten lists. One of those factors, of course, is survivor bias. For every company that hits the jackpot in drug discovery, for instance, there are countless others that do not.
A second factor is company size. BCG research shows that, over time, sales growth is the most important driver of shareholder value for top-quartile value creators. Little surprise, then, that whereas the median average annual sales growth for this year’s Value Creators sample was 8.4 percent, the median for companies that made our top-ten rankings was substantially higher—13.7 percent. All things being equal, it is easier for a company to create value through sales growth when it is starting from a relatively small base than from a large one. That may explain why, although 49 percent of the companies in our database have a market capitalization of less than $10 billion, 57 percent of the companies in our top-ten global and industry rankings do, and a full 7 out of 10 of the companies in our global top ten do.
The strong impact of company size is part of the reason we also publish, in addition to our global top-ten list, a global ranking of the top large-cap value creators, drawn from the 177 companies in our database with a market capitalization of more than $50 billion. (See the right-hand list in Exhibit 1.) But even in this subset of the largest companies, size can play a major factor in determining the companies that make the top ten.
For example, this is the first time in the past nine years that Apple has not appeared in our large-cap top ten (although it does come in at number eight in our rankings for the technology sector). And yet Apple, with a market capitalization of roughly $647 billion at the end of 2014, is by far the largest company in our sample. The fact that the company was able to deliver an average annual TSR of 31.1 percent is as—or even more—impressive than the TSR performance of the companies included in the large-cap rankings with market caps between roughly one-tenth and one-fifth that of Apple.
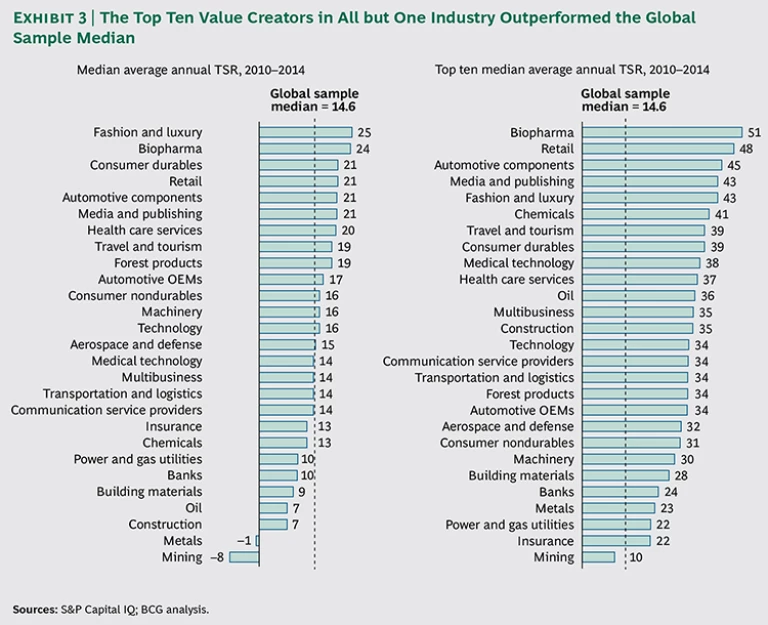
A third structural factor affecting our annual rankings has to do with the particular industry a company happens to be in. At any given moment, some industries will be performing substantially better than others. This, too, has an impact on which companies end up among the very top value creators. For example, consider the biopharma sector, which, with a median average annual TSR of 24 percent, was one of the best-performing industries (second only to fashion and luxury) in the 2010–2014 period. Similarly, biopharma companies are well represented among the world’s best performers. They take four of the top ten spots in our overall global ranking. In addition to Pharmacyclics at number one, the list includes Ireland’s Jazz Pharmaceuticals at number five, Regeneron Pharmaceuticals at number seven, and Israel’s Taro Pharmaceutical Industries at number eight. Biopharma’s dominance of the large-cap top ten is even more pronounced, with companies from the sector capturing five of the top ten spots: U.S. companies
“What About the Rest of Us?”
Faced with the extraordinary TSR performance of these top value creators, we can well imagine that the reactions of many senior executives may be something like the following: “That’s great for those leading companies, but what about the rest of us? My company didn’t have the good fortune to hit the innovation jackpot or start from a small base or have the unusual growth trajectory of a big company like Apple. My sector is facing serious headwinds, putting a drag on our TSR performance.”
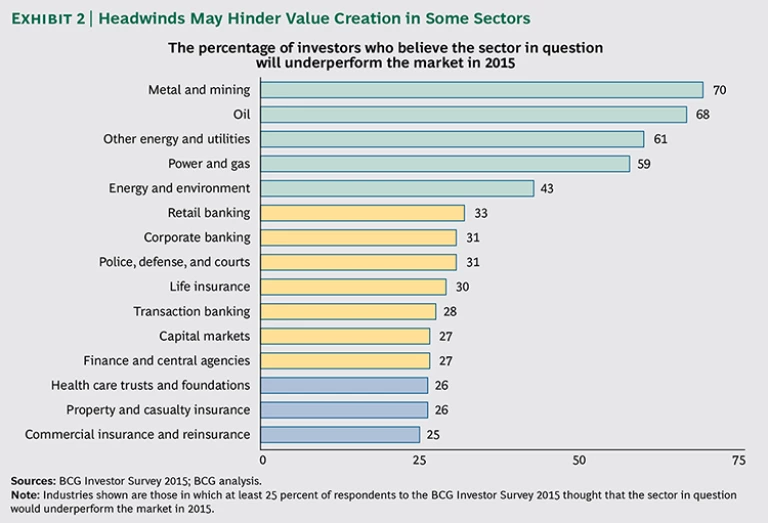
We’re sympathetic to that reaction. Partly, it’s a matter of outlook. A substantial part of the TSR that companies have generated in recent years has been achieved via multiple expansion. But if the expectations of the respondents to BCG’s annual investor survey are any indication, valuation multiples may be declining rather than rising in the near future. (See Investors Anticipate a Soft Landing BCG article, May 2015.) And many investors believe that a number of specific sectors will underperform the market in the years ahead. (See Exhibit 2.) So, it’s likely that many companies will fall into the catgory of “the rest of us” in years to come.
But we are also sympathetic out of conviction. The fact is that, no matter how large a company happens to be or how many challenges its industry may be facing, some companies nevertheless substantially outperform the average. The graph on the left in Exhibit 3 shows the median average annual TSR for the 27 industries that we tracked this year. The medians ranged from a low of –8 percent (in mining) to a high of 25 percent (in fashion and luxury). The top value creators in each industry, however, substantially outpaced their industry medians by anywhere from 8 percentage points (in insurance) to 28 percentage points (in both chemicals and construction). And as the graph on the right in Exhibit 3 illustrates, in every sector except mining, the median average annual TSR of the top ten beat the median average annual TSR of 14.6 percent for the entire Value Creators database.
In the end, what really matters is not a company’s absolute TSR performance but, instead, its performance relative to its peers. Put another way, what counts is not the cards a company is dealt but rather how it plays those cards to optimize its value-creation potential.
That’s why this year’s Value Creators report highlights the experiences of two companies, each facing a serious crisis, that used a focus on value creation to jump-start a far-reaching organizational and
How they did so contains lessons for every company. Maersk and PulteGroup may not be top value creators on a global basis, but they are classic examples of value creation for the rest of us.


