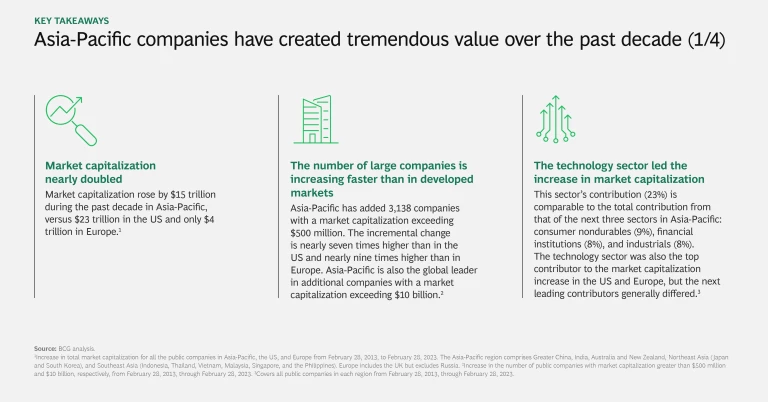
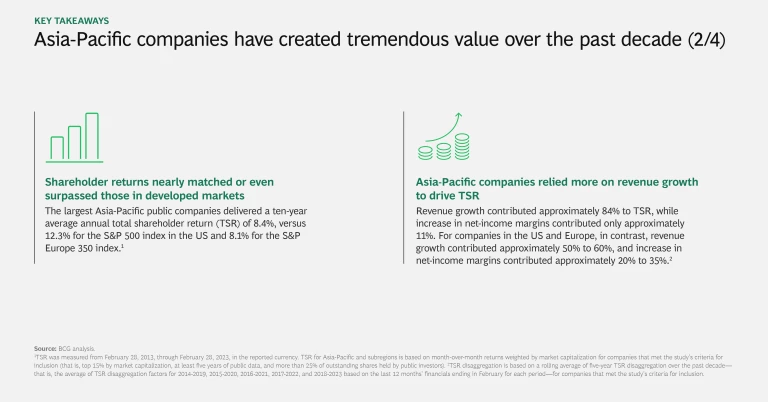
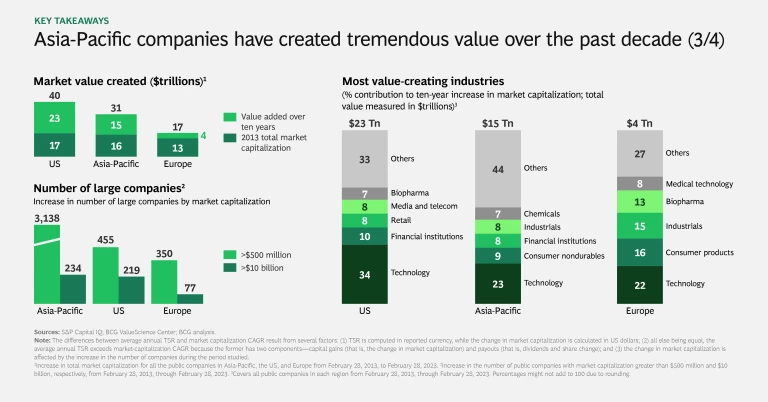
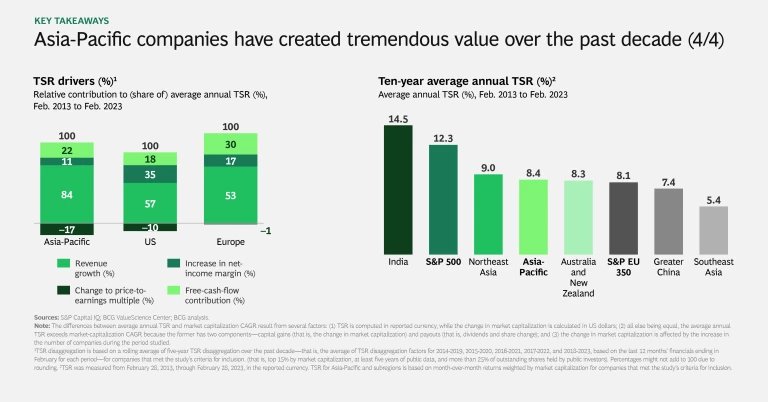
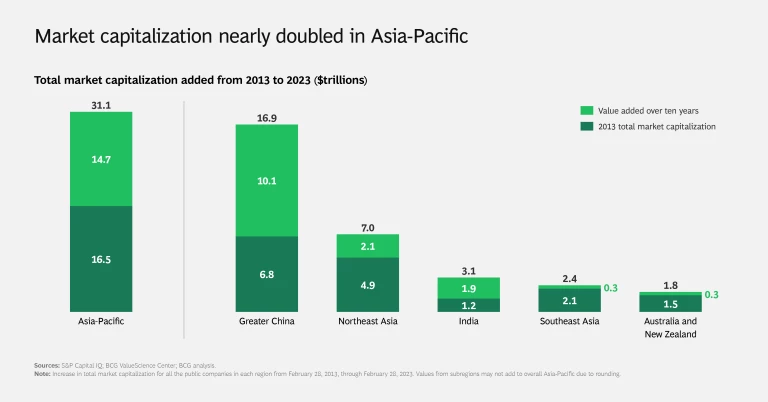
Asia-Pacific companies have created tremendous value during the past decade. Market capitalization increased by $15 trillion, nearly doubling the size of the region’s equity markets. In comparison, market capitalization rose by $23 trillion in the US and by only $4 trillion in Europe. The largest Asia-Pacific public companies, based on market capitalization, delivered an average annual total shareholder return (TSR) of 8.4%, versus 12.3% for the S&P 500 index in the US and 8.1% for the S&P Europe 350 index.
BCG’s 2023 Asia-Pacific Value Creators study explored the factors driving the region’s strong performance. This was our first value creators study focusing on the Asia-Pacific region. BCG has published annual rankings of the top value creators globally, and perspectives on value creation trends, since 1999.
The Asia-Pacific study analyzed market capitalization to evaluate the size and growth of the equity markets over the past decade. It analyzed average annual TSR to assess the value created for shareholders during the same period. We conducted these analyses for the overall region and five subregions. (See “About Our Methodology.”) We found distinct patterns of value creation in Asia-Pacific compared with other global regions and important similarities and differences among the Asia-Pacific subregions. The slideshow provides an overview of the findings.
Three Pillars of Value Creation
The acceleration of scale, pursuit of growth, and leadership of the technology sector have provided the foundation for Asia-Pacific’s value-creation journey.
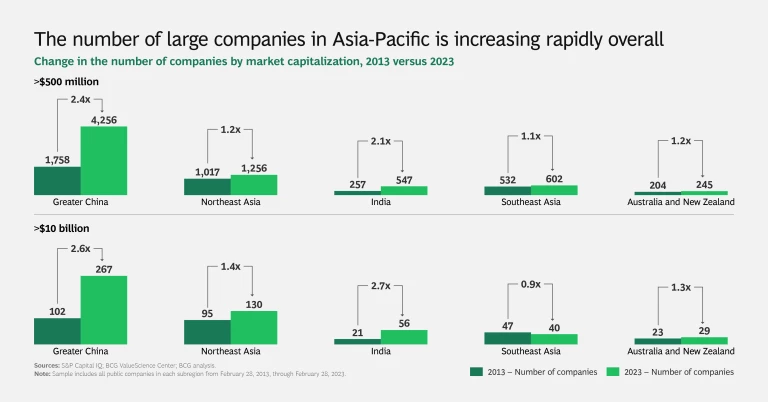
The Acceleration of Scale. The number of large companies by market capitalization is increasing faster in Asia-Pacific than in other regions. Since 2013, Asia-Pacific has added 3,138 companies with a market capitalization exceeding $500 million. The incremental increase is nearly seven times higher than in the US and nearly nine times higher than in Europe. Asia-Pacific is also the global leader in additional companies with a market capitalization exceeding $10 billion: 234 versus 219 in the US and 77 in Europe. Market capitalization is growing fast for public companies of all sizes in Asia-Pacific, reflecting the strong appetite of its equity markets to deploy and grow capital.
Market capitalization is growing fast for public companies of all sizes in Asia-Pacific.
Industry sectors in Asia-Pacific, particularly in emerging markets, typically have a greater number of companies competing for market share than those in developed markets. This creates more opportunities for M&A aimed at consolidation, especially during a downturn. Companies with stronger balance sheets will be better positioned to acquire relatively smaller competitors and pay lower valuation multiples.
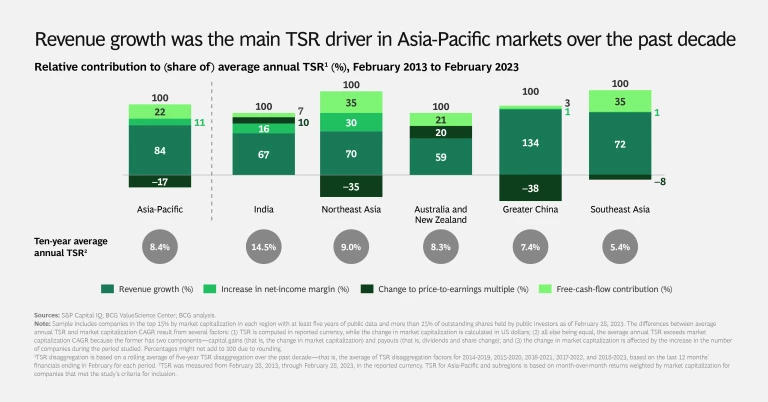
The Pursuit of Growth. Since 2013, Asia-Pacific companies’ revenue growth has contributed approximately 84% to total value creation, as measured by TSR, while increase in net-income margin has contributed only approximately 11%. This contrasts sharply with the US and Europe, where revenue growth contributes approximately 50% to 60% and increase in net-income margin contributes approximately 20% to 35%. Companies in developing markets, such as those in Asia-Pacific, can achieve above-average TSR by accelerating top-line growth. However, those in more mature global markets use a more balanced mix of growth, profitability improvements, and cash returns achieved through scale efficiencies, operational enhancements, and capital allocation, among other levers.
As Asia-Pacific markets mature, companies are likely to find that high revenue growth alone does not necessarily lead to high TSR. Understanding the relationship between growth and the other TSR drivers is essential to achieve strong and sustainable value creation in the medium to long term.
The Leadership of Technology. Global technology trends—such as digital infrastructure, clean technology, e-commerce, and mobility—have played out strongly in the Asia-Pacific region during the past decade. It is no surprise, then, that the technology sector has been the leading contributor to the market-capitalization increase in the region. This sector’s contribution (23%) is comparable to the total contribution from that of the next three sectors combined: consumer nondurables (9%), financial institutions (8%), and industrials (8%). The technology sector also led the market-capitalization increase in the US and Europe, contributing 34% and 22%, respectively. The financial-institutions sector was the second largest contributor in the US, followed by retail and media and telecommunications. In Europe, the consumer-products sector held the second position, followed by industrials and biopharma.
Highlighting the Subregions’ Similarities and Differences
The Asia-Pacific region is not monolithic. To understand the similarities and differences across the region, we analyzed market capitalization and TSR for Greater China; India; Australia and New Zealand; Northeast Asia (Japan and South Korea); and Southeast Asia (Indonesia, Thailand, Vietnam, Malaysia, Singapore, and the Philippines).
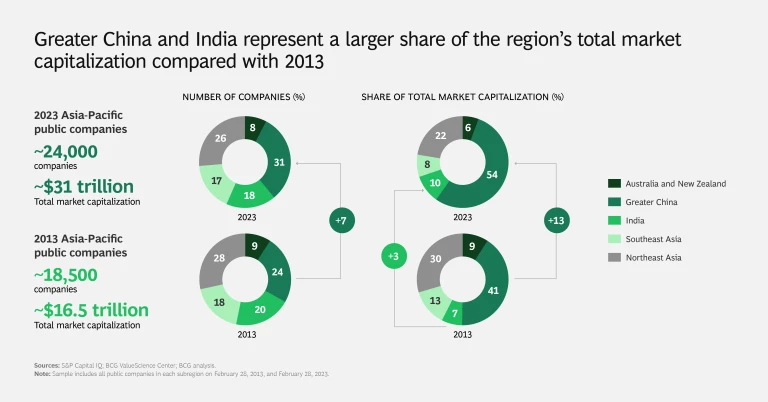
Market Capitalization. In 2023, the Asia-Pacific region had approximately 24,000 listed companies, with a combined market capitalization of approximately $31 trillion. Greater China accounted for 54% of the total market capitalization, followed by Northeast Asia (22%), India (10%), Southeast Asia (8%), and Australia and New Zealand (6%).
In 2023, Greater China accounted for 54% of the total market capitalization.
This is a significant shift in relative shares from ten years ago. The combined share of companies in Greater China and India increased from 48% of the total market capitalization in 2013 to 64% in 2023. The other subregions lagged in market-capitalization growth.
The increasing number of large companies in Greater China and India is a major reason. In these two subregions, the number of companies with more than $10 billion in market capitalization increased by 200 between 2013 and 2023, and the number with more than $500 million in market capitalization rose by 2,788. This compares with a net increase of 34 and 350 companies, respectively, in the other subregions—primarily driven by Northeast Asia, which added 35 and 239 companies, respectively. The number of companies with more than $10 billion in market capitalization decreased by 7 in Southeast Asia and increased by 6 in Australia and New Zealand. The number with more than $500 million in market capitalization increased by 70 in Southeast Asia and 41 in Australia and New Zealand.
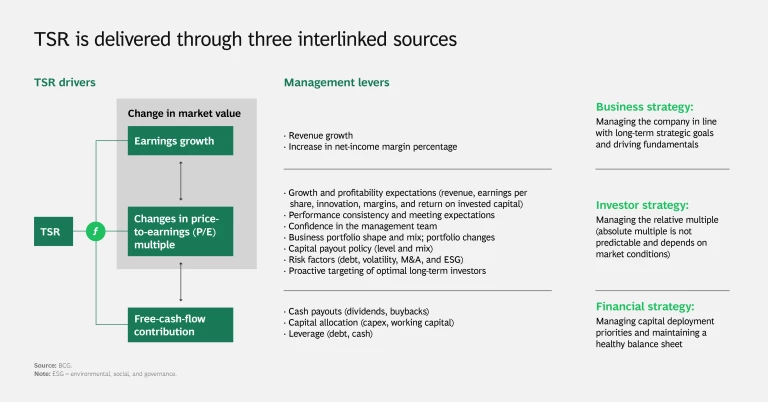
TSR. In our analyses, TSR is derived from three interlinked sources: earnings growth (which comprises revenue growth and changes in net-income margin percentage), changes in price-to-earnings (P/E) multiples, and free-cash-flow contribution yield (that is, dividends and share repurchases).
Companies in Greater China and India have the lowest payouts contribution to average annual TSR (3% and 7%, respectively) among the subregions—an indication that they are reinvesting capital to promote growth. In more mature markets, the percentages are higher. Specifically, payouts contribute approximately 35% of the total average annual TSR delivered in Northeast Asia and Southeast Asia (driven by Malaysia and Singapore), and they contribute 21% in Australia and New Zealand. The higher payouts in Northeast Asia have coincided with a rise in shareholder activism. Activist investors have been pushing Japanese and South Korean conglomerates to generate shareholder value through cash payouts as well as capital allocation toward environmental, social, and governance (ESG) agendas.
The higher payouts in Northeast Asia have coincided with a rise in shareholder activism.
P/E multiple expansion made a significant contribution to TSR for companies in India, as well as in Australia and New Zealand. Multiples compressed in the other regions. An increase in net-income margins was an important contributor in India and Northeast Asia.
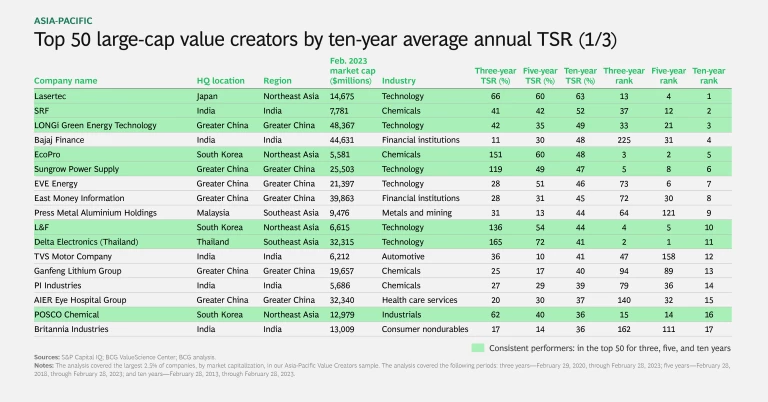
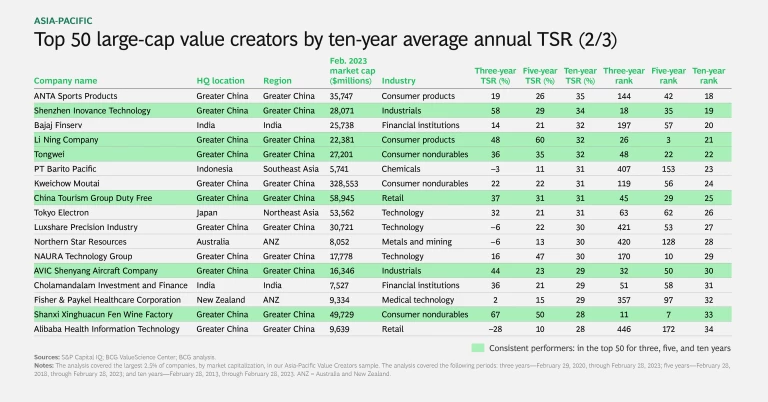
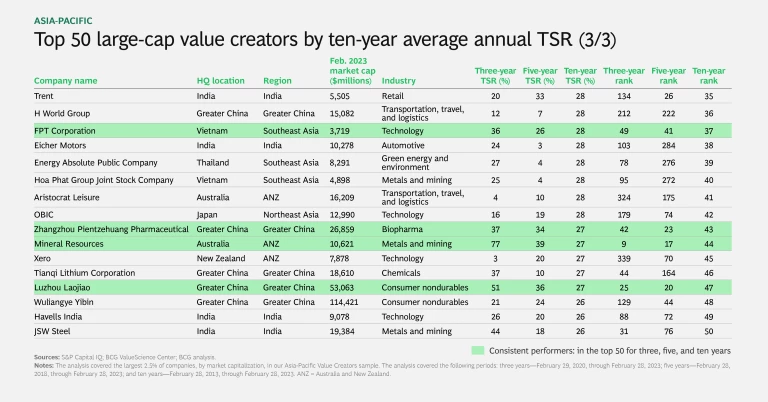
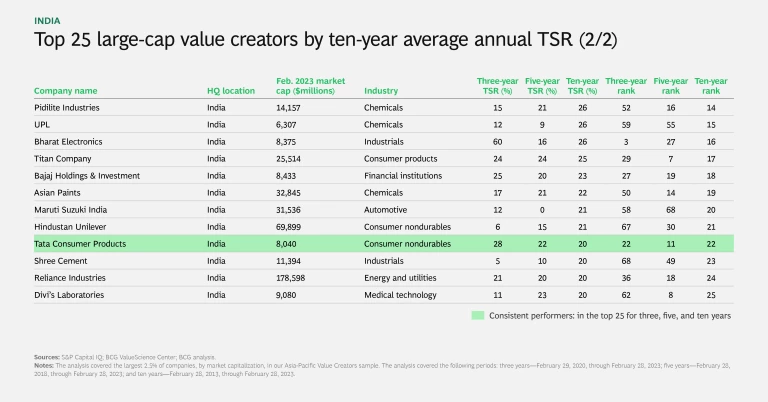
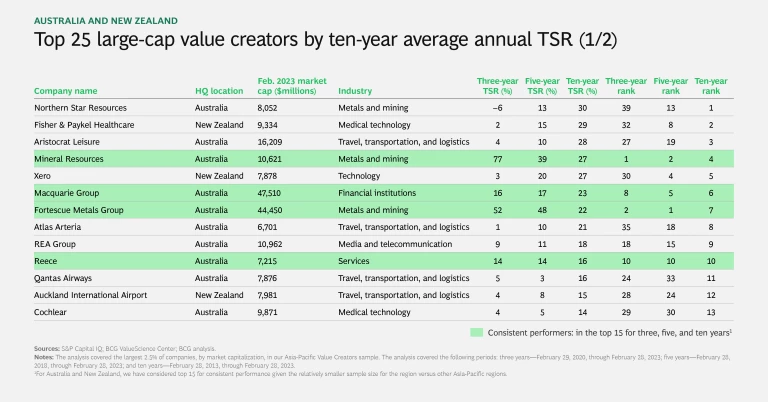
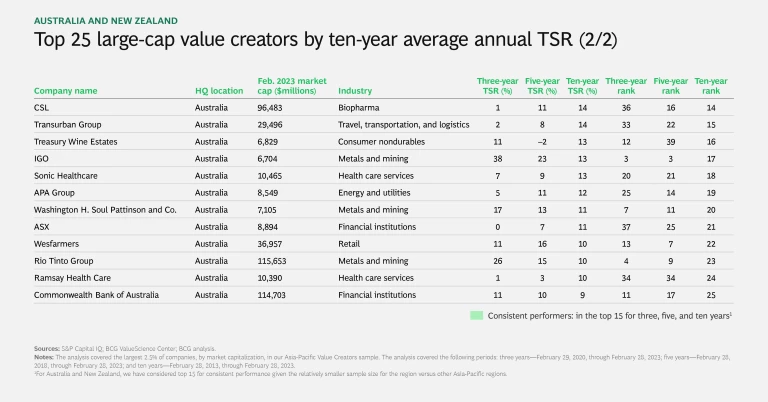
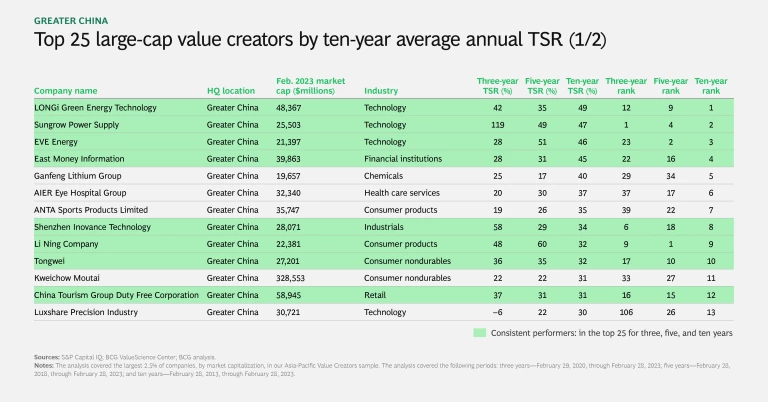
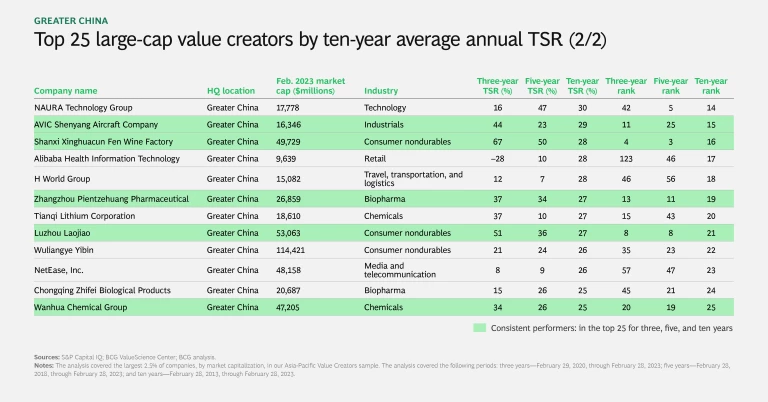
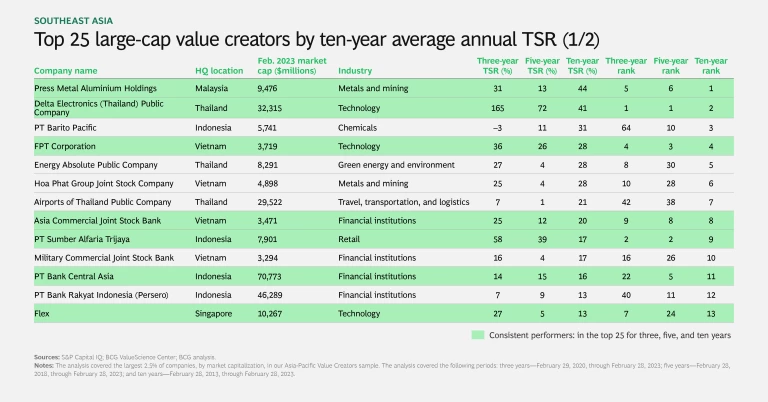
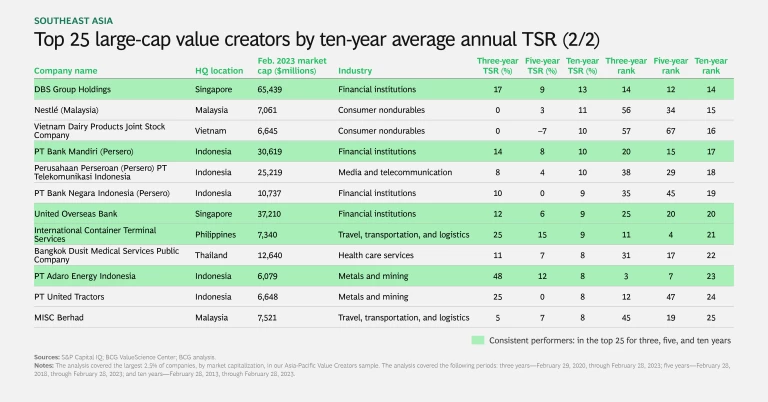
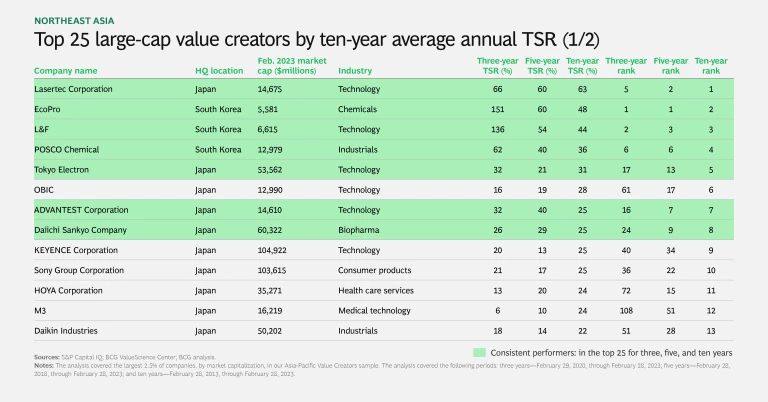
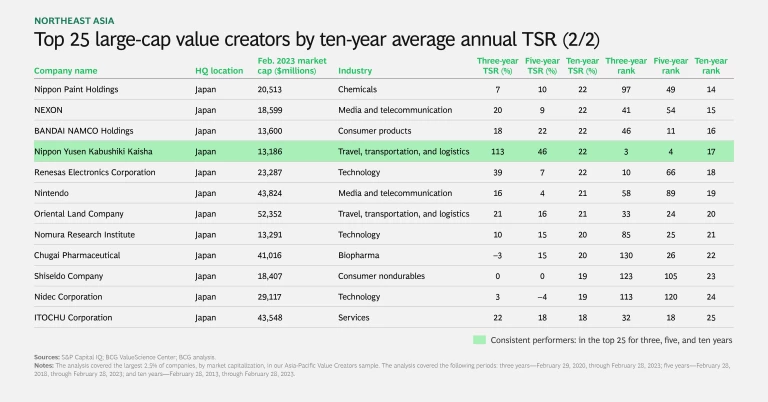
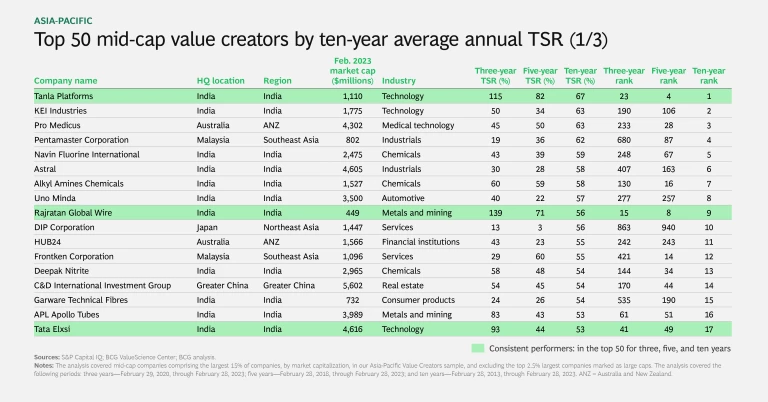
The top 50 large-cap Asia-Pacific companies by average annual TSR delivered an average return of 34% over the ten-year period. The average annual return ranged from 26% to 63% for specific companies. This significantly outperformed the S&P 500’s long-term average annual return of approximately 10% to 12%.
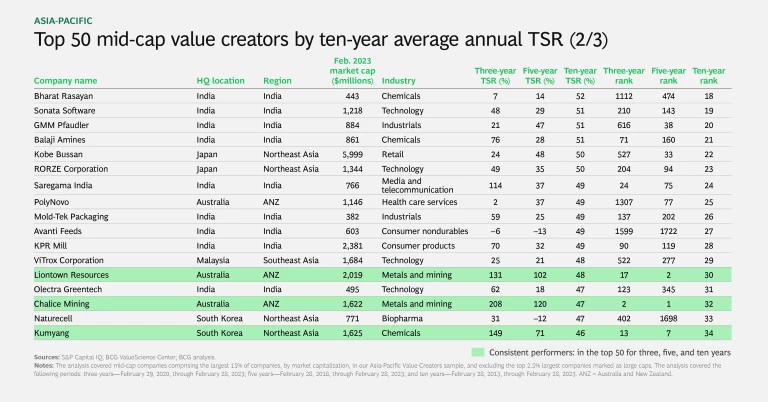
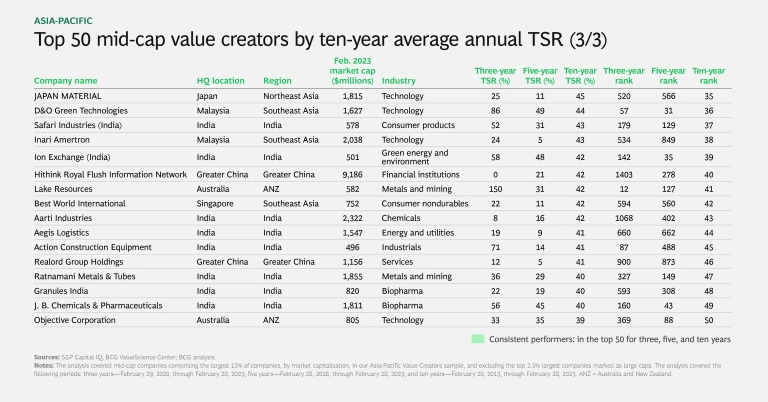
Among the top 50 companies, 44% are based in Greater China, 22% in India, and approximately 10% to 12% each in the other Asia-Pacific regions. Eighteen companies have been in this elite group consistently—over periods of three, five, and ten years. The industries with the highest representation among these 18 companies are technology (6), industrials (3), consumer nondurables (3), and chemicals (2). Other sectors with a considerable presence in the top 50 are financial institutions, metals and mining, and retail.
Breaking Down the Subregions’ Performance
The following breakdown of subregional performance, presented in descending order of ten-year average annual TSR, reflects the stage of economic development and unique value-creation drivers in each subregion and country.
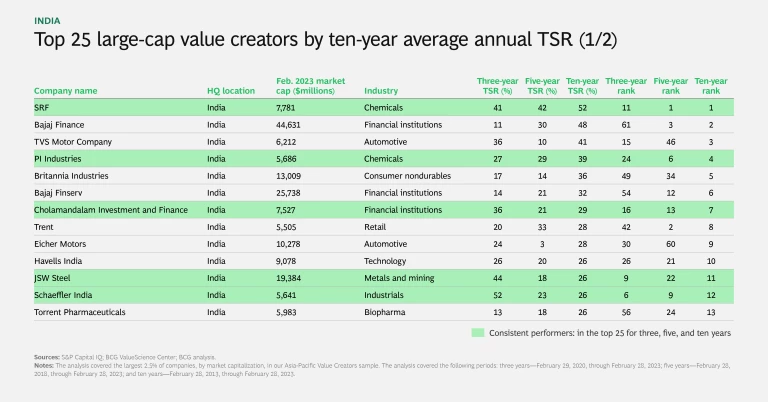
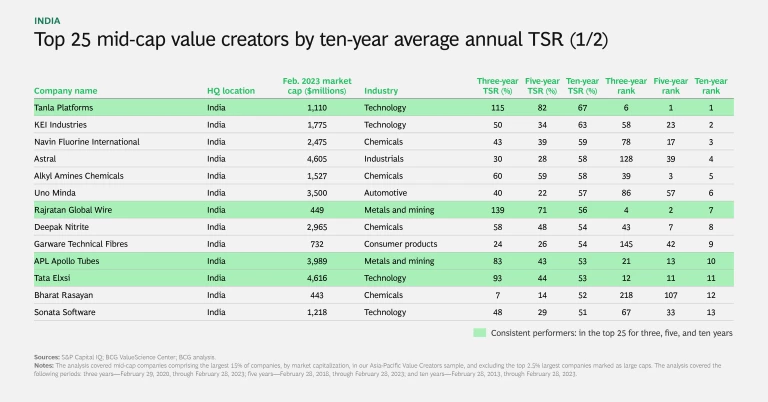
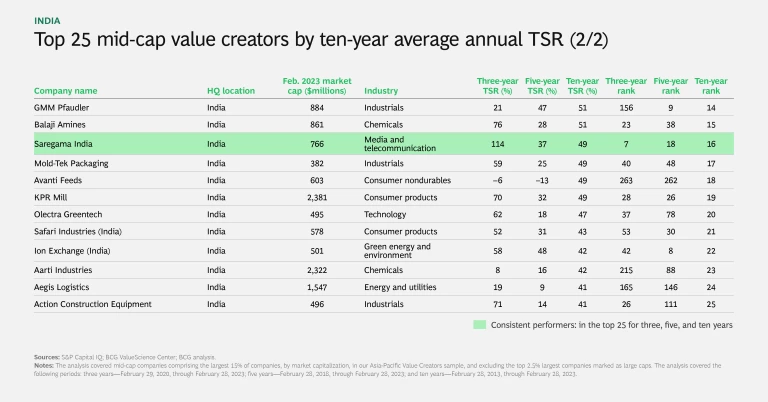
India. Indian companies have delivered an impressive average annual TSR of approximately 14% over the past decade. This performance has been driven by strong revenue growth, improving margins, and expanding multiples. The contribution of cash payouts has been low compared with that of the other TSR drivers in India and in the overall Asia-Pacific market. India’s public-equity market reached $3.1 trillion in 2023, adding $1.9 trillion in ten years. The number of public companies with a market capitalization exceeding $500 million more than doubled during this period, increasing from 257 to 547. In this context of growth, India has also seen a strong uptick in M&A activity as a lever for companies to accelerate their growth agendas.
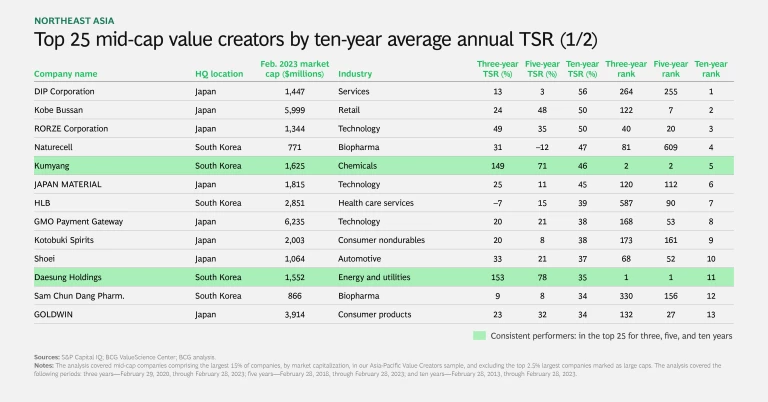
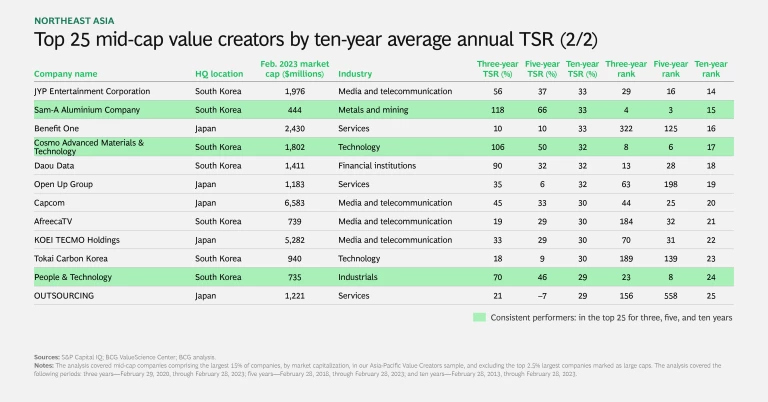
Northeast Asia. Companies in Northeast Asia had a ten-year average annual TSR of approximately 9%, resulting from a relatively balanced combination of revenue growth, margin improvement, and payouts. This $7 trillion market had more than 1,200 companies with more than $500 million in market capitalization, which is slightly higher than a decade ago.
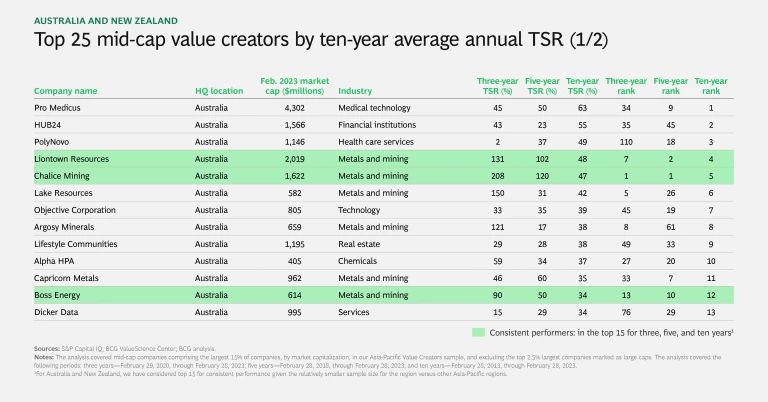
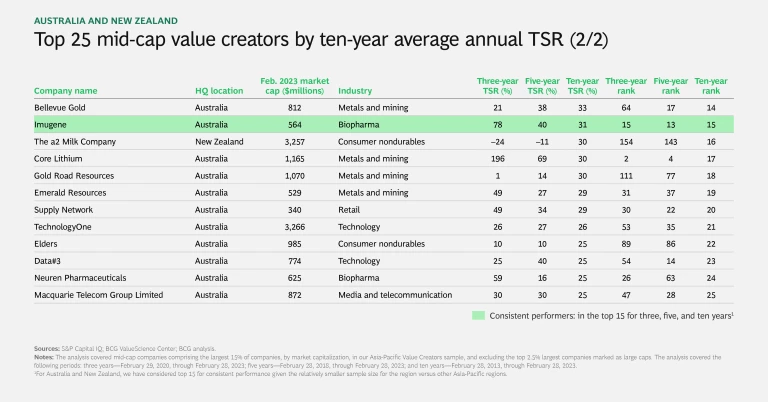
Australia and New Zealand. The ten-year average annual TSR for companies in these countries was approximately 8%. Revenue growth was the main driver, with an increase in multiples and cash payouts also making sizable contributions. This subregion is the smallest equity market in Asia-Pacific. Its total market capitalization is $1.8 trillion, after increasing by $300 billion during the past decade.
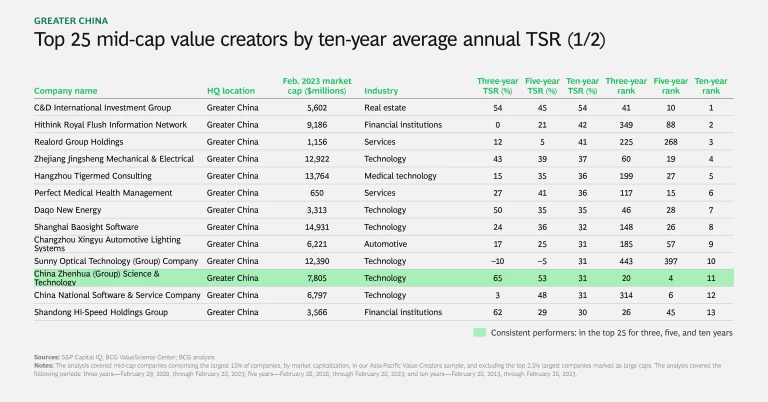
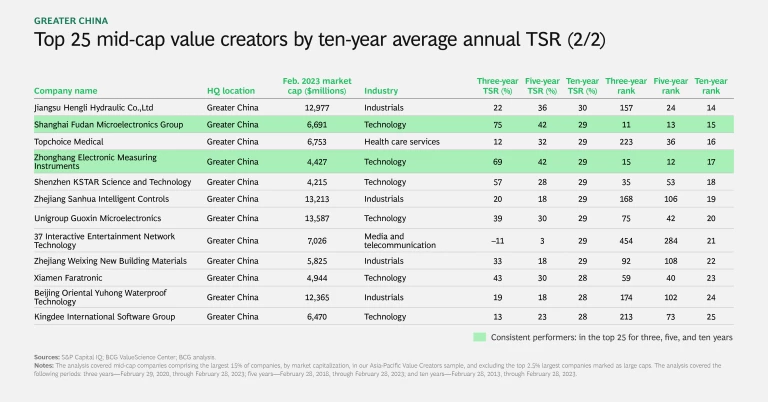
Greater China. This subregion’s ten-year average annual TSR was approximately 7%, overwhelmingly driven by revenue growth. The other TSR drivers made little or no contribution. Multiples in this subregion’s equity markets are contracting as a result of geopolitical uncertainties, trade wars, government policies, and tighter regulation of the technology sector. Despite these headwinds, the subregion dominates the Asia-Pacific region in terms of market size, incremental increase in market capitalization, number of companies, and incremental increase in companies. Indeed, the growth of this subregion’s equity markets is attributable to a sharp increase in the number of public companies over the past decade, rising from 4,439 to 7,558. The number of companies with a market capitalization exceeding $500 million increased by approximately 2,500 during this period.
Southeast Asia. Companies in Southeast Asia have underperformed relative to the other subregions and global markets over the past decade, delivering an average annual TSR of approximately 5%. The contributions of revenue growth and cash payouts were offset to some extent by contracting multiples. The subregion’s total market capitalization was $2.4 trillion in 2023, an increase of $300 billion during the past decade.
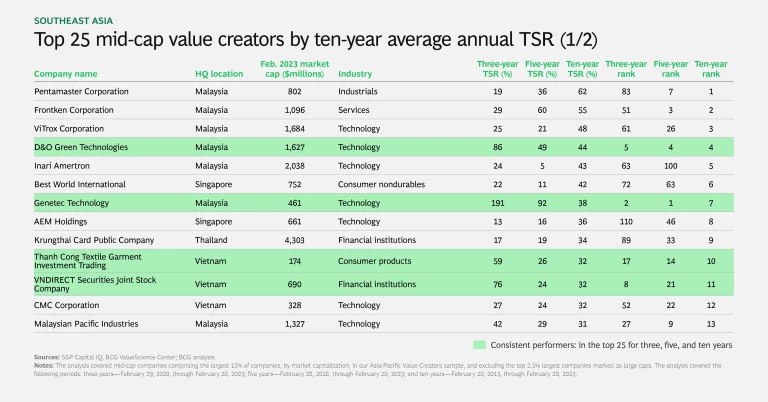
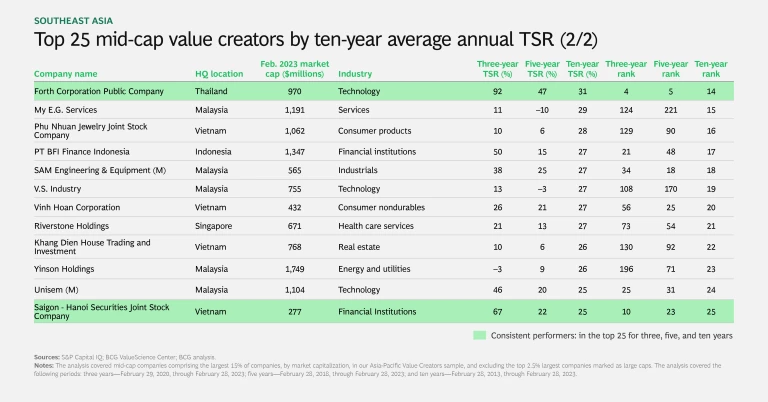
Although the subregion as a whole has underperformed, companies in Vietnam and Indonesia have delivered strong average annual TSR of 11% and 8%, respectively, driven by robust economic growth. In contrast, companies in Malaysia, Singapore, Thailand, and the Philippines have relied largely on cash payouts to shareholders and delivered an average annual TSR of approximately 4% to 5%. Throughout the subregion, companies in the technology and green-energy and environment sectors have achieved high annual average TSR. In addition, Southeast Asia is home to six of the top 50 Asia-Pacific large-cap value creators.
Charting a Path to Strong and Sustainable Value Creation
Companies headquartered in India and Greater China and from certain industries, such as technology and financial institutions, stand out as the Asia-Pacific region’s leading value creators. However, there are top performers from other subregions and sectors as well, indicating that any company can excel in value creation.
Top performers have emerged across subregions and industries, showing that any company can excel in delivering shareholder returns.
As companies chart their paths to strong and sustainable shareholder value creation, it is important to understand that the right approach depends on their starting points—such as relative market position, company size and maturity, and capital-markets context. In some cases, value creation should emphasize revenue growth or cash payouts, while in other cases a more balanced approach across growth, margins, and cash payouts is optimal. In the coming years, as the region’s markets mature, more companies will need to consider all the drivers of TSR in order to evolve to their next phase of value creation.
To better understand its unique starting point, a company should analyze and understand how companies in its subregion and industry have created value historically and which TSR drivers have been most influential. The company can then compare its own disaggregated TSR performance with that of its subregion and industry, and apply the insights to prioritize strategic options and evaluate complex strategic tradeoffs.
Stay ahead with BCG insights on people strategy
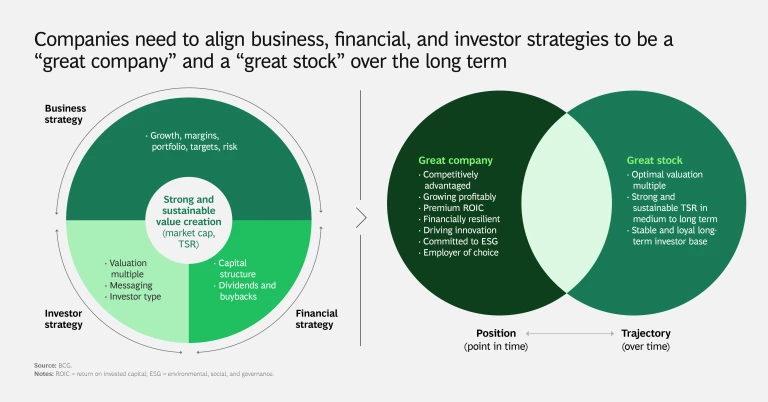
By viewing their business from the shareholder perspective, executives can better align management decisions with the achievement of value-creation outcomes. It is not enough to be a great company with a strong competitive advantage, growing profitability, and achieving a premium return on invested capital. A company must also be considered a great stock that delivers on shareholders’ expectations over the medium to long term.
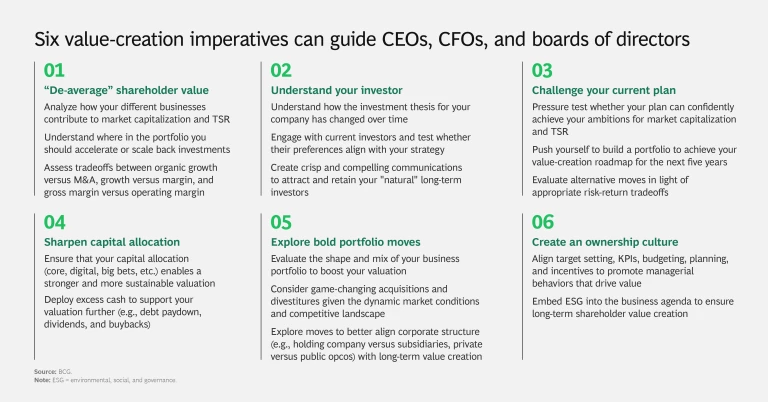
BCG’s TSR strategy framework provides tools for CEOs, CFOs, and boards of directors to align business, financial, and investor strategies to deliver strong and sustainable value creation over time. Page 12 of the slideshow outlines six distinct actions leaders can consider.
About Our Methodology
Change in Market Capitalization. Market capitalization is the total market value of all outstanding shares in a company. It is calculated as share price times total outstanding shares. We analyzed the change in market capitalization for all publicly listed companies in Asia-Pacific, the US, and Europe over the past decade to evaluate the increase in market size, the increase in the number of large companies, and various industries’ contributions to growth in market capitalization.
TSR. TSR measures the combination of capital gains and free-cash-flow contribution (dividend yield and change in the number of shares outstanding) for a company’s stock over a given period. We analyze TSR to assess the overall value created for shareholders. It is the most comprehensive metric for measuring a company’s shareholder value creation performance.
We disaggregated TSR performance into four investor-oriented financial metrics: revenue growth, increase in net-income margin, change in price-to-earnings multiple, and free-cash-flow contribution. Our analysis used a rolling average of five-year average annual TSR disaggregation over the past decade: that is, the average of TSR disaggregation factors over 2014-2019, 2015-2020, 2016-2021, 2017-2022, and 2018-2023.
We analyzed value creation for 2,692 companies. To arrive at this sample, we began with data provided by S&P Capital IQ that covers approximately 24,000 companies. We eliminated companies that either were not listed on a world stock exchange for five consecutive years or did not currently trade at least 25% of their shares in public capital markets.
Given the different development stages and average sizes of companies in Asia-Pacific subregions, we included only the top 15% of public companies by market capitalization in each location. This covers, on average, approximately 70% of the total market capitalization for each location, ensuring that each location and subregion is adequately represented in the sample. We further refined the sample by organizing the companies into 20 industry groups.
Our large-cap rankings comprise companies in the top 2.5% of companies by market capitalization from each location, for a total of nearly 495 companies. Our mid-cap rankings comprise companies in the top 15% of companies by market capitalization from each location, excluding the top 2.5% classified as large-caps. In both cases, we based rankings for the region and subregions on the ten-year average annual TSR of the individual companies. We also analyzed the three-year and five-year average annual TSR for comparison.
Rankings of companies in our 2023 database do not include companies that dropped off the list in prior years as a result of mergers, bankruptcies, or other events.
Sources: S&P Capital IQ; BCG ValueScience Center.
Note and Disclaimer
Disclaimer: The materials contained in this article and slideshow are designed for information purposes only. BCG does not provide fairness opinions or valuations of market transactions, and these materials should not be relied on or construed as such. A company’s inclusion in the ranking does not represent an endorsement by BCG. This article and slideshow do not provide investment or financial advice. Users should contact their advisor to receive such advice.
BCG has used publicly available data. BCG has not independently verified the data and assumptions used in these analyses. BCG has made no undertaking to update these materials after the date they were gathered for publication, after which such information may become outdated or inaccurate. Changes in the underlying data or operating assumptions will have an impact on the analyses and conclusions. The underlying model used for this study is designed to work across industries and is no replacement for a detailed calculation that accommodates company- or industry-specific adjustments, which may have an impact on the accuracy of the results.
Acknowledgments: The authors wish to thank Ryoji Kimura, Rohit Ramesh, Jeff Kotzen, Jody Foldesy, Hady Farag, and Vinayak Jain for their specific contributions to this report as well as their continued guidance and support.
