After seeming to turn the corner during the previous five-year period, the global chemical industry’s value creation performance deteriorated in our most recent analysis. The industry’s total shareholder return (TSR) declined and fell below the median for all industries in the BCG Value Creators database.
However, while some sectors and regions witnessed significant value destruction—accompanied by low capacity utilization, price erosion, and unprecedented plant closures—others delivered standout performance. This finding points to the continued importance of developing a strategy that addresses the risks of commoditization in chemicals, permits more flexible responses to value chain dynamics and geographic exposure, and maintains a clear strategic focus.
Revenue Growth and Dividend Payouts Were Key Value Creation Drivers
In this report—the thirteenth since the series began—the global chemical industry delivered average annual TSR for the five years to December 2024 of 7%, compared with 12% from 2019 to 2023. The weakened performance puts the industry back at the level it experienced during the period from 2018 to 2022, when average annual TSR for chemicals was also 7%. Unlike in that earlier period, however, industry TSR in our latest report fell below the 10% median performance for all industries.
The starting point for TSR calculations has a material impact on overall five-year performance. The average share price was lower at the beginning of 2019 than at the beginning of 2020, which helped the industry deliver better TSR performance from 2019 to 2023 than during the latest period.
From 2020 to 2024, soft demand, overcapacity in multiple products and value chains, and nontransferable cost pressures held back industry TSR. Unless the chemical industry can overcome these challenges, it will continue to struggle in its efforts to improve shareholder value creation.
Company size was not a significant driver of TSR performance. In the past, large-capitalization players have outperformed their smaller peers. But we found no difference in TSR from 2020 to 2024 linked to company size. Owing to greater fragmentation, overcapacity, price volatility, and cost and regulatory pressures, investors no longer treated large multispecialty, petrochemical, and base chemical players as safe havens in turbulent times. (See Exhibit 1.)
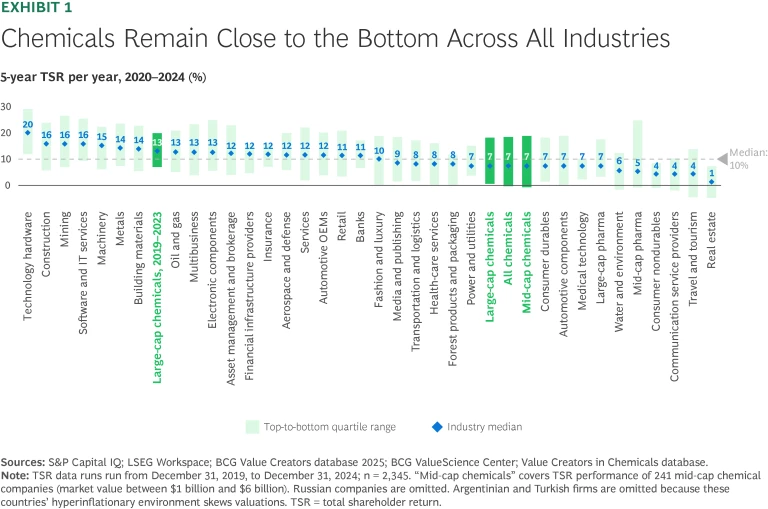
Revenue growth and dividend yield were the main value creation drivers for both large-cap and mid-cap companies. Although both groups grew annual revenues by about 7% and increased dividends by about 2% per year from 2020 to 2024, the TSR benefits were partly offset by declining EBITDA margins and by shrinking valuation multiples, as investors grew more cautious amid structural cost pressures and an uncertain outlook. Overall, EBITDA margins fell by an average 1% per year and multiples by 1.1% per year over the five-year period.
For this report, we have analyzed data from 322 publicly listed chemical companies. We classify companies with a market value of more than $6 billion as large-cap players and those with a market value of $1 billion to $6 billion as mid-cap players. Companies typically released data for the last financial year in early to middle 2025. To calculate individual companies’ TSR, we considered the contribution of the various components that make up this metric. (See the sidebar “How We Calculate and Report TSR.”)
How We Calculate and Report TSR
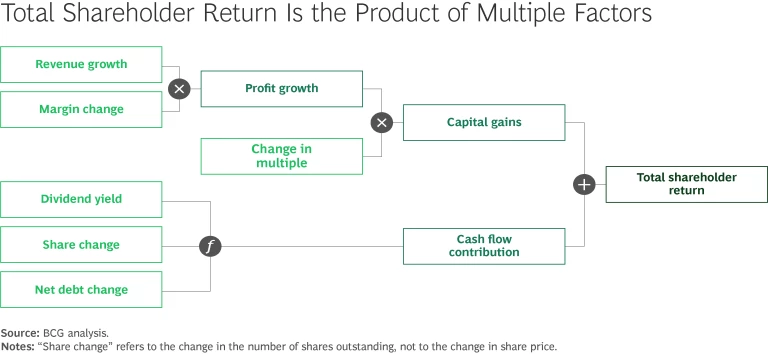
Several factors affect TSR. Readers of BCG’s Value Creators series may be familiar with our methodology for quantifying the relative contributions of the various components of TSR. (See the exhibit) We use the combination of revenue (sales) growth and change in margins as an indicator of a company’s improvement in fundamental value. We then use the change in the company’s valuation multiple to calculate the impact of investor expectations on TSR. Together, those two factors determine the change in a company’s market capitalization. Finally, our model also tracks the distribution of free cash flow to investors and debt holders—in the form of dividends, share repurchases, and repayments of debt—to determine the contribution of free-cash-flow payouts to a company’s TSR.
All of these factors interact—sometimes in unexpected ways. A company may increase its earnings per share through an acquisition and yet create no TSR if the acquisition erodes its gross margins. Moreover, some forms of cash contribution (such as dividends) can impact a company’s valuation multiple differently than others (such as a share buyback); the effects are complex.
In this report, the TSRs used for groups and for purposes of comparison are generally medians. The TSRs associated with individual companies are straight calculations of those companies’ capital gains—changes in share price value plus dividend value—rounded to the nearest percentage.
Some Markets and Sectors Saw Shareholder Value Destruction
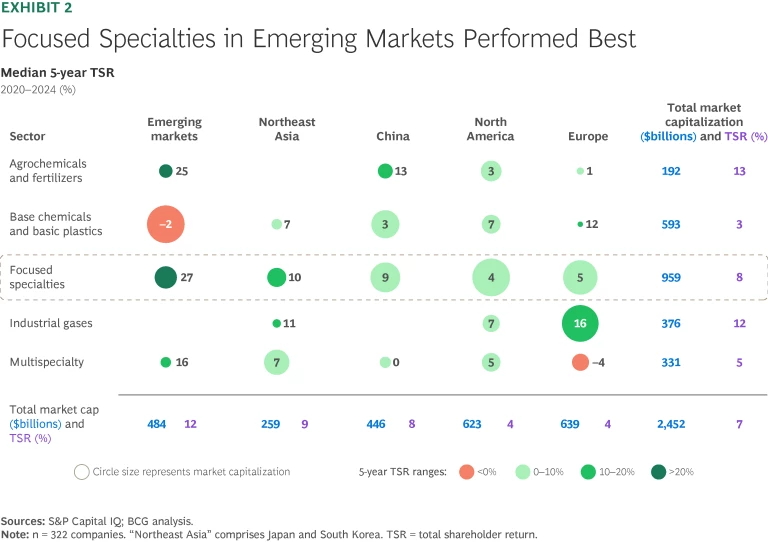
Focused specialty chemicals performed well at the sector level, as they have consistently done over the past 12 years. Industrial gases and agrochemicals and fertilizers also performed strongly. On the other hand, two sectors—base chemicals and plastics, and multispecialty chemicals—bore the brunt of industrial overcapacity and pricing pressures and delivered TSR of 3% and 5%, respectively.
We observed notable value destruction in specific regions and sectors. Five-year TSR in the European multispecialty sector was –4%, while base chemicals and basic plastics based in emerging markets saw TSR of –2%, due in part to the effects of overcapacity in China. On the plus side, focused specialties players in emerging markets outperformed all other sectors and regions as a result of demand growth and rising consumer wealth. (See Exhibit 2.)
Regionally, emerging market chemical companies were the strongest performers overall, delivering average five-year TSR of 12%. However, there were significant variations within this group. India was responsible for the group’s pole position. It delivered TSR of 28%, helped by robust domestic demand, policy tailwinds (including economic reforms and infrastructure investment), and strong growth fundamentals. Conversely, other emerging markets—including the Middle East, ASEAN, and Latin America—destroyed shareholder value, as a result of soft demand and overcapacity. So did the UK and Western Europe, although companies in these regions also felt the effects of high energy costs and a high regulatory burden. (See Exhibit 3.)
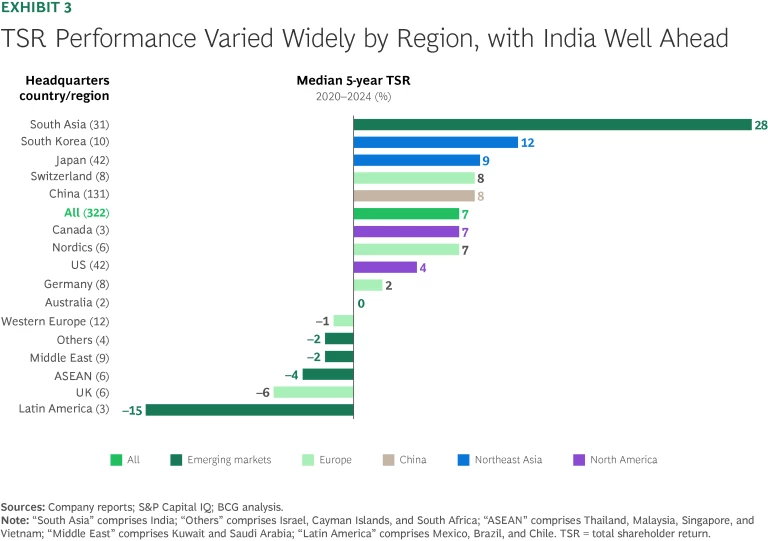
With the exception of ASEAN (which delivered TSR of –4%), Asia continues to be a leading driver of shareholder value creation for the global chemical industry. Four of the five countries with above-average TSR from 2020 to 2024 were from Asia: India, China, and the Northeast Asian countries of South Korea and Japan. (See the sidebar “Shareholder-Friendly Practices, Exchange Rates, and Electronics Demand Boosted Japan’s TSR Performance.”) In addition, nearly all of the top 10 large-cap TSR performers over 5-, 10-, and 20-year time frames were from Asia.
Shareholder-Friendly Practices, Exchanges Rates, and Electronics Demand Boosted Japan’s TSR Performance
- Japanese focused and multispecialty players with exposure to electronic and semiconductor materials saw strong growth, robust profitability, and higher multiples thanks to strong global demand for electronic goods.
- Companies with large overseas revenues have benefited from favorable movement in exchange rates over the period, which boosted profitability.
- Many Japanese chemical companies have adopted more shareholder-friendly capital allocation practices. For instance, they’ve improved investor returns by increasing dividend payouts or by buying back shares.
Top-Line Growth, but Without Much Gain
Several factors played a part in the global industry’s weaker TSR performance. End-market demand for chemicals remained soft from 2020 to 2024. Customers across a range of manufacturing sectors maintained high inventory levels and faced substantial pressure from rising energy, logistics, and regulatory costs. This combination led to tough price negotiations between manufacturing companies and their customers, which in turn put pressure on chemical companies’ profit margins. Overall, most chemical companies did grow their top line, but only by compromising on their margins.
Structural overcapacity also contributed to pricing pressures in the chemical industry. This has been a perennial problem for many parts of the industry. For example, since 2015, the growth in global capacity for bulk chemicals has exceeded demand by 1% to 1.5% per year—with the disparity particularly noticeable with olefins and polyolefins—pushing factory utilization rates to between 70% and 80%, below profitability and historical utilization levels of around 90%.
In recent years, a substantial increase in China’s production capacity and a rising volume of Chinese exports of commodity chemical products have exacerbated the industry’s overcapacity problem and created challenges for regions, notably Europe and the Middle East, that compete with Chinese players in the same value chains.
Chemical players in Europe have actively cut back capacity in a wave of divestments and closures driven by persistent overcapacity, high energy costs, and weak demand. In the past couple of years, companies have earmarked over 11 million metric tons of capacity, involving 21 major European production sites, for closure. These developments render the negative impact of overcapacity on chemical industry margins more visible than before.
In addition, a dramatic fall in the price of oil—from nearly $120 per barrel of Brent crude in mid-2022 to $70 to $80 at the end of 2024—intensified margin pressures for producers of key petrochemical categories, including polyethylene, polypropylene, and polyethylene terephthalate. (Typically, the combination of falling oil prices and increasing overcapacity—which occurred in both 2023 and 2024—results in a lower absolute margin contribution for petrochemical producers.)
In some leading Western markets, most notably Germany, deteriorating profit margins almost entirely wiped out the positive TSR impact of revenue growth. Declining margins also had a negative effect on valuation multiples in many markets, as investors adjusted their expectations for future profitability. In this challenging environment, shareholder returns depended on companies’ cash flow actions, such as dividend payouts and share buybacks, highlighting their critical importance in maintaining investor interest during periods of soft demand and weak margins.
Not all regions experienced downward pressure on valuation multiples. Middle East chemical companies saw their multiples rise by 5 percentage points on average—a sign of investor confidence in the region despite structural headwinds. Even so, five-year annual TSR in the Middle East fell by 2 percentage points due to weak demand and chronic overcapacity, particularly in base chemicals. In India, average multiples rose by 15 percentage points from 2020 to 2024 relative to the period from 2019 to 2023—a record increase for the chemical companies we monitor—hitting 28%. But these gains were the exceptions, as multiples declined in most markets. For example, multiples decreased by 3 percentage points in Germany, by 4 percentage points in France/Benelux, and by 5 percentage points in the UK.
Stay ahead with BCG insights on industrial goods
A Performance Gap Opens Up Among Electronic Chemical Players
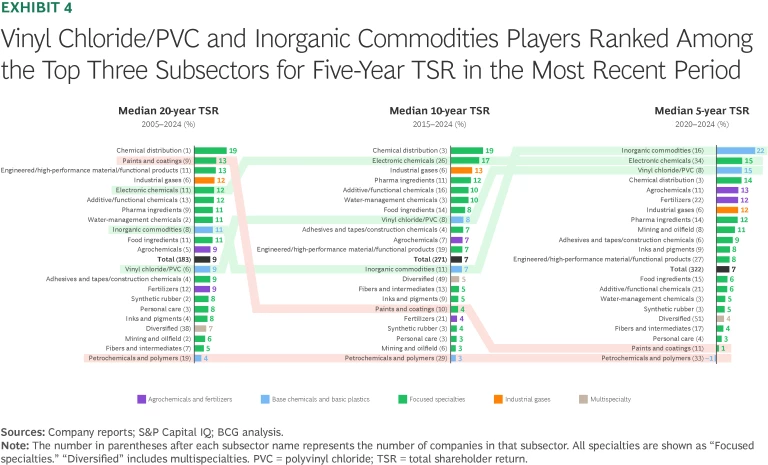
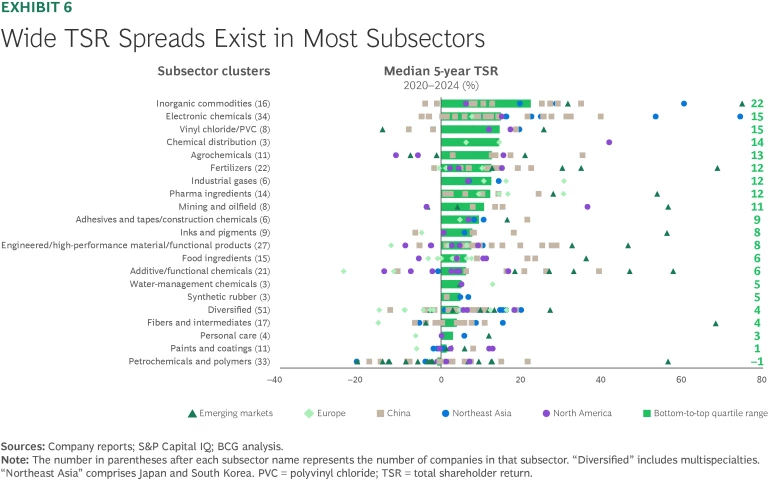
Examining the TSR performance of different industry subsectors over different periods reveals clear patterns and shifts. Because of the sustained challenges they face, petrochemicals and polymers sit at the bottom of the rankings over 5-, 10-, and 20-year time frames. By contrast, electronic chemicals have consistently ranked very high on our short- and long-term TSR rankings, thanks to technological advances and continued robust demand. (See Exhibit 4.)
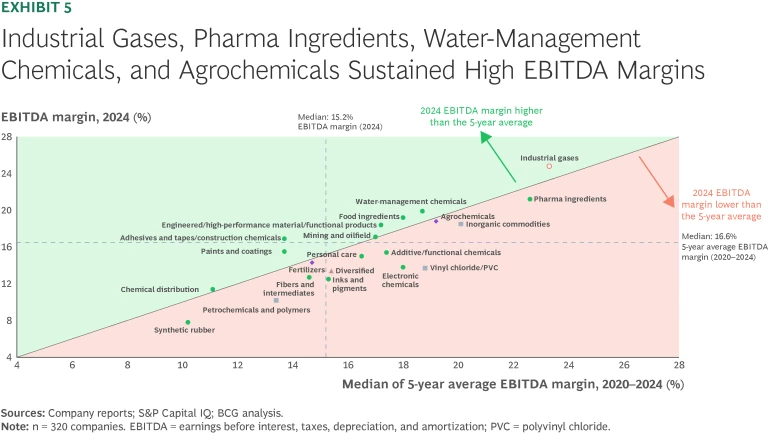
Despite their strong showing, electronic chemical companies have experienced downward pressure on their EBITDA margins recently, however. For the five years to the end of 2024, average annual margins were 18%, but they fell to 14% during 2024 itself. This is likely due to a widening performance gap between electronic chemicals used in rapidly growing industries (such as AI and advanced semiconductors) and those deployed in industries that are growing less strongly (for instance, batteries for electric vehicles). Five-year TSR was 16% for the former and 11% for the latter—and 15% for the group as a whole—but 2024 EBITDA margins were 18% and 5%, respectively.
Other leading chemical subsectors, such as makers of vinyl chloride and PVC, have managed to deliver strong average annual TSR from 2020 to 2024 even though their margins declined in 2024. (See Exhibit 5.) But while many of these subsectors experienced declining margins, they benefited from valuation multiples in 2024 that were higher than their average annual five-year multiples.
Evolving demand drivers have also shaped the value creation performance of other subsectors. Paints and coatings—a relatively traditional chemicals subsector—has moved from being a TSR leader over a 20-year time frame to being a laggard during the past five years as a result of higher input costs and weaker end-market demand. By contrast, inorganic commodities have risen from being mid-tier TSR performers over 10- and 20-year time frames to taking the pole position over the 5-year period to 2024. This subsector has not suffered from the same overcapacity as petrochemicals and polymers, and most companies in the subsector are based in China and Japan, both of which have performed well at a regional level. In addition, half of the companies in the inorganic commodities subsector are active in caustic soda and soda ash, which have benefited from steep price increases.
Our analysis confirms that chemical industry subsectors faced severe disruptions during the COVID-19 pandemic but recovered unevenly afterward. Automotive production experienced a deep pandemic-induced contraction in demand followed by a strong rebound. But this turned negative again by mid-2023. By contrast, pharmaceuticals displayed a more consistent pattern, driven by innovation and aging populations. These dynamics have a huge impact on chemical manufacturers’ performance, and require careful adjustments to planning, feedstock, and strategic priorities. Even among subsectors that delivered above-average TSR over 5-year and 10-year time frames, performance varied widely. This suggests that strategic direction, innovation, and business model were more important to individual performance than membership in a particular subsector. (See Exhibit 6.)
While European Petrochemicals Struggle, Middle East Players Bet on a Brighter Future
The European petrochemicals subsector, in particular, faces severe structural pressures. These include overcapacity, weak demand, high energy and labor costs, regulatory-driven costs, and feedstock disadvantages (compared with the US or Middle East, which benefit from access to cheap oil). As a result of these forces, most global players are actively shrinking their petrochemical businesses in the region by shuttering or selling assets. Because of the oversupply of uncompetitive assets, many sellers need to offer financial incentives to attract buyers.
In one prominent recent case, an asset seller incurred significant losses after transferring working capital and cash incentives to secure a buyer, and the acquirer committed only minimal financial resources. Despite the immediate financial hit, transferring asset ownership under such challenging terms may be preferable to permanently shutting down a plant, as it limits any ongoing financial exposure. Still, such transactions depress valuations. In the current environment, many European petrochemical assets may currently have a negative value. Industry observers are watching closely to see whether other similarly challenged assets can attract buyers’ interest, given the depressed state of the market.
By contrast, in the Middle East, state-owned investors are placing bets that the future for petrochemicals players will be brighter. Despite weak margins and overcapacity, local players have announced several world-leading projects in the Middle East in recent months. Governments in the region anticipate strong demand growth in petrochemicals beyond 2030, when they expect the cycle to have turned.
Global demand for ethylene—a vital building block in plastics and many industrial chemicals—is projected to keep growing, driven by Asian markets. By the 2030s, weak ethylene EBITDA margins and low plant utilization rates (due to unparalleled expansions in capacity) should rebound as demand growth finally starts to outpace capacity additions. Meanwhile, regions such as the US and the Middle East—which have access to low-cost ethane feedstock because of their abundant natural gas reserves—will remain competitive, despite these market dynamics.
How Chemical Companies Can Chart a Course in a Turbulent World
Since the start of 2025, demand in much of the chemical industry has continued to be subdued; plant closures in regions such as Europe are increasing; and, as tariffs reshape global trade, planning has become much more difficult. Despite these challenges, we believe players can take multiple steps to position themselves for success in today’s difficult environment:
- Reposition your asset footprint. Companies—especially those in asset-intensive areas of the chemical industry such as commodity and some specialty chemical producers—should reassess their global asset network to enhance flexibility and resilience. When making asset decisions, they should balance proximity to demand centers against other factors, including the age of existing plants, local regulatory requirements, and cost advantages such as low-cost energy.
- Tighten capital discipline. Companies should actively manage their portfolios while using capital wisely. They can do this by focusing investment on assets with a high return on capital employed, proactively divesting underperforming assets, and avoiding unnecessary forays into commodity-heavy sectors.
- Boost operational efficiencies. By harnessing AI-powered digital technologies, companies can lower operating costs, increase throughput in their factories, improve operating performance, and enhance health and safety aspects of their working environment.
- Double down on innovation and differentiation. Chemical companies that adopt clear, technology-oriented and innovation-driven business strategies consistently rank as strong performers in our TSR rankings. Other players should take a leaf out of their book and implement strategies that rely on similar business models.
- Enhance commercial excellence. Companies should pursue strategic initiatives that enhance their commercial excellence and strengthen their market positioning, particularly in structurally challenged, price-pressured regions and sectors. As a core growth lever, commercial excellence involves using data-driven segmentation and predictive analytics to target high-value customers, embedding AI and GenAI to boost productivity, and optimizing go-to-market models and spending. In addition, companies should treat pricing as a tool to achieve competitive advantage by aligning their capabilities to market dynamics, leveraging proprietary data, and building in-house pricing engines tied to strategic goals.
The soft expectations of the chemical industry that prevailed at the end of 2023 have given way to a general sense of crisis. A widely anticipated demand recovery in key industries, including automotive and construction, has failed to materialize. More broadly, bullish industry players, particularly in Asia, continue to add capacity in expectation of a pickup in demand, leading to historically low utilization rates and sustained price pressures. And in Europe, chemical companies remain under pressure from high energy costs and regulation.
Beyond the immediate scope of this report, ongoing announcements of tariffs and substantial shifts in exchange rates are further weighing down already subdued industry sentiment. These dynamics are likely to delay the recovery of customer industries even more and are directly impacting the chemical industry worldwide.
The first raft of industry responses is already underway. These are most visible in Europe, in the form of asset sales, plant closures, and takeovers. An additional shakeout is necessary. But this will require more disciplined portfolio, ownership, and asset management strategies, together with a focus on innovation- and sustainability-based differentiation—especially among players that cannot compete on cost. Nevertheless, these steps are essential if the chemical industry is to regain its past robust levels of TSR performance.
The authors acknowledge the contributions of their BCG colleagues Kanishka Agarwal, Jooyoung Ahn, Robert Blaudeck, Prakash Chandrasekar, Christoph Franck, Jan Friese, Abhrajit Guria, Ryan Jones, Livia Lin, Martin Link, Tobias Mahnke, Julia Meisel, Eduard Pujol, Arun Rajamani, Katarzyna Raszka, Adam Rothman, Priyanka Singh, Siqi Tang, Yaroslav Verkh, and Han Zhou. They also acknowledge the contribution made by BCG’s ValueScience Center.

