
From technology and pharmaceuticals to food and beverage, the B2B distribution sector could hardly be more diverse. Despite that heterogeneity, the one thing leaders have in common is a knack for value creation.
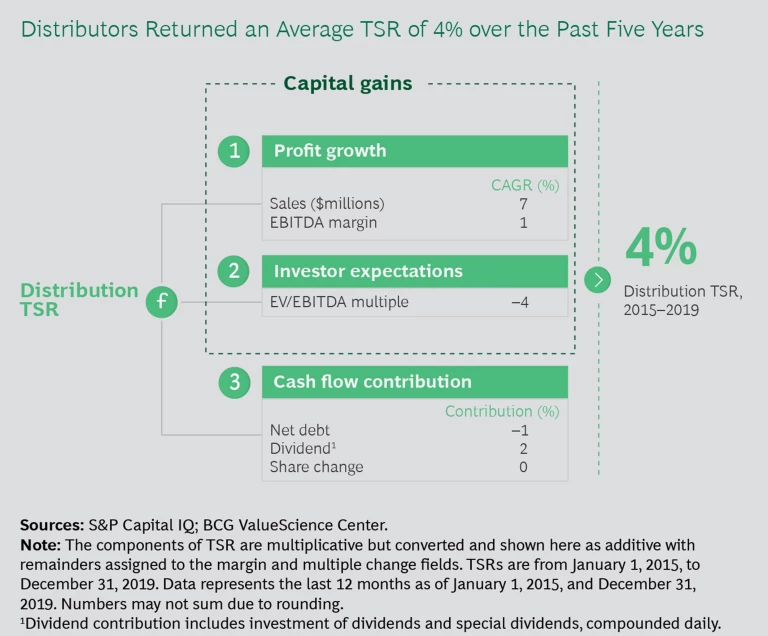
Data shows that, from the start of 2015 to the end of 2019, the TSR for B2B industrial distributors hovered at a median 4% per year, far below that of most other industries. But top-quartile distributors delivered returns that were nearly five times higher, at 18% annually over the same period.
The one thing that leaders in the B2B distribution sector have in common is a knack for value creation.
What did these players do that others didn’t? The answer is that they built scale and density to create advantage, then pressed that advantage through value-creating growth, reinvestment, and rigorous cash-flow management.
The good news is that their playbook can be replicated. Success requires discipline and a long-term mindset, characteristics that periods of turbulence put to the test but that evidence shows lead to resilience, renewal, and superior returns.
An Overview of Returns
Globally, distributors delivered stable but tepid TSR performance over the past five years, with returns in the low single digits. Consolidation is one factor dragging down growth. Megamergers in major end markets like pharmaceuticals have cut the total number of suppliers and shrunk the volume of supply chain and procurement organizations working with distributors. E-commerce is another factor. Not only are digital pure-play companies entering the distribution market, but several larger parts suppliers have begun selling directly to customers over digital channels, cutting out B2B distributors. With competition and disintermediation growing, distributors have faced pricing challenges, resulting in downward pressure on margins.
But a subset of companies found ways to boost TSR by double digits despite these challenges. Top-quartile distributors delivered median returns of 18% from 2015 to 2019—nearly five times higher than the average player. (See Exhibit 1.)
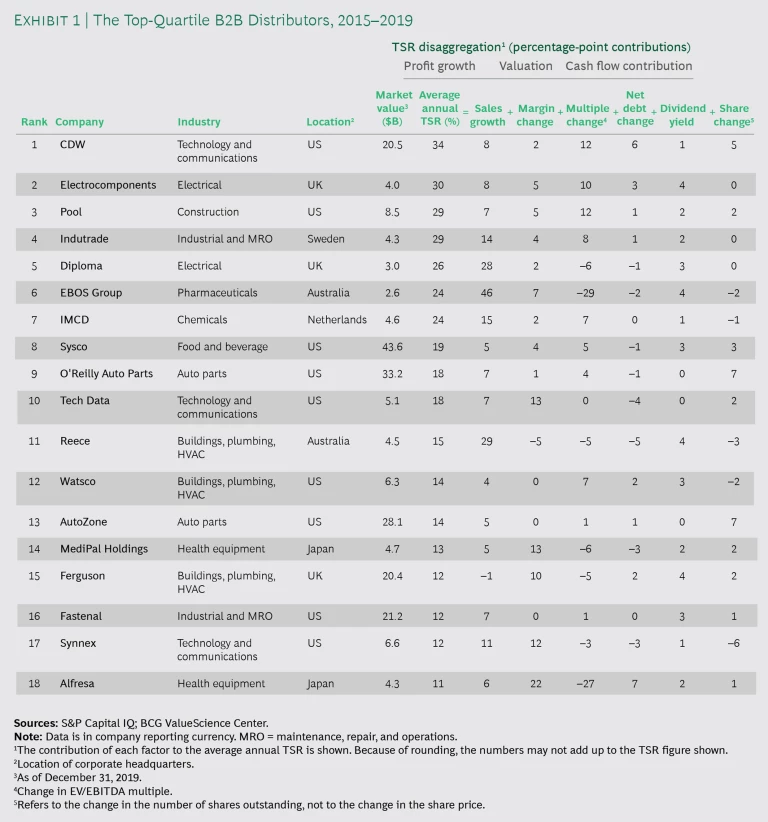
The 18 companies in this set outperformed in many ways. They translated sales into profit, with EBITDA margin growth contributing a median of 3.9% per year to TSR from 2015 to 2019 compared with –1.8% for the other companies in our sample. The leaders also returned more cash to shareholders in the form of dividends and share buybacks, contributing 3% to TSR compared with 1.7% for the rest of the sample. In addition, top-quartile players managed debt more effectively, resulting in a flat contribution to TSR rather than a median –1.4% for others in the set. Margin growth drove healthy multiple expansion, with top-quartile companies gaining a 6-percentage-point boost in multiples over their peers (1.9 compared with –3.8).
Pandemic-related dislocations could alter the landscape, but the effects will be uneven, with a distributor’s fate tied to the end market in which it plays. Restaurant suppliers have been hard hit, for example, while medical distributors can barely keep up with demand. The crisis has also materially impacted the mix of goods that customers are buying, leading to higher volumes in lower-margin categories in some cases.
The pandemic has materially impacted the mix of goods that customers are buying, leading to higher volumes in lower-margin categories in some cases.
Like most businesses, distributors have had to make operational adjustments. Most did so relatively quickly, aided by the fact that the physical layout of many distribution centers—large and well ventilated—makes it easier for employees to maintain social distancing. In addition, recurring orders helped mitigate revenue impacts for many during the early stages of the crisis. But to succeed in the months ahead, distributors will need to adapt sales processes, augment inventory management, and embrace digital self-service .
Our Industrial Distributors Value Creators 2021 report is based on a set of 70 companies. We filtered this set from a global list of 265 public companies on the basis of four factors. Participants had to focus primarily on B2B distribution, have a market capitalization of more than $1 billion, be publicly traded, and have a free float greater than 20%. After establishing the sample, we measured the companies’ TSR. (See “The Components of TSR.”) The set covers ten end markets and has a total market capitalization of $500 billion. It also spans regions—with 37 companies headquartered in North America, 17 in Asia-Pacific, and 15 in Europe.
The Components of TSR
The Selection Versus Velocity Advantage
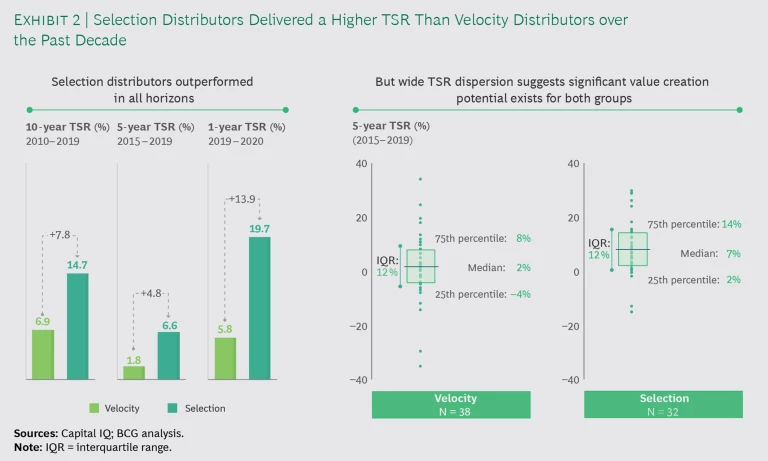
In examining the 70 companies in our value creators list, we noted two types of distributors, whose returns and competitive profiles differ significantly. Distributor end markets vary widely, but for all that diversity, our analysis finds that business models fall into two main groups—distributors whose business model is based on service and selection and those whose model is based on turnover and velocity.
We call the first group “selection distributors.” These companies carry a wide array of inventory and don’t move it very fast (about six or fewer inventory turns per year). That may not seem like a recipe for success, but the items they stock tend to be specialized and hard to find, resulting in high margins. Think plumbing supplies and auto parts. These players typically enjoy gross margins of 20% or more.
We call the second group “velocity distributors,” and their model is the opposite. Minimizing delivery cost is the name of the game for these players, and their inventory tends to move more than six times per year. Their gross margins are also lower, generally coming in below 20%. Companies such as food service and technology distribution often fall into this category. These distributors tend to have valuable or perishable inventory, as well as a smaller and less diverse base of suppliers and customers.
Both business models generate shareholder value, but over the past decade, selection distributors have generated more of it—and have done so more consistently. (See Exhibit 2.)
Greater purchasing power and pricing flexibility are the two main reasons. The leading selection distributors derive revenue and supplies from a broader base, giving them more negotiating leverage. For example, at Fastenal, a top-quartile value creator, no customer or supplier accounts for more than 5% of business. At many velocity distributors, by contrast, a small number of customers can account for a disproportionate percentage of revenue, in some cases as much as 50% or more of sales. Most major pharmaceutical distributors have this structure, for example, with the largest customers responsible for roughly 20% of revenue. Likewise, a narrow set of suppliers may dominate the market for a key material, limiting the distributor’s pricing flexibility.
The customer value proposition also differs. Selection distributors compete primarily on availability and convenience, sparing customers the hassle of sourcing inexpensive and hard-to-find items from far-flung locations. That type of value is challenging to replicate, giving selection distributors customer and competitive advantage. While availability is critical for all distributors, velocity distributors compete more on efficiency and quality, providing customers with ready access to higher-value goods and less expensive delivery. Selection players have more cushion to let inventory sit, but velocity distributors need to keep it turning. For example, selection distributors may stock a small number of items that move only once a year.
But it would be wrong to dismiss velocity players as underperformers. CDW, a velocity distributor and provider of tech products, claimed the number one spot on our value creators list, delivering an impressive 34% TSR over the past five years—4 percentage points more than the nearest selection distributor. In addition, seven velocity distributors sit in our top quartile, nearly 40% of the total. Notably, across the sample, selection and velocity distributors have the same 12-percentage-point spread between the top and bottom TSR value creators in their respective categories—meaning that they create or lose value as a result of their business practices more than their business model.
A Disciplined Approach to Reinvestment and Capital Allocation
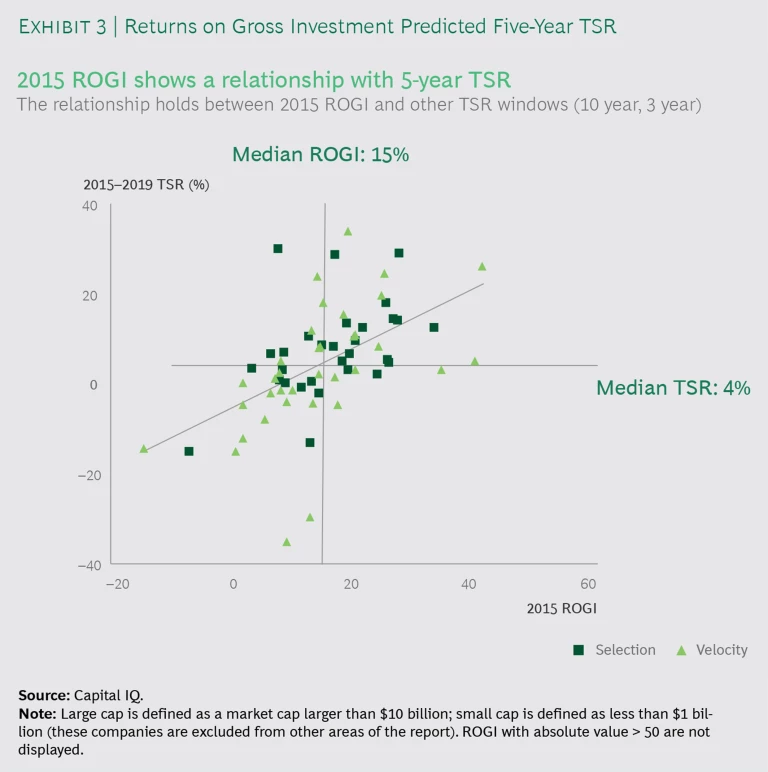
The selection and velocity leaders that rose to the top of the pack are far more likely than underperforming peers to reinvest resources into their business. And they are equally disciplined about returning cash to shareholders. That combination allows them to build sustainable competitive advantage and generate high returns on gross investment (ROGI).
The UK firm Electrocomponents, for example, annually reinvests about 4% of its excess returns back into the business in order to fund strategic growth, focusing especially on digital initiatives in areas such as marketing, brand building, mobile and web enhancements, and customer experience programs. The company has also expanded its product offerings, launching new assortments that include Internet of Things products, which are expected to see strong demand in the years ahead. To support this growth, Electrocomponents doubled its distribution center capacity and funded improvements to enhance visibility across the supply chain. Collectively, these investments helped lift TSR to 30% annually from 2015 to 2019 through greater sales growth, margins, and multiples.
After making the right competitive investments, value creators return cash to shareholders. For example, discipline in managing cash flow helped CDW claim the top spot on our 2020 value creators list. Each year, the company determines the capital needed to support its strategic ambition and sets aside funds for growth initiatives. It then gives the remaining cash to shareholders in the form of buybacks and debt service. The pattern of returning cash to shareholders drove 13 percentage points of the company’s total 34% TSR over the past five years, a level large enough to place CDW in the top quartile for value creation on the basis of its cash returns alone.
Our data reveals a correlation between ROGI and subsequent TSR growth during the time period—for both selection and velocity players. (See Exhibit 3.) Distributors with an above-average ROGI in 2015 outperformed the field in overall shareholder returns in the five years that followed. This pattern is noteworthy because companies generally revert to the mean, and it underscores the importance of continued reinvestment and smart capital allocation. These actions allow companies to build advantage. Then they can turn that advantage into strong ROGI and, ultimately, into strong TSR growth.
Maslow’s Hierarchy of Distributor Needs
How do distributors create that advantage? Instead of doing everything at once, top B2B distributors do the right things in the right order, sequencing their investments in a way that creates and cements clear sources of advantage before expanding in a measured way. That hierarchy has four ways to drive value. (See Exhibit 4.)
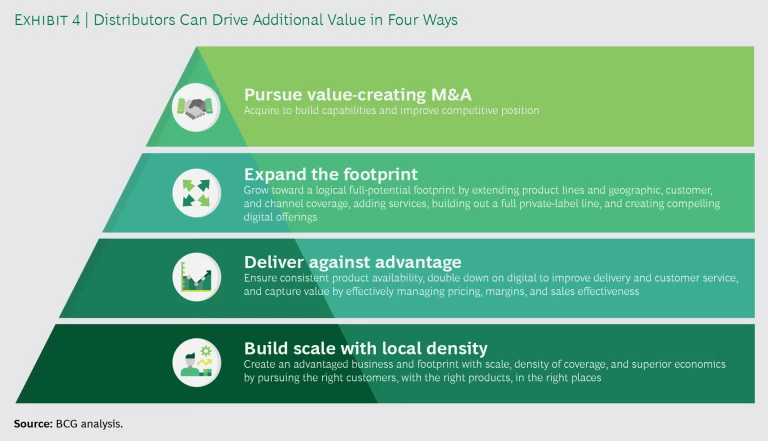
Build scale with local density. The distribution business is a local scale business, and that local market power translates to larger economies of scale over time. To build these economies—and hold onto them—B2B distributors should focus investments within their core geographic areas first, where possible. Density creates financial muscle, allowing businesses to capture more favorable drop economics, such as through route clustering, then expand later from a position of strength.
The construction company Pool, for example, formed within the residential-pool niche, with a goal of establishing itself as a market leader in its primary geographic area. When the company was ready to expand, it followed the same principle, focusing on close adjacencies such as landscaping and commercial pools, building strength, and then moving to additional adjacencies from there. The density—both in coverage and in experience—created an advantaged business with superior economics. Recurring revenue is now 60% of all sales, which improves the quality of earnings. The company’s deep market saturation also reduces its recession exposure.
Deliver against advantage. After securing advantage in the form of established customer and vendor relationships and local branding presence, leaders should turn their investment focus to refining execution. At a minimum, this should include optimizing the distribution network and fine-tuning logistics to ensure strong product availability and delivery. But leaders will take things further. In the post-COVID-19 environment, the best-performing players won’t just be logistics leaders—they will be data leaders. Investing in analytics and digital enablers can help distributors professionalize their sales function, providing reps with next-best-offer engines and churn management solutions so that sales can engage earlier, as well as more efficiently and effectively, with customers.
B2B distributors need to place the same emphasis on improving their pricing practices. Here, too, digital investments can help. Digital dashboards improve visibility and oversight, making it easier for executives to track key performance metrics, such as inventory turns, stocking ratios, and order fulfillment. Tech Data, for example, is one of the world’s largest technology distributors; its investments in digital tools and practices helped improve its pricing by 130 basis points and its margins by 100 basis points from 2015 to 2019.
Expand the footprint. With the fundamentals firmly established, distributors are ready to grow toward their full potential by extending their product and service lines, expanding their geographic footprint and customer base, and broadening their channel coverage.
Fastenal, for example, has pursued a repeatable organic-growth strategy over a multiyear horizon. What began as a fastener business has now evolved into a much larger portfolio of products and services focused on the construction and industrial markets. Management has a specific playbook it uses to open new branches—allowing it to approach growth systematically and incorporate new learning over time. During the past five years, the company has boosted the number of locations by 2% annually, helping increase revenue by a CAGR of 7%.
Pursue value-creating M&A. Strategic acquisitions can be a major growth driver—helping distributors that have established a strong business and financial foundation to achieve scale rapidly. Our client experience shows that companies that create value in M&A tend to follow lessons from serial acquirers. Focus is key. The best players have a clear, repeatable investment thesis—then continually execute against it. (See “Private Equity Is Helping Fuel M&A Activity Within the Sector.”)
Private Equity Is Helping Fuel M&A Activity Within the Sector
Private equity is becoming more of a player in the space, attracted by the asset-light nature of distribution businesses and the opportunity to roll up subscale players into regional or national players. The number of private equity acquisitions of distribution businesses rose by a CAGR of 14% from 2015 to 2019, compared with 4% for all other buyouts. Industrial distributors that have a selection business model have been a main focus; distributors with private equity backing are far less common in the health care and consumer industries.
Looking ahead, prolific acquirers are well positioned to increase their holdings through private equity support. Audax Private Equity, known for its buy-and-build approach, has been active in the distribution space. Since 2016, it has developed two of its major holdings, RelaDyne and Imperial Dade, into large players, sponsoring 28 acquisitions for RelaDyne and 16 for Imperial Dade. RelaDyne’s acquisitions helped deepen its footprint in the South and Southwest, moves that drove revenue from $800 million in 2016 to more than $2 billion in 2018. Imperial Dade pursued a similar strategy down the East Coast, starting with several acquisitions in the New York tri-state area and New England, then merging with Dade Paper in the Southeast and continuing to enlarge its footprint through additional acquisitions. Audax sold Imperial Dade to Bain Capital in 2019.
Sysco, for example, annually allocates 0.5% to 1% of sales to M&A and has pursued 19 transactions over the past five years. Most acquisitions have built upon the company’s core strengths, either expanding within existing markets (enhancing its local density) or into immediate adjacencies. The acquisition strategy has been a key factor in propelling Sysco’s 19% annual TSR from 2015 to 2019.
Planning for 2021
The postpandemic period could be a time of substantial value creation. But persistent volatility is also likely. As leaders look ahead to the next 12 months and beyond, three key enablers can help them generate the insights and business stability needed to put the playbook presented here into action:
- Enable data-driven decision making. Pulling together sales, warehouse, and delivery costs into a central data control tower can provide distributors with critical real-time information on the cost to serve by region, account, location, order, and line item. This transparency makes it easier to respond nimbly to large and unexpected shifts in customer behaviors and buying patterns.
- Augment inventory management systems. Given the potential for continued supply and demand dislocations, traditional inventory management analytics won’t work, because most don’t gather enough of the right sorts of data to account for the prospect of large-scale shutdowns and changes to demand patterns. Digital systems that enable more robust data gathering and analytics can ensure that distributors have the right products when customers need them, without building excess inventory and incurring unnecessary financial risk.
- Double down on next-gen sales. In light of increased competition and pandemic-induced distributions, implementing digital self-service and e-commerce sales capabilities will be essential. Once in place, digital self-service is often cheaper and easier to scale than many traditional sales methods. It also allows a distributor to allocate its sales force more effectively, enabling customers to research products, place orders, view status, and manage their account at any time while the company preserves seller face time for more complex customer needs.
By taking a disciplined approach to investment and approaching growth in a measured way, B2B distributors have the potential to open up significant opportunities for value creation, building profitable enterprises and rewarding shareholders for years to come.
The authors appreciate the contributions of Glen Gubbay, Justin Jones, Mariana Linhares, Jack McCarter, Lauren McGraw, Pat O’Brien, Wei Ong, Ross Putterman, and Nissim Ray. In addition, they are grateful to Mary Leonard and Kelly Rogers for marketing support and Marie Glenn for writing assistance. They thank Katherine Andrews, Siobhan Donovan, Kim Friedman, Abby Garland, and Shannon Nardi for editorial and design support.