
Multiple disruptive forces—the rapid pace of technological change and its potential contribution to inequality chief among them—pose critical challenges to governments around the world. It is more important than ever for governments to develop and implement strategies that take that disruption into account and aim to improve the lives of citizens.
Boston Consulting Group’s Sustainable Economic Development Assessment (SEDA) can be a powerful tool in this effort. BCG created SEDA in 2012 to track the relative well-being of a country’s citizens and to provide insight into how well a country converts its wealth into well-being. (See “A Yardstick for Well-Being.”) The development of SEDA was a response to the growing consensus that gross domestic product (GDP) is a limited metric for assessing a country’s performance; the tool built on the work of prominent economists and international organizations to broaden the lens beyond economic indicators.
A YARDSTICK FOR WELL-BEING
A YARDSTICK FOR WELL-BEING
SEDA’s design was inspired by the work of economists, such as Nobel Laureates Amartya Sen, Michael Spence, and Joseph Stiglitz, who argue that in order to provide a strong incentive for placing well-being at the center of policies and public investment priorities, we need a way to measure and—importantly—track progress over time in well-being. Our efforts have been further reinforced by the November 2018 OECD reports on the measurement of economic performance and social progress, which provided guidance on measuring people’s well-being and societies’ progress.
SEDA combines objective, factual data on outcomes, such as in health and education, with quasi-objective data, such as governance assessments. It is a relative measure, assessing how countries perform relative to the rest of the world or to individual peers or groups of countries.
SEDA defines well-being on the basis of ten dimensions that fall into three categories. (See the exhibit.)
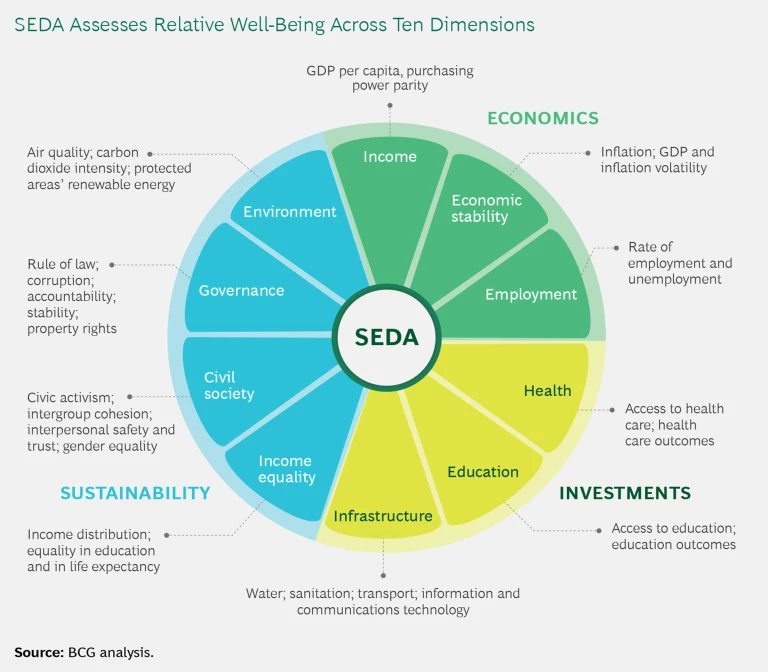
- Economics looks at income levels, stability, and employment.
- Investments focus on the key public investment areas of education, health, and infrastructure.
- Sustainability considers social aspects (equality, governance, and civil society) and the environment.
Using indicators from publicly available sources, we assess country performance for each dimension. The assessment relies on a total of 40 indicators based on the most recently available data. (For our 2019 analysis, this is generally 2017 data—it is worth noting that very recent developments will not be reflected in the analysis.) Each indicator’s measure is normalized on a scale of 0 (the lowest score) to 100 (the highest). Based on those normalized indicators, a score is calculated for each of the ten dimensions. We can use these scores to look at well-being in three ways:
- SEDA Score. We aggregate the scores for the ten SEDA dimensions to provide an overall score for each country. This score can be used to compare a country with any other country or group of countries. In general, wealthier countries tend to have higher scores than less wealthy countries. The ten dimensions are not only the building blocks for SEDA scores but also provide insight on a country’s strengths and weaknesses. Dimension scores (on a 0-100 scale) can be used to benchmark individual countries against the rest of the world or against relevant peer countries—individually or in groups.
- Change in SEDA Score. With 12 years of data, we are able to track not only the change in SEDA score from 2008 to 2019 (based generally on data from 2006 through 2017), but also changes in each dimension of the SEDA score.
- Wealth-to-Well-Being Coefficient. On the basis of SEDA scores, we can examine how effectively countries are able to convert their wealth (as reflected in income per capita) into well-being. We do this by using a measure called the wealth-to-well-being coefficient. This coefficient compares a country’s SEDA score with the score that would be expected given the country’s GNI (gross national income) per capita. The coefficient thus provides a relative indicator of how well a country has converted its wealth into the well-being of its population. Countries with a coefficient of 1.0 are generating well-being in line with what would be expected given their income levels. Countries that have a coefficient greater than 1.0 deliver higher levels of wellbeing than would be expected given their GNI levels, while those below 1.0 deliver lower levels of well-being than would be expected.
The current SEDA database covers 143 countries, which represent 97% of the world’s population and 98% of the global economy. While the analyses and charts cover all 143 countries, we place special focus (through chart labels and specific text references) on what we call the global powerhouses. These are countries that constitute the 25 largest economies and the 25 most populous countries. Because 15 countries fall in both categories, the result is a list of 36 global powerhouses. (See the Appendix exhibit for details on this group of countries.)
SEDA provides valuable insight, but it can also help governments move from insight to action in two critical ways:
- First, SEDA is not only a powerful metric on its own but also can be a key component of a high-level dashboard. We believe governments should develop a performance dashboard that offers a three-pronged view comprising GDP, the objective measure of well-being offered by SEDA, and subjective measures of well-being available through happiness metrics. This sort of dashboard can provide timely and multifaceted information about how governments are faring in terms of sustainable development—and flag the need for course corrections.
- Second, SEDA can be used to identify countries that outperform relative to peers or the rest of the world in certain dimensions, thus revealing best practices and lessons that can guide policies and programs in other countries.
In addition to discussing these important uses of SEDA, this report presents the SEDA results for the 143 countries in our 2019 data set. With 12 years of data, we can see how some countries, including China, Rwanda, and Vietnam, have enjoyed a meaningful improvement in relative well-being, while others, such as Greece, Egypt, and Mozambique, have lost ground. (For a full view of SEDA results, see the Appendix and the SEDA interactive.)
Understanding the progress countries make over time, both overall and at the level of specific dimensions, is critical to setting more-effective national priorities and strategies.
Driving Action
It is one thing to understand where a country’s challenges lie—it is another to address them. To this end, governments should take a comprehensive view of performance, one that looks at metrics such as well-being and happiness, and they should identify countries that can serve as role models in key areas.
Designing a Government Dashboard
Many successful companies are shifting their focus from products to the experiences of end users. Governments need to make a similar change—moving from a heavy reliance on GDP as a barometer of national performance to a broader view that captures the full experience of citizens. There is evidence that such a shift is under way. The most recent move: the announcement by the New Zealand government of its “well-being budget.” Under this process, the setting of all budget priorities will be informed by economic issues but will be driven primarily by the well-being of the population, including in areas such as mental health and the transition to a sustainable and low-emissions economy.
A national performance dashboard can help support governments in taking this more holistic view. Such dashboards can be an integral part of strategy implementation and an important source of signals to confirm strategic direction or to flag the need for change.
A high-level performance dashboard should capture economic performance, objective well-being, and subjective well-being—three lenses that offer distinct, complementary perspectives on national progress.
A performance dashboard can help governments take a more holistic view of progress.
- Income Generation Lens. Economic value creation is central to progress—after all, an expanding economy is a powerful lever for improving the welfare of many segments of society. Income growth has proven useful as an accounting framework for economic activity and has the advantage of being well established and understood. Consequently, an income growth measure—real per-capita GDP growth—should be included as a view of national performance
- Objective Well-Being Lens. SEDA, and in particular its wealth-to-well-being coefficient, provides insight on how well countries convert wealth into well-being.
- Subjective Well-Being Lens. The UN-sponsored World Happiness Report provides country averages on individuals’ perceptions of their experiences related to well-being.
Each lens offers considerable potential for segmentation, which enables deep dives in areas of interest. But there is merit in using all three at a high level to create a cohesive and comprehensive view of national performance that can capture the attention of policymakers and the public.
To see how these measures complement one another, it helps to look at how their divergence can illuminate challenges and areas that require additional attention.
The Relationship Between Income and Objective Well-Being Measures. It is no surprise that there is a positive relationship between wealth, as reflected in per-capita income levels, and SEDA scores. After all, income affects well-being in many ways. But it is clear that well-being is not simply a function of income. After all, we see many countries at similar income levels that have quite different well-being levels. (See Exhibit 1.) Poland and Argentina, for example, have similar income levels, but Poland’s well-being score is much higher.
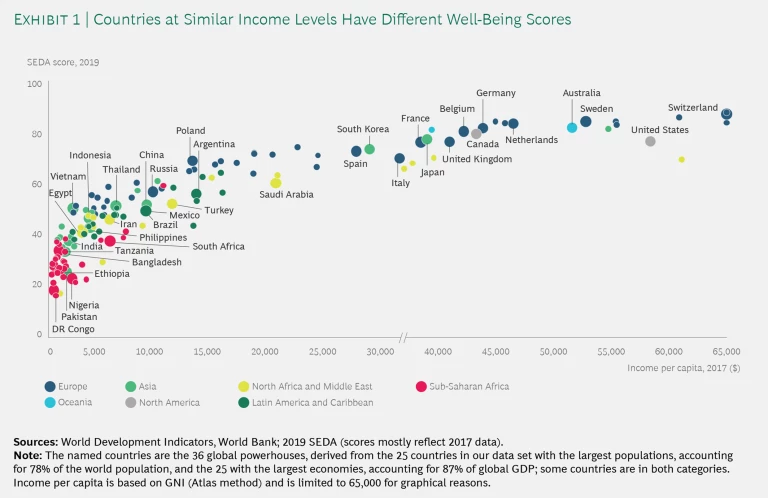
We also see countries with higher income levels that lag behind in well-being compared with lower-income countries. The US, for example, has a higher per-capita income than the Netherlands but a significantly lower SEDA score. South Africa has a higher income level than Indonesia but a much lower well-being score.
This underscores that there are factors beyond economics that affect well-being—factors that manifest themselves in the varying levels of performance in converting wealth into well-being.
The Relationship Between Objective and Subjective Well-Being Measures. Contrary to what one might expect, subjective measures like scores from the World Happiness Report and objective SEDA measures are not always aligned. Countries can have relatively high well-being scores, for example, but relatively low happiness levels. In fact, a regression analysis shows that countries with higher well-being scores are more likely to have lower-than-expected happiness levels than countries with low well-being scores.
In some cases, the discrepancy between well-being and happiness seems to follow a regional pattern—while in other cases the differences are country specific.
A difference between well-being and happiness measures can be a warning sign.
While a number of factors may account for the divergence, our work highlights one possible significant driver: social inequality. Individuals in countries with relatively high levels of social inequality tend to report low levels of happiness. (See “The Impact of Social Inequality.”)
THE IMPACT OF SOCIAL INEQUALITY
THE IMPACT OF SOCIAL INEQUALITY
There is much concern and debate about income inequality—rightfully so. But social inequality—which we assess by looking at inequality in health outcomes and access to education—gets less attention. The problem: our research finds that social inequality is a more significant success factor for well-being than income inequality.
Income inequality has increased in most countries as higher-income segments of the population benefit disproportionately from economic growth. Our previous work has shown, not surprisingly, that income inequality is negatively correlated with well-being. In addition, income inequality is significantly correlated with the gap between subjective measures (happiness) and objective measures (SEDA). In other words, countries with higher levels of income inequality tend to have lower levels of happiness than one would expect given their overall level of well-being.
But income inequality hardly tells the full story. Just as we have argued that GDP alone does not fully reflect country performance, we also believe income equality alone does not adequately capture overall inequality in a society. As a result, starting in 2018 we expanded SEDA’s equality measure by adding a social equality measure to our income inequality measure (which is based on Gini coefficients).* The social equality measure is based on a simple average of health and education inequality measures.
Looking at country positions on income and social inequality measures, we find significant differences:
Among our global powerhouse countries, for instance, some, such as the Netherlands and Sweden, have comparably low levels of both social and income inequality. At the other end of the spectrum are countries like Nigeria and the Democratic Republic of the Congo, which have very high inequality in both areas.
In between, we find countries with high income inequality and lower social inequality, such as China, Argentina, and the US; and countries with high levels of income inequality and even higher social inequality, including India, Bangladesh, and Pakistan (although it is quite likely that available statistics underestimate income inequality in these three countries).
How does inequality affect well-being? We can begin to answer that question by sorting countries according to their quartile position in terms of SEDA scores—and then examining how they perform in both income and social inequality. (See the exhibit below.)
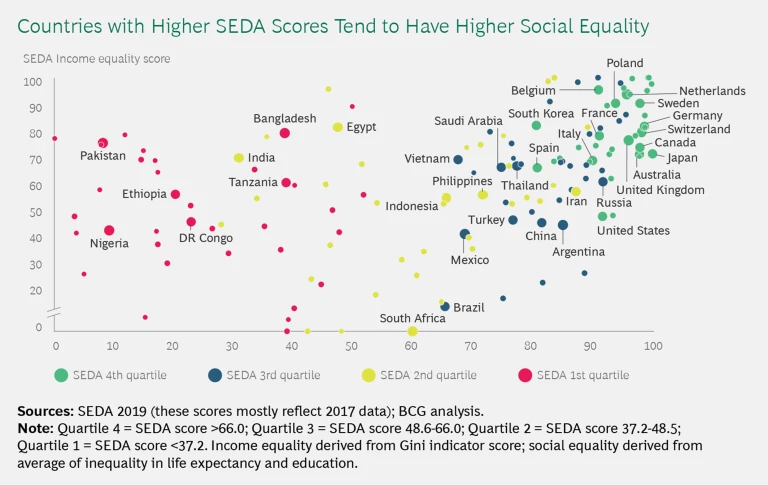
Looking at the social equality axis, we see that countries with the best SEDA scores tend to have higher social equality scores, and those with lower SEDA scores tend to have lower social equality scores. This highlights a strong correlation between social equality and well-being.
The relationship between income equality and well-being is not as strong. We see many countries with low SEDA scores that have high levels of income equality—levels that are in line with many countries with high SEDA scores. Bangladesh and Pakistan, for example, are in the lowest SEDA quartile but have income equality scores comparable to Germany’s, a country in the top SEDA quartile.
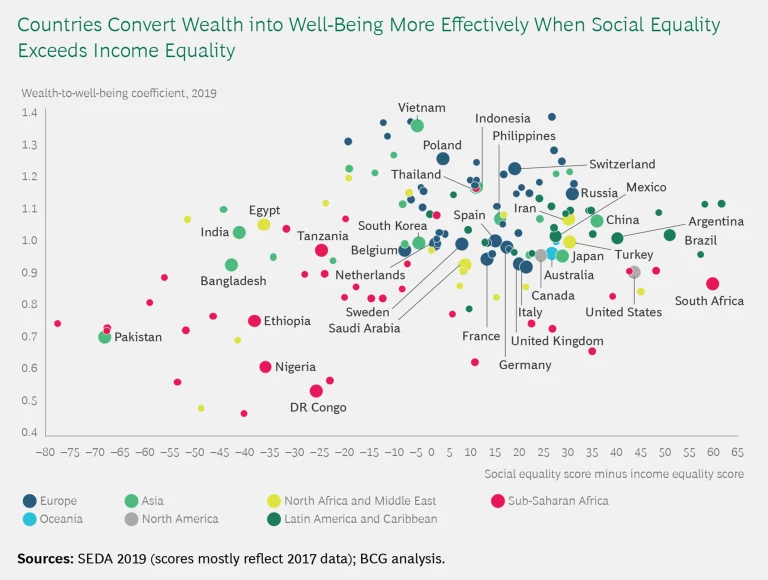
Looking at the wealth-to-well-being coefficient compared with the gap between SEDA social and income equality scores, we see more evidence of the importance of social equality. (See the exhibit below.) Countries with a higher coefficient—indicating a higher ability to convert wealth to well-being—also tend to be those where social equality is better than income equality. Countries with lower coefficients, meanwhile, tend to be countries where social equality is worse than income equality. This provides more evidence that governments should pay greater attention to addressing social inequality than they have in the past.
Note
*Income Gini coefficients are from the World Bank (based on household surveys); education and health inequality measures are from the components of the UN’s Inequality Adjusted Human Development Index. (See the Appendix for source details.)
The dashboard we envision would use the wealth-to-well-being coefficient as the measure of objective well-being in order to strip out the effect of income on well-being levels. When we look at the relationship between the wealth-to-well-being coefficient and happiness, there is no significant evidence of correlation. (See Exhibit 2.) For instance, Switzerland, with a wealth-to-well-being coefficient well above par, also does well in terms of happiness, while Vietnam—with an even higher coefficient—does not.
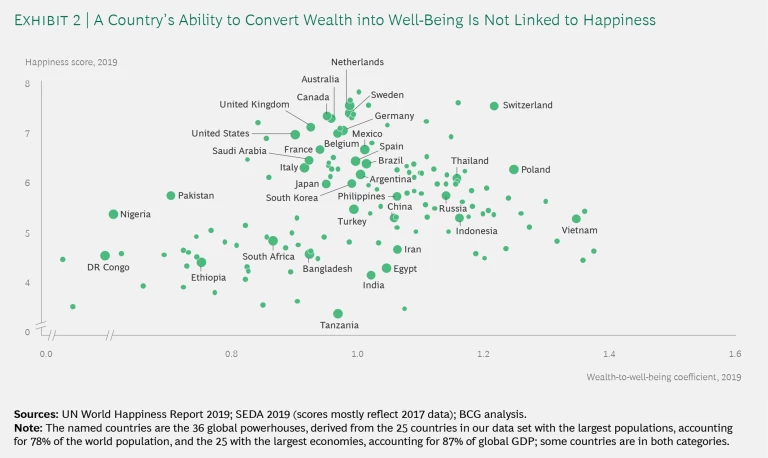
What does this mean for governments trying to set national strategy? The divergence between the wealth-to-well-being coefficient and happiness can be a warning sign, indicating that even for countries that excel at harnessing their resources to deliver well-being for citizens, there remain factors that contribute to dissatisfaction. This divergence can be a result of government’s inability to communicate a consistent narrative of progress that inspires citizens. Or it can reveal a more fundamental disconnect between the priorities of government and of citizens. It may also reflect the fact that citizens’ happiness depends on dimensions that go beyond national boundaries, such as regional and global insecurity or climate change, and include citizens’ perspectives on those issues and others that have an impact on the future.
The Three-Pronged View. We can see the value of the three-pronged view by using it to assess the global powerhouse countries. We segmented those countries into two groups: those that grew faster from 2006 through 2017 than countries with a similar income level in 2007 and those that that grew more slowly. For each group, we then sorted countries on the basis of the positive or negative changes in their objective (wealth-to-well-being coefficient) and subjective (happiness score) well-being measures. (See Exhibit 3.)
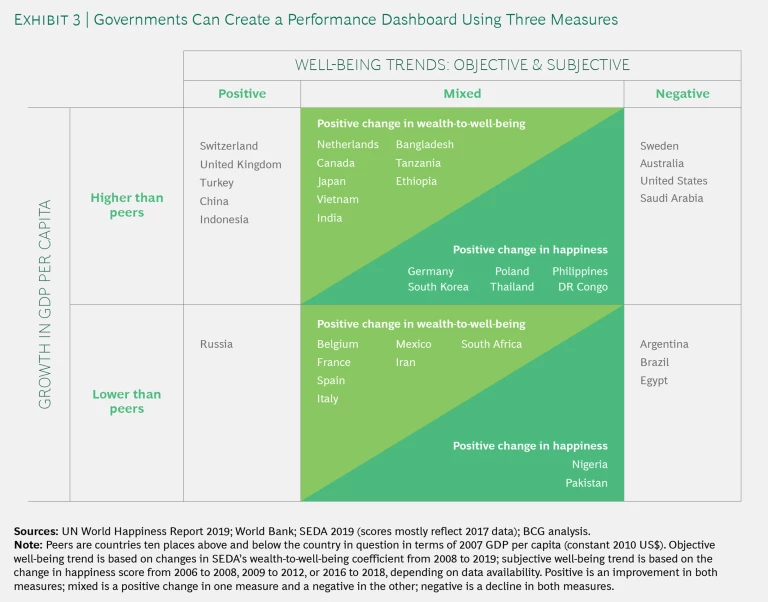
We found that 23 countries had faster economic growth than the group with a similar income level—but only 5 of them saw improvements in both the wealth-to-well-being coefficient and the happiness score. Another 4 backtracked in terms of both objective and subjective well-being measures. Most countries—including the majority of those that grew faster than economic peers and the 13 that grew more slowly—had a negative signal from either the objective or the subjective measure.
Digging into these results highlights that economic and well-being measures are often unaligned. Among countries that were growing quickly, nearly as many were doing poorly in both the objective and subjective measures of well-being as were doing well in both—with most somewhere in the middle.
The US falls into the first camp, with declines in the wealth-to-well-being coefficient, which slipped from 0.92 in 2008 to 0.90 in 2019, and the happiness score, which fell from 7.32 to 6.89.
India, meanwhile, falls in the middle group, with strong economic growth and a wealth-to-well-being coefficient that improved, from 0.90 in 2008 to 1.02 in 2019, but a decline in its happiness score, from 5.17 to 4.01 in 2018. Thailand, meanwhile, saw the reverse—strong economic growth and a rising happiness score (5.77 in 2008 to 6.01 in 2018), but a drop in its wealth-to-well-being coefficient from 1.25 in 2008 to 1.16 in 2019.
Among the 13 countries that underperformed in growth, the majority had a positive signal in one of the well-being measures. Mexico and South Africa, for example, both saw their wealth-to-well-being coefficient improve and their happiness score slip. Policymakers should try to understand what drove that improved conversion rate and build on that strength while assessing what explains lower happiness levels overall.
Overall, such findings underscore the value of a comprehensive dashboard. When GDP and well-being measures are moving in different directions, it’s a sign of missed opportunities to pursue policies that can serve both goals. A three-pronged view can bring those opportunities, and potential tradeoffs among them, to the forefront of public debate.
Identifying Best Practices
Governments grapple every day to balance competing priorities. Deciding where and how to deploy their effort and resources is a central challenge. SEDA can be a valuable tool in this regard by pinpointing a country’s strengths and weakness relative to other countries and over time. As governments try to turn these insights into action, SEDA can also help by identifying countries that have made significant progress in specific dimensions and can serve as role models in those areas.
SEDA reveals countries that can serve as role models in crucial areas such as health.
To that end, we conducted a detailed analysis of four dimensions: education, employment, health, and infrastructure. We chose education, health, and infrastructure because they represent the bulk of government expenditure (other than defense and welfare benefits). In addition, we found in our Striking a Balance Between Well-Being and Growth that strong performance in both education and employment was a differentiating factor for countries with high SEDA scores that were able to generate strong improvements in well-being. As a result, we believe it is important to look at these two dimensions together.
Before exploring which countries provide best-practice references in the four dimensions, it is worth stepping back to assess overall global progress on well-being. Because SEDA scores are relative measures, we do that by looking at the individual indicators that underpin these scores. We used data for the past 12 years to get a view of global well-being performance overall.
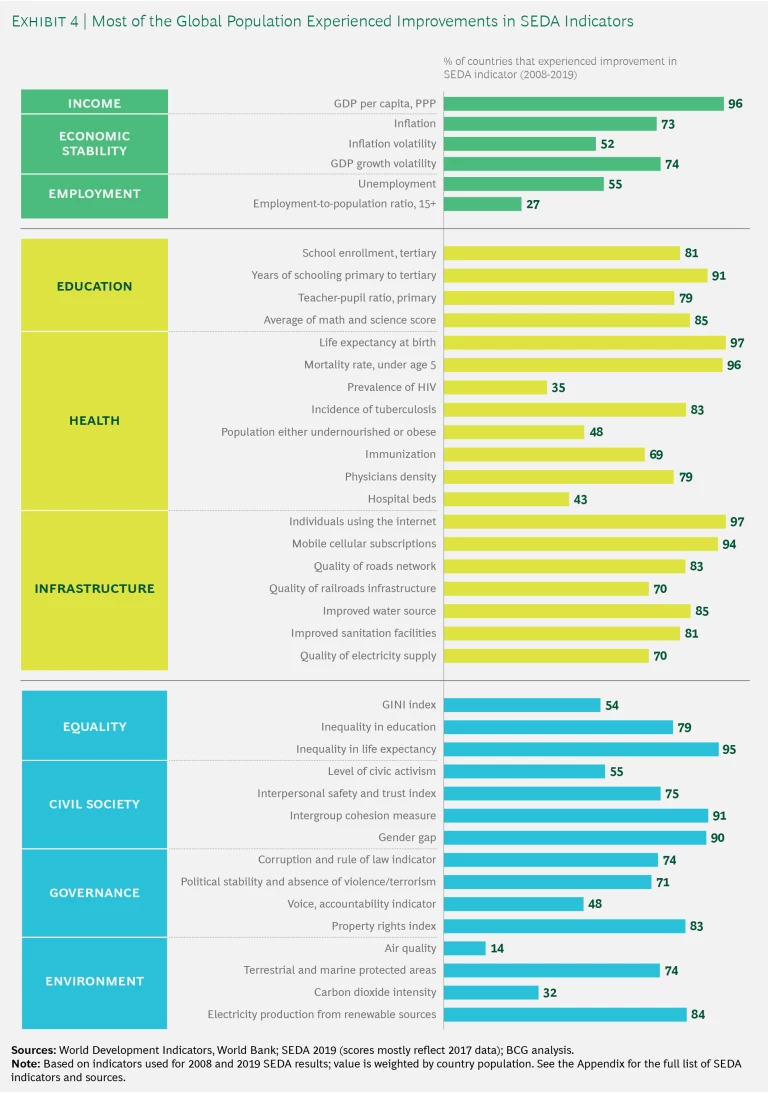
The main message is a positive one: in virtually all countries we analyzed (Lebanon and Yemen were the only exceptions), at least half of the 40 indicators improved from 2006 to 2017 (the most recent year for which data is generally available). This is especially impressive when looking at how improvements in various well-being components have affected people: in two-thirds of the countries (accounting for 78% of the world’s population), at least 26 of the indicators (65% of all indicators) improved during that period.
While progress on well-being has been widespread, the picture is more mixed when looking at indicators in the specific SEDA dimensions:
- Although many countries still lag behind in both education and infrastructure overall, there have been strong widespread improvements at the indicator level; at least 79% of the global population lives in countries where all education indicators improved.
- Governance shows progress overall—but only 48% of the population lives in countries where the voice and accountability indicators have improved.
- Health shows two very different dynamics. There has been substantial progress on key indicators such as infant mortality and life expectancy (over 96% of the population lives in countries where those two indicators have improved) and broad progress in three other indicators. Progress has been very limited, however, in two other indicators, including the one that tracks the incidence of either malnourishment or obesity. Only 48% of the population lives in countries where that indicator has improved.
- The environment dimension indicators also send conflicting signals: while there has been overall improvement on protected areas and renewable sources of energy, only 14% of the population lives in countries where air quality has improved—a major red flag.
- In employment, there is much room for improvement, given that just above half of the population lives in countries where unemployment was reduced and only 27% lives in countries where SEDA’s measure of labor force participation has increased. (See Exhibit 4.)
In the context of these generalized improvements in well-being indicators, we set out to identify countries that might offer insights into best practices in the four dimensions. For this purpose, we first selected countries with solid improvement in overall SEDA scores over the past 12 years and then spotlighted countries that met one of two criteria:
- Improvement in at least one of the four dimensions and above-par performance in converting wealth into well-being (meaning a wealth-to-well-being coefficient of greater than 1)
- Strong improvement in one of the four dimensions (at least a four-point increase) and near- or above-par performance in converting wealth into well-being (meaning a wealth-to-well-being coefficient greater than 0.95)
From the resulting set of countries, we highlighted a regional cross-section of examples that offer potential lessons in education, employment, health, or infrastructure. In Exhibit 5, a positive number indicates that the country’s change in that dimension was stronger than the average gain; a negative number indicates that the country’s change was weaker than the average.
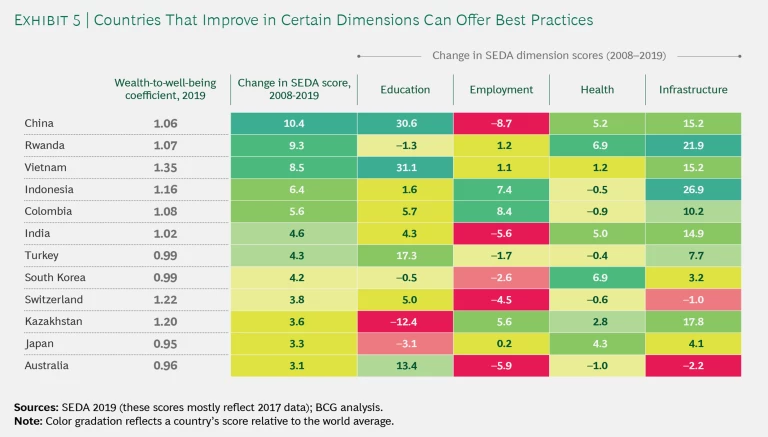
In an ideal world, countries that made improvement in well-being would be making above-average progress in all dimensions. But even when we focus on only these four dimensions, it is clear that making progress in numerous areas simultaneously is not easy. Among the spotlighted countries, Vietnam is the only one that has improved in all four dimensions relative to the rest of the world.
Making progress in numerous areas simultaneously is not easy.
China, Colombia, India, Indonesia, and Rwanda made very strong improvement overall, converted wealth into well-being at above-par rates, and posted above-average improvement in three of the four dimensions. Japan and Kazakhstan made overall progress and also improved in three of the dimensions relative to the rest of the world. South Korea and Turkey, meanwhile, made strong progress in two of the dimensions while losing ground in the other two. Australia and Switzerland made progress overall and posted strong progress in education, but lost ground in the three other dimensions (albeit starting from high performance levels). Examination of the strategies deployed by these countries in dimensions where they have excelled can offer lessons for other nations.
Insights from 2019 SEDA Results
Overall, the 2019 SEDA scores show that wealthy countries, which have large pools of resources at their disposal, enjoy a strong foundation on which to build well-being. Northern European countries with high per-capita income levels and sound institutions top the rankings, with Australia, Singapore, and New Zealand the only non-European countries in the top decile.
Of the countries in the top decile of SEDA scores, only three are not European.
Change in SEDA Scores
Progress over the past decade is hardly as static. Overall, as one would expect, countries with high SEDA scores (and less room for improvement) tend to show relatively low progress, while those with low SEDA scores tend to show more. But there are many exceptions. This underscores that there is no natural law driving convergence and that a country’s policy decisions and spending priorities are the primary determinants of progress.
To get a sense of this dynamic, we can look at both 2008 SEDA scores and changes in SEDA scores over the past 11 years. (See Exhibit 6.) Using the median for both measures, we can create four quadrants that tell differing stories of progress.
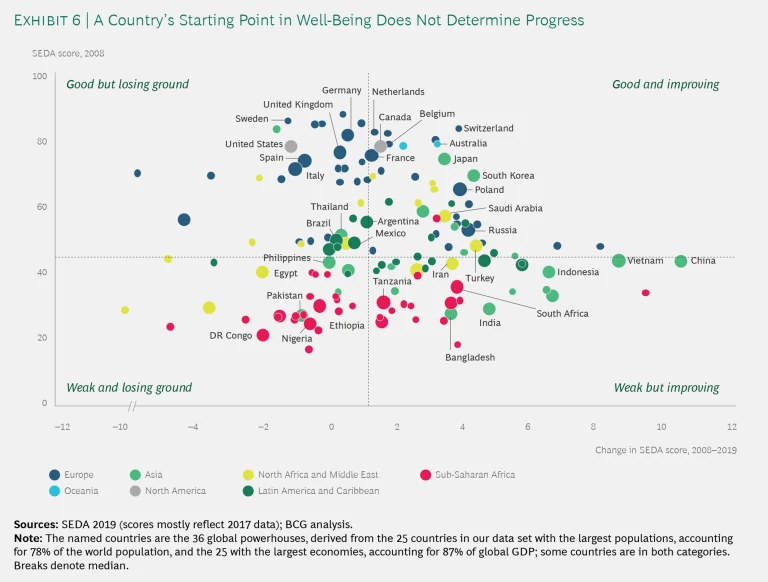
The good but losing ground quadrant is dominated by European countries, which have little room to improve but were also hit particularly hard by the 2008–2009 financial crisis. The story for the US is similar. Meanwhile, the countries in the good and improving quadrant enjoyed a strong starting position and have continued improving—notably, Switzerland and Poland.
Performance varied considerably among countries in sub-Saharan Africa, many of which fall in either the weak but improving or the weak and losing ground quadrant. The worst performance among the major countries in the region can be seen in the Democratic Republic of the Congo and Nigeria. South Africa, Tanzania, and Ethiopia managed to improve faster than the median—although their overall well-being scores remain low.
Asian countries have improved the most of any region. We find many of them in the weak but improving quadrant as well as a few (notably, Japan and South Korea) in the good and improving quadrant. The progress achieved by China and Vietnam stands out—and both are approaching the overall median for SEDA scores. Indonesia is also in the weak but improving quadrant but is still well below the median in current well-being. Pakistan is the worst-performing of the Asian global powerhouses; the Philippines is also in the weak and losing ground quadrant.
Among other regions, Latin America has also seen a majority of countries improving their positions, although the three global powerhouses there (Brazil, Mexico, and Argentina) were not among the countries improving above the median.
Assessing the trajectory of SEDA scores over time can yield powerful insights. (See Exhibit 7.) Countries from all regions have made significant strides. Among countries that started in the fourth quartile of SEDA 2008 scores (the top performers), Switzerland and South Korea posted steady improvements. Ireland’s path is also noteworthy: after dropping in the years immediately after the financial crisis, it has recovered strongly since 2014. Among countries starting in the top quartile in 2008, Hungary and Greece had the most significant declines.
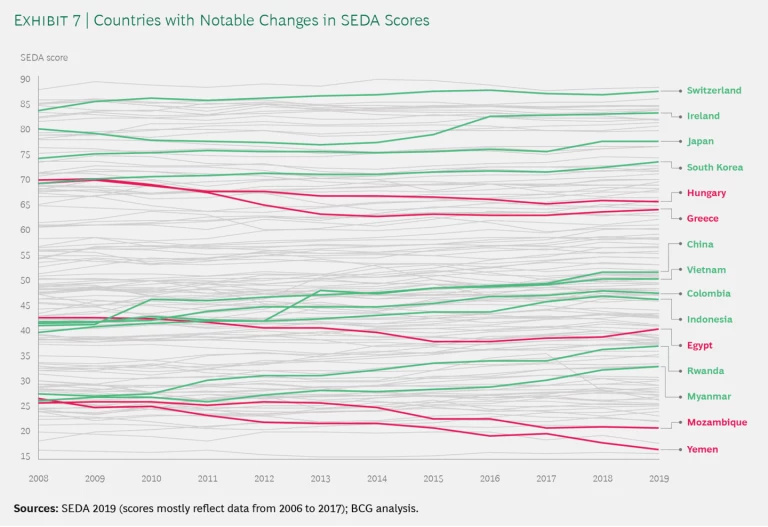
China was a standout in the second quartile in terms of gains in well-being. In that quartile, three other countries also posted strong improvements in their SEDA score: Vietnam, Indonesia, and Colombia. Among this group of countries, Egypt had a noteworthy decline over the period.
Looking at the first quartile—the lowest group according to 2008 SEDA score—Rwanda and Myanmar have shown strong improvements, while Yemen and Mozambique have dropped the most.
Converting Wealth into Well-Being
Assessing how effectively countries convert wealth into well-being—as reflected in our wealth-to-well-being coefficient—provides insights into the cumulative impact of government policies and expenditure as well as of broader societal choices.
Looking at all countries together, we find no relationship between income levels and conversion rates. (See Exhibit 8.)
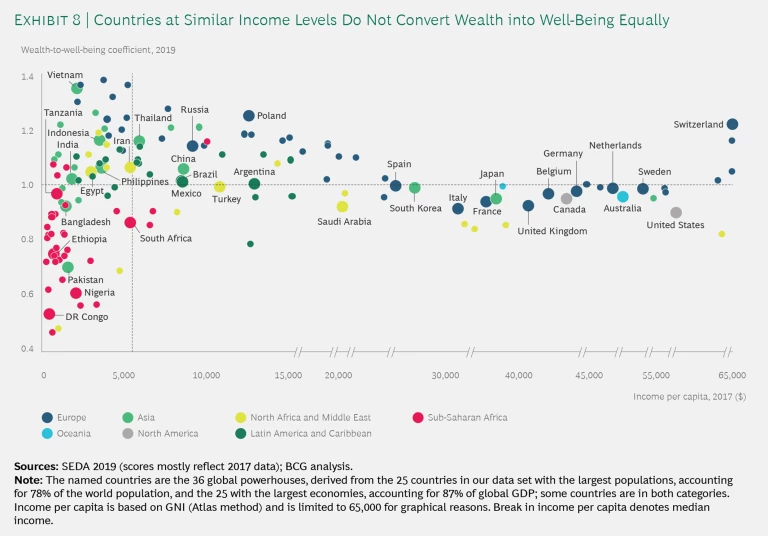
Among our 36 global powerhouses, Vietnam stands out for its performance in converting wealth into well-being, while Nigeria (like many oil-rich countries), Pakistan, and South Africa have the worst performances in that regard. Indonesia and South Africa have about the same per-capita income levels, but Indonesia is converting its wealth into well-being at an above-par rate, while South Africa’s performance is well below par. Similarly, Poland converts wealth into well-being much better than Argentina does—even though they have roughly the same per-capita income level.
Below a certain income level, however, there does seem to be an association between conversion rates and income per capita. Focusing on the countries with income per capita below the $6,000 median, we find a roughly even split between countries with a coefficient above par and those with a coefficient below par (as is the case for the SEDA universe as a whole, by definition). This pattern is visible in Exhibit 9, with roughly the same number of countries sitting above the line and below the line.
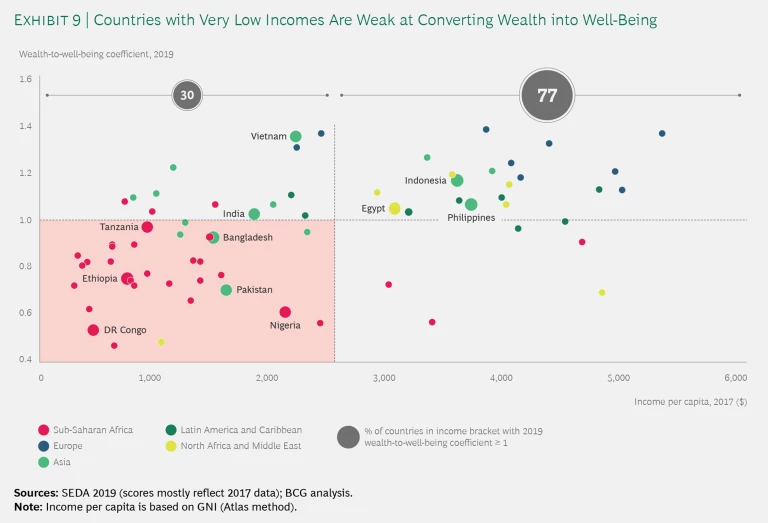
But when we look at very low-income countries—those with income per capita below $2,500—the pattern is different. Only 30% of countries in that income range have a coefficient above 1.0, with many of those countries located in sub-Saharan Africa. Meanwhile, 77% of countries with income per capita between $2,500 and $6,000 have an above-par coefficient, including many Asian nations.
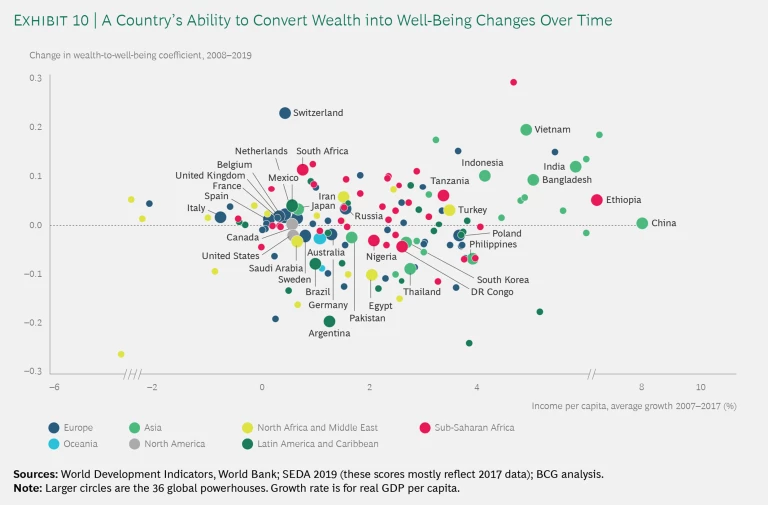
While conversion rates tend to be relatively stable over the short term, we see notable changes over the longer term. Among our global powerhouses, for instance, Vietnam and Switzerland improved their coefficients the most from 2006 to 2017, while Argentina and Egypt saw their conversion rate worsen. In general, the shifts seem quite independent of GDP growth rates. (See Exhibit 10.)
Ultimately, a country’s conversion ability has repercussions well beyond the living standards of its citizens at any single point. BCG research has shown that countries that excel at converting wealth into well-being tend to have faster-growing, more resilient economies. This finding reveals that there is a virtuous cycle between economic growth and well-being, in which gains in one lead to progress in the other.
From Insight to Action
Around the world, there is social dissatisfaction—not so much with the pace of economic growth as with growing inequality and the greater visibility into it, thanks to the widespread availability of information technology This underscores the importance and urgency of a broad focus on well-being in both statistics and policies. If GDP can become better at capturing the economic dynamics of a complex world, it will continue to offer a valuable yardstick. But on its own, GDP will not be sufficient to detect the emergence of major social challenges and help guide the response to them. Well-being metrics such as SEDA and the UN’s happiness scores can provide an early-warning system to trigger changes in government policy.
SEDA’s three elements (economics, investments, and sustainability) are also a useful organizational device for considering policy actions and resource allocation priorities. All three are equally important in determining well-being over the long term. In exploring avenues for improving well-being, the three areas under the investments element (education, health, and infrastructure) stand out: they account for a large share of public expenditure and lend themselves to decisive policy action and program implementation. In addition, the strong link between education and employment argues for those two dimensions to be explored jointly, along with related policies.
Countries that perform well overall in well-being and have based their progress in outstanding performance in either of these dimensions can be a valuable source of best practices. Those best practices can provide powerful lessons to guide all governments as they take action to achieve sustained improvements in well-being.


