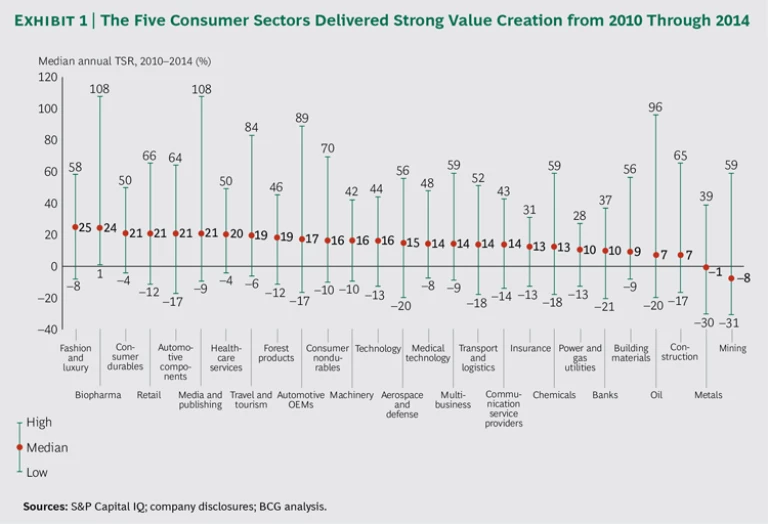
For the five-year period from 2010 through 2014, the consumer industry benefited from the global economy’s continued recovery, creating extremely strong value across most consumer sectors.
In 2015, The Boston Consulting Group published its seventeenth annual report analyzing the value-creation performance of 1,982 companies in 27 industry sectors. (See Value Creation for the Rest of Us, the 2015 BCG Value Creators report, July 2015.) This article takes a closer look at the consumer companies in that sample, which we break into five sectors: fashion and luxury, consumer durables, retail, travel and tourism, and consumer nondurables. (Other articles in this series examine the performance of each sector.)
The total sample included 351 companies in five consumer sectors. Among all 27 sectors in the analysis, fashion and luxury finished first, with a median annual TSR of 25%. (See Exhibit 1.) Consumer durables and retail tied for third place overall (each with a TSR of 21%), travel and tourism finished eighth (with 19%), and consumer nondurables finished eleventh (with 16%). (For an explanation of TSR and more details about our sample, see “Methodology and the Companies in Our Sample.”)
METHODOLOGY AND THE COMPANIES IN OUR SAMPLE
Total shareholder return (TSR) measures the combination of share-price gains and dividend yield for any given company’s stock over a period of time. The model uses the combination of revenue (sales) growth and changes in margins to indicate the company’s improvement in fundamental value. It then uses the change in the company’s valuation multiple to determine the impact of investors’ expectations on TSR. Together, these two factors determine the change in the company’s market capitalization and the capital gain or loss to investors. Finally, the model looks at the distribution of free cash flow to investors and debt holders in the form of dividends, share repurchases, and repayments of debt to determine the contribution of free-cash-flow payouts to the company’s TSR. (See the exhibit below.)
We divided our sample of 351 consumer companies into the following five sectors:
- Fashion and luxury includes 41 apparel companies—producers, retailers, and integrated players—with a minimum market cap of $4.5 billion.
- Consumer durables includes 47 companies with a minimum market cap of $2 billion.
- Retail includes 99 companies—traditional retailers, multichannel players, and online-only companies—with a minimum market cap of $4.5 billion.
- Travel and tourism includes 76 companies with a minimum market cap of $3 billion. This sector is made up of airlines, hotels, cruise lines, casinos, and travel distribution companies.
- Consumer nondurables includes 88 companies that manufacture fast-moving consumer goods and that have a minimum market cap of $7.5 billion.
A Closer Look at the Top Performers
In our work with leading companies around the world, we see multiple possible routes for creating value, depending on any given company’s starting point. Yet it is possible to create value in all sectors and industries. A closer look at the top ten companies in each of our five consumer sectors shows some clear trends in value creation over the study period.
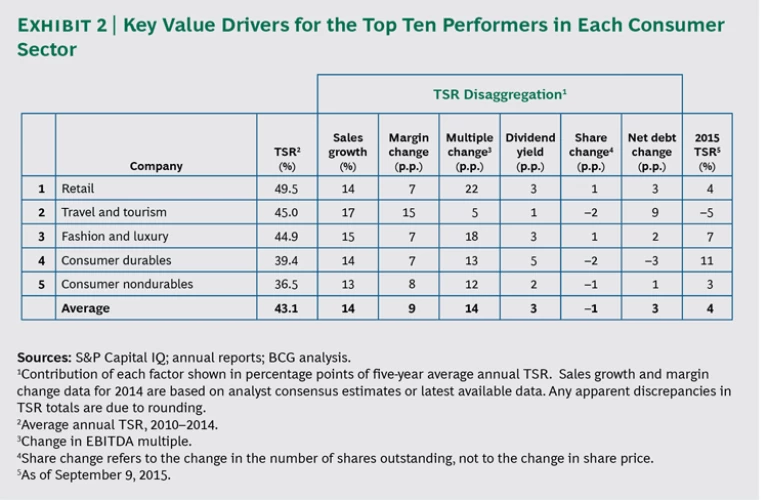
- As in years past, sales growth was a dominant driver of TSR for the top performers across all five sectors. For four of the five sectors, however, expansion in valuation multiples was even more important than sales growth, particularly for the retail and the fashion and luxury sectors. That contribution likely stems from the strong stock-market sentiment over the five-year period. (Exhibit 2 shows the TSR breakdown for the top ten companies across all five consumer sectors.)
- Improved margin performance remains a strong contributor to value creation for most of the top performers. The clear takeaway is that growth alone is not sufficient. Companies need to continue improving their margins through economies of scale, changes to the mix of their products and services, and investments to upgrade their portfolios, combined with a continued focus on increased efficiency and reduced costs.
- The average TSR for the top performers in each sector is considerably lower than it was in last year’s analysis. That study, which examined the period from 2009 through 2013, featured TSR values for the top performers ranging from 39% to 78%. The trend has continued in 2015. Virtually all of the sectors are experiencing relatively weaker performance this year, in large part because of the stock-market correction in mid-2015.
- As with last year, volatility was a key theme: 29 of the 50 companies constituting this year’s top-ten performers in the five consumer sectors are new to the rankings.
- The line between emerging and developed markets is fading. In past years, most of the top value creators were based in mature, western markets, and the companies in emerging markets on the list—frequently consumer-packaged-goods manufacturers in the nondurables sector—relied primarily on sales growth to boost TSR. This year, however, the proportion of companies in developed markets to those in emerging markets is more balanced. What’s more, the companies in emerging markets have TSR profiles that are similar to companies in developed markets, creating value across all six levers.
An Analysis of Individual Sectors
Below we look more closely at the performance of the top ten companies in each of the five consumer sectors.
Retail. In the overall sample of nearly 2,000 companies across 27 sectors, the retail sector tied with durables for third place. But looking only at the top ten performers in each sector, retail moved up to second overall, and first among the five consumer sectors. The top-ten retail companies returned an average of 49.5%, driven primarily by changes in the valuation multiples and sales growth. The top overall performer in retail was Domino’s Pizza, which had an average TSR of 65.6%. The biggest contribution to the company’s TSR came from a cash return to investors in the form of reduction in net debt—26 percentage points, more than any other top performer in any consumer sector.
Travel and Tourism. The top travel and tourism companies represent a wide variety of subsegments, including airlines, hotels, car rental companies, cruise lines, and online travel distributors. The top ten companies in this sector returned an average annual TSR of 45% as a result of large contributions from sales growth, margin improvements, and a cash return to investors through changes in net debt. In particular, the sector’s performance highlights the return of the US airline industry, following a wave of consolidation and restructuring as well as strong investments in airplanes and service elements to improve the flying experience for customers. Two US carriers finished in the top ten: Alaska Air Group (fourth) and United Continental (sixth).
Fashion and Luxury. The top fashion and luxury companies finished close behind the top retail players, with an average annual TSR of 44.9%, mostly as a result of changes in multiples (18 percentage points) and sales growth (15 percentage points). A notable trend among top performers in the sector is that they are more likely to sell apparel for specific activities than to focus on high fashion. For example, Sports Direct International—a UK retail chain that sells its own brands along with those of third-party manufacturers—finished third. And while Lululemon, the Canadian retailer of yoga clothing, did not finish among the top ten, it came close, at fourteenth.
Consumer Durables. In the overall sample of companies, the durables sector tied with retail for third place. But looking only at top performers, it dropped to fourth place among the five consumer sectors, and finished eighth in the analysis of the top ten performers in the 27 sectors, with an average annual TSR of 39.4%. Strong value creation in durables arose through a couple of specific avenues. Polaris Industries, a US-based maker of off-road vehicles that finished first among durables manufacturers, invests heavily in disruptive innovation. Several other companies benefited by focusing on higher-margin segments. For example, De’Longhi Appliances, an Italian manufacturer that sells high-end appliances such as coffee machines, finished second; and Middleby, a commercial-appliance company whose brand portfolio includes Viking ranges, finished third.
Consumer Nondurables. The consumer nondurables sector—both overall and among the top performers—experienced a drop in performance in our study this year. The top ten companies returned an average annual TSR of 36.5%, falling from 39.1% for the period 2009 through 2013, and nondurables finished lowest among all five consumer sectors. That is largely due to the perception that nondurables companies are defensive holdings that investors flock to during recessions. Given the global economic recovery and strong performance of equities from 2010 through 2014, investors rotated out of nondurables and into other consumer sectors.
Paths to Value Creation
In this year’s Value Creators report, we looked beyond sales growth—which is still the primary contributor to TSR for most companies in the overall sample—to consider structural factors and to examine companies that happened to hit the innovation jackpot. In our work with consumer companies globally, we see four main strategic options for creating value.
Sales Growth. The main strategic option for value creation is sales growth, which is back on the agenda thanks to continued economic recovery. In the first few years after the financial crisis and recession, many companies focused strictly on costs. Now, however, they can capitalize on those measures and grow from a more streamlined base—through both organic measures and M&A. The right growth strategy to create value includes the core business as well as adjacencies, along with new channels and markets. In addition, strategic M&A can help consolidate markets, realize synergies, and reduce costs even more.
For example, Under Armour, which tied for first in overall TSR among the fashion and luxury companies in the sample, posted strong organic growth during the time frame for our study. Of the company’s 58.4% average annual return, 29 percentage points came from sales growth. Under Armour has released a steady stream of new innovations—including athletic clothing that is integrated with digital technology to monitor performance—and new product lines, such as shoes and undergarments.
Digital Technology. Digital technology and changes to consumer behavior are opening up new avenues for value creation. For example, the ability to capture and analyze search and purchase data is helping companies develop more detailed customer profiles. As a result, they can create more targeted promotion offers and deliver them when they are most relevant to shoppers. Affinity programs and mobile technology (such as apps on smartphones and tablets), increase the potential for data-driven offerings even further. Manufacturers can also use digital to create value by operating more efficiently—for example, through embedded sensors in production equipment that can optimize performance.
Because the opportunity is so significant, there is also a threat to established players from online players, which were built in the digital era and can react with greater agility. For example, Priceline.com (fifth among travel and tourism companies) has invested significantly in technology, which has allowed the company to grow rapidly and expand into new segments of the travel value chain. Yet some brick-and-mortar companies have used digital technology to drive business. Starbucks (twenty-fourth on the retail list) has a mobile app that allows customers to pay using their phones, earn and redeem loyalty “Stars,” order ahead and pick up drinks without waiting in line, and more. The app speeds transactions, rewards customers, and allows the company to capture sales data and other digital insights about its customers.
Emerging Markets. Despite turbulence during mid-2015, particularly in Asia, emerging markets remain a strong strategic option for consumer companies looking to unlock growth. Many countries with large populations—such as China, India, and Indonesia—have an expanding middle class and a segment of extremely affluent shoppers. It’s critical for companies to reach these consumers before their brand preferences and allegiances become set.
For example, Hugo Boss (fifth in the fashion and luxury category) generated growth from an expansion into underpenetrated markets, primarily in the Asia-Pacific region, and a change of its business model toward company-owned stores. In the past, the company had relied on partnerships with retailers in established markets, and it used franchisees to expand quickly in emerging markets, allowing it to tap into local expertise and avoid missteps. Its transition to a direct-ownership model allows the company to increase margins and retain greater control over its brand image.
However, as we have highlighted in previous Value Creator reports, seeking growth in emerging markets is not for everyone. Success requires a global organization and a deep understanding of consumers and local customs. Companies must also learn how to deal with unfamiliar operating environments, laws, and regulatory standards, among other factors.
Transformation. The fourth strategic path for value creation is a broader, comprehensive change in strategy, operating model, organization, people, and processes. The traditional—and increasingly outdated—approach to such transformation treats these changes as cost-cutting exercises that focus primarily on reducing headcount. However, many companies are launching preemptive transformations while they still hold a dominant market position, essentially retooling themselves to stay ahead. In fact, transformations are comprehensive efforts aimed at helping companies adapt to an increasingly dynamic business environment, often through a change to the business, the operating model, or both. (See Transformation: The Imperative to Change, BCG report, November 2014.)
Foot Locker offers an example of the gains available through a comprehensive transformation. Beginning in 2010, the company laid out an ambitious agenda to improve performance and become the leading global retailer of athletic shoes and apparel. To that end, Foot Locker streamlined its operations and closed several hundred underperforming stores. It began remodeling many of the remaining stores, minimized markdown prices, and improved its product mix. A new inventory-allocation system uses past sales on a much broader scale to allocate new inventory more effectively, allowing the company to sell more units at full prices across all footwear styles. In addition, Foot Locker strengthened its exclusive agreements with many vendors and opened partnership spaces inside its stores to feature those brands. Roughly half of Foot Locker’s products are exclusive to the company, which reduces lost sales to other retailers and e-commerce sites. Of the company’s total TSR of 42.1% (which placed Foot Locker sixth among fashion and luxury players), approximately 24 percentage points came from improved margins.
As in past years, the top performers show the value of a balanced approach to TSR. They rely on sales growth but also continuously seek to improve margins while remaining close to investors and returning cash, when appropriate, through dividends, debt repayments, or share buybacks. Moreover, the lessons of value creation apply to both public and private companies. Activist investors have become more vocal in recent years about forcing public companies to make needed changes, but management teams can take the initiative in adopting the measures described here regardless of their company’s ownership structure. (See “Do-It-Yourself Activism,” BCG article, February 2014.) This kind of balanced approach takes time because companies need to get the fundamentals right and then execute at a high level even as the market conditions around them continue to change. As our analysis shows, there is no shortcut to creating value.


