
This is an excerpt from Total Societal Impact: A New Lens for Strategy.
Companies have long focused on maximizing total shareholder return (TSR) for investors. Today, under increasing scrutiny from all stakeholders, companies must also consider their total societal impact. TSI is not a metric; it is a collection of measures and assessments that capture the economic, social, and environmental impact (both positive and negative) of a company’s products, services, operations, core capabilities, and activities. Adding the TSI lens to strategy setting naturally leads companies to leverage their core business to contribute to society in a way that enhances TSR.
More on Total Societal Impact
- Total Societal Impact: A New Lens for Strategy
- Insights on Total Societal Impact from Five Industries
- How Companies—and CEOs—Can Increase TSI and TSR
Past research has demonstrated a link between a company’s performance in social and environmental areas and its financial returns. For example, a 2011 study showed that companies with good environmental and social policies not only have higher stock market returns but also perform better on return on assets and return on equity than companies that have not adopted good environmental and social
We quantified the relationship between specific topics and financial benefits.
While these studies provide support for the value of contributing to society, they do not offer a blueprint for how companies can actually go about this. To that end, BCG conducted a comprehensive study of how companies in five industries—consumer packaged goods, biopharmaceuticals, oil and gas, retail and business banking, and technology—are integrating the pursuit of societal impact into their strategies and operations. In four of those industries, we quantified the relationship between specific topics and financial benefits, helping companies understand which ESG topics they should focus
The BCG Methodology
There is no well-established methodology for measuring the full economic, social, and environmental impact of a company’s activities on society. We can, however, measure how well companies are performing in ESG topics.
Our first step was to identify the ESG topics that are most important in each industry we studied. These topics all relate to the companies’ core business models and operations and concern both the creation of positive societal impact (such as expanding financial inclusion in retail and business banking) and the minimization of negative societal impact (such as reducing waste in oil and gas).
To identify these ESG topics, we gathered extensive input from BCG industry partners, clients, and industry experts. We also drew on information from many organizations, in particular, the Sustainability Accounting Standards Board (SASB), which has zeroed in on nonfinancial topics that it considers to be “material”—that is, likely to be of interest to investors because they can affect financial performance. Our list of important ESG topics by industry ultimately included topics deemed material by the SASB as well as additional topics that BCG believes are important to society, irrespective of their current financial materiality in the industry.
A number of ESG topics are common across industries. Efforts to support diversity and to reduce the environmental impact of a company’s operations, for example, are relevant for most corporations in all the industries we studied. In addition, there are some less obvious areas—most notably, efforts to address humanitarian crises—that are applicable to multiple industries. (See “Business to the Rescue.”) More often, however, areas where companies have the most leverage to deliver societal and business impact are distinct to their industries.
Business to the Rescue
Business to the Rescue
Addressing humanitarian crises—whether a natural disaster, a flood of refugees, or a major health threat like the Ebola outbreak—cannot be a reactive endeavor. A comprehensive approach focusing on preparedness, response, and recovery is required. Historically, such efforts have been spearheaded by governments, the United Nations (through its Office for the Coordination of Humanitarian Affairs), agencies like the World Food Programme, and NGOs such as Save the Children. While some companies, such as logistics providers, have been deeply involved in disaster preparedness and response, the role for most private-sector companies has been limited to writing checks to fund efforts by governments and NGOs.
That is changing. Companies are increasingly bringing their knowledge, skill set, and assets to bear on some of the most pressing humanitarian crises around the globe.
Airbnb, for example, made a bold pledge in early 2017 to arrange short-term housing for 100,000 people in need over the next five years, including refugees, disaster survivors, relief workers, and other displaced people. The company has already provided homes during almost 50 global natural disasters to thousands of people. These efforts have not only provided visible social value but also have helped grow the business—almost 50% of hosts who join the platform during these disasters were not previously registered with Airbnb—and improve the company’s standing with government leaders. For example, in Florida, ahead of Hurricane Irma in September 2017, Governor Rick Scott encouraged evacuees to find free accommodations on Airbnb through the company’s disaster relief tool.
DHL, meanwhile, has created a series of disaster response teams. The sudden influx of supplies and aid can be overwhelming after a natural disaster, making it difficult to get those things to people who need them. DHL is able to use its logistics expertise—on a pro bono basis—to help solve that problem. After a devastating cyclone hit Fiji in 2016, DHL organized the logistical handling of all the relief supplies that came into Walu Bay or Nausori Airport and provided Fiji’s National Disaster Management Office (NDMO) and NGOs with an accurate count of what aid was available and where.
In many cases, private-sector companies in an affected region are uniquely equipped to respond to a disaster given their on-the-ground presence. Consider steel and mining company ArcelorMittal, which has long invested in preparedness by tracking and monitoring potential risks to its operations and workforce around the world. During the Ebola crisis, which peaked in 2014, the company stepped forward to partner with the response agencies. It conducted Ebola initiatives focused on community awareness and screening and used its machinery and capacity to construct treatment centers. In addition, the company’s leadership was instrumental in organizing in-country companies into a coalition called the Ebola Private Sector Mobilisation Group (EPSMG), which eventually included over 80 companies. This group shared information internally and became a single point of contact for the public sector. The coalition, with its long-term presence and commitment in the affected countries, became a powerful voice to governments on shaping policies in the midst of the crisis that supported rapid response and long-term recovery.
Coalitions like the EPSMG can amplify the impact of the private sector by bringing companies together. In the Philippines and Nigeria, company networks have been extremely valuable in responding to natural disasters. The UN, under the Connecting Business initiative, is seeking to support the creation of such national-level private-sector collective action around the world. Such moves will allow companies to leverage their scale in addressing major global crises, generating rewards both for the companies involved and for society at large.
After identifying the right topics for each industry, we determined which we could measure with available data. There are a number of sources that measure company performance on these topics. For this study, we used data from MSCI and Oekom Research, two of the leading providers of such information. We then selected for analysis the largest companies in each industry that collectively represented at least 80% of the industry’s market capitalization and for which there was publicly available data for at least the past three years. This yielded 39 to 141 companies for each industry.
We then analyzed, by industry, the relationship between nonfinancial (ESG) performance and two key financial variables: valuation multiples and margins (EBITDA margins and gross
Our valuation analysis relied on Smart Multiple, BCG’s well-established, proprietary approach for predicting quantitatively the valuation of public companies. (See The 2013 Value Creators Report: Unlocking New Sources of Value Creation, BCG report, September 2013.) The Smart Multiple approach uses a multiple regression model incorporating traditional financial performance measures such as margin levels, growth rates, debt leverage, and company size. By adding nonfinancial measures to the Smart Multiple model, we can determine the incremental impact on valuation of ESG performance, separate from financial performance. In our margin analysis, we used a similar approach to control for a variety of factors—for example, R&D spending—in order to zero in on the incremental impact of ESG performance.
We did, however, run up against some data limitations. Metrics for many of the areas on which technology companies are focused—such as using their products to improve social and economic inclusion—are not yet detailed and nuanced enough to adequately reflect the variety of emerging business models in the industry. For that reason, we could not include the technology industry in our quantitative analysis. However for the four industries we were able to analyze—consumer packaged goods, biopharmaceuticals, oil and gas, and retail and business banking—ESG data was available for two-thirds of the ESG topics we thought were relevant. (See the Appendix for more on our methodology.)
The Link Between ESG and Financial Performance
Our quantitative analysis revealed a concrete link between performance on specific ESG topics and both valuation multiples and margins. We found positive, statistically significant correlations on valuation multiples for 16 topics and positive, statistically significant correlations on margins for 17 topics out of a total of 65 topics examined across all
It is important to note that our analysis does not prove causality. In fact, in some cases it may be that higher margins, for example, allow companies to invest more in ESG initiatives, resulting in stronger ESG performance. However, in many cases it is likely that performance in these topics is contributing to financial performance. Ultimately, the two factors—strong ESG performance and strong financial performance—may be self-reinforcing.
The results of our valuation and margin analyses provide encouragement to companies focusing on ESG-related issues. We expect that evidence of the positive correlation between ESG and financial performance will continue to emerge as data becomes more reliable and available and as companies actively pursue TSR and TSI in tandem.
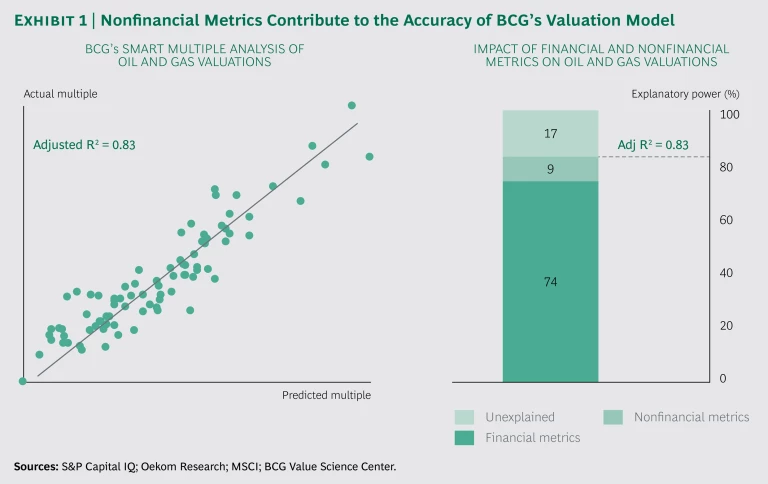
The Link Between TSI and Valuation Multiples. We found that companies with strong performance in material ESG topics enjoyed a premium valuation
This finding yields a powerful insight. While it has long been understood that fundamental financial factors such as margin structures, growth rates, and financial risk are key drivers of valuations, our results show that nonfinancial performance metrics—the ESG measures—add significant and incremental information that also affects valuations directly. Factoring in ESG made our valuation models more accurate. In oil and gas, for example, adding ESG factors to our model increased its predictive power, with nonfinancials explaining 9% of valuation and financials 74%. (See Exhibit 1.)
What does all this mean for executives? They need to know which ESG topics have a positive correlation with valuations in their industry. (See Exhibit 2 .)
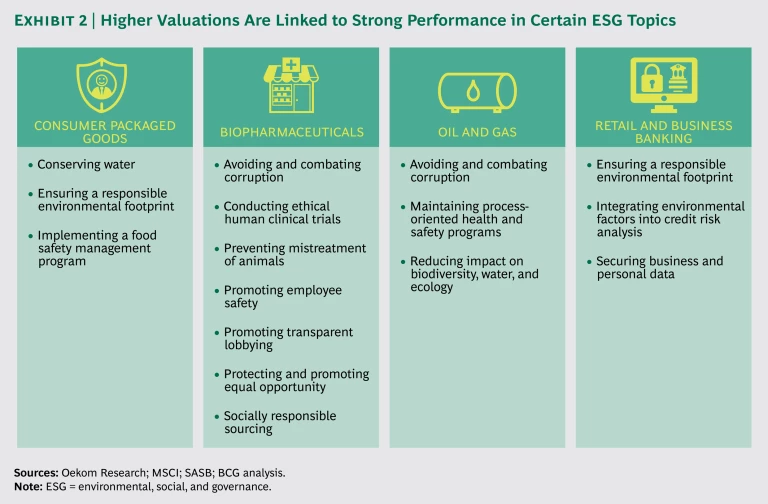
As we looked at those topics, we noted a pattern: nearly all are related to risks or other negative impacts that are particularly relevant in certain industries. Examples include ensuring a responsible environmental footprint and maintaining robust occupational and safety programs. We call these downside topics. The remaining topics are upside opportunities, optional activities that can generate revenue. Nearly every one failed to show a positive correlation to valuations.
We aggregated all downside topics and analyzed their combined connection to valuation
In all four industries, top performers for combined performance in all downside topics had market valuation premiums relative to the median performers in those topics. This premium was 11% for consumer packaged goods, 12% for biopharmaceuticals, 19% for oil and gas, and 3% for retail and business banking.
So, why would we see a correlation with downside topics but not upside opportunities? The downside topics are well known and so, not surprisingly, relatively good metrics have been developed to measure them. The upside opportunities, in contrast, tend to be newer concepts for which the relevant metrics might be difficult to collect or of weaker quality. If a bank aims to increase financial inclusion, for example, what would be the most meaningful measure to track that? It is possible that given the challenges of measuring upside opportunities, investors are not able to integrate them effectively into valuations.
The Link Between TSI and Margins. We found a positive correlation between margins and both upside opportunity and downside ESG topics in consumer packaged goods, biopharmaceuticals, oil and gas, and retail and business banking. In our analysis, we examined margin premiums—the percentage point difference between margins for top performers in ESG topics and median performers. In oil and gas, for example, if median performers in the health and safety topic had an EBITDA margin of 30%, our analysis showed that the EBITDA margin for top performers in that topic—all other things being equal—was 33.4%. (See Exhibit 3.)
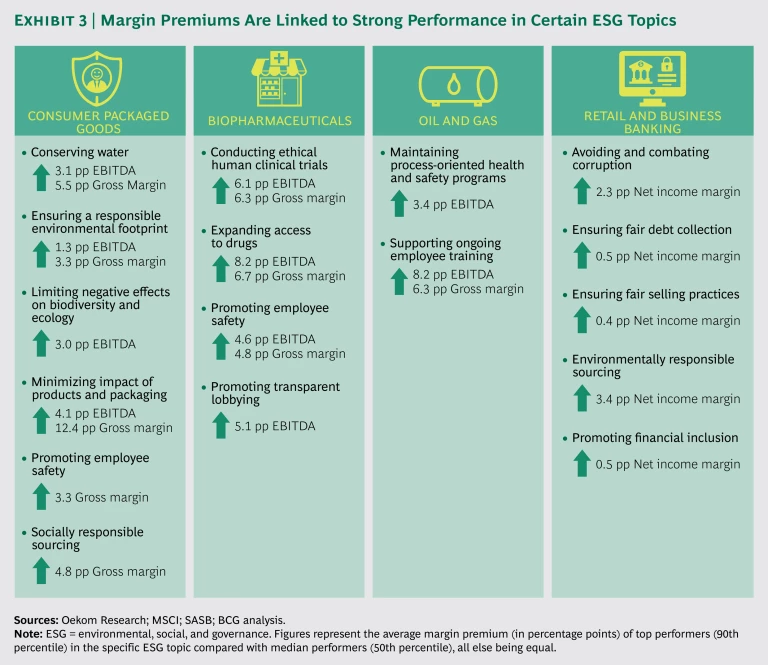
In most cases, for consumer packaged goods, biopharmaceuticals, and oil and gas, the positive relationship showed up in both EBITDA and gross margins. For the purposes of the industry discussions that follow below, we highlight the measure for which the correlation was strongest.
It is not difficult to understand why strong performance in the downside topics would contribute to higher margins. Many of them are related to practices that can lower costs, such as the reduction of water and energy use and minimizing the likelihood of a catastrophic operating incident.
While performance in many upside opportunity topics may not yet be rewarded by investors (as reflected in our valuation findings), it can have a direct effect on performance by helping a company create a sustainable competitive advantage over rivals. A more inclusive supply chain, for example, can help a company attract a broader, more socially conscious customer base.
Insights on Societal Impact by Industry
Our quantitative analysis reveals the power of a focus on ESG. So, what ESG areas are linked to financial performance, and what are individual companies doing in those areas? Here we address those questions for each industry in our analysis. For the purposes of this report, we examine company activities related to topics where our analysis found a quantitative link—and a few where we did not.
Consumer Packaged Goods: Helping Suppliers and Customers
The opportunity for consumer packaged goods (CPG) companies to have a positive impact on society exists in all elements of their operations, from sourcing to manufacturing to the types of products they sell. Our quantitative analysis of the consumer packaged goods industry found links between performance in certain ESG topics and both valuations and margins:
- Valuations. The 11% valuation premium for top performers in all downside ESG topics was due to three of those topics: implementing a food safety management program, conserving water, and ensuring a responsible environmental footprint.
- Margins. Gross margins were 4.8 percentage points higher, all else being equal, for top performers in integrating social factors into sourcing and procurement than for median performers and 3.3 percentage points higher for top performers in promoting employee safety. Margins were also higher, all else being equal, for top performers in four environmentally related areas—ensuring a responsible environmental footprint, limiting negative effects on biodiversity and ecology, minimizing the impact of products and packaging, and conserving water.
The importance of environmental issues for CPG companies was apparent in both our valuation and margin analyses. Why would this be? On the valuation side, investors are likely recognizing that consumers are gravitating toward companies with a strong environmental track record. When it comes to margins, the connection may be related to two factors. First, some companies with a strong environmental record have been able to sell products at a price premium. Second, companies that take steps such as minimizing packaging waste or water use often lower their costs in the process.
Global CPG player Unilever sees tackling packaging waste as a key challenge—and opportunity. The company points out that by 2050, it is estimated that there will be more plastic than fish in the world’s oceans. And given that the company purchases more than 2 million tons of packaging every year, Unilever recognizes it needs to be part of the solution.
That’s why in 2010 the company committed to halve the waste associated with the disposal of its products and to increase recycling rates in key markets. Furthermore, Unilever committed to make all the company’s plastic packaging fully reusable, recyclable, or compostable by 2025 and to increase the use of recycled plastic content in its packaging to at least 25% by 2025. Unilever notes that this is not only the right thing to do environmentally, but the business case for action is clear. Since 2010, the company has reduced its waste footprint per consumer by 28%, saving millions of euros in packaging costs across the portfolio annually. At the same time, Unilever says such efforts promote topline growth by appealing to the more than 50% of consumers who, research has shown, prefer brands that are responsible with their use of natural resources.
Companies in our analysis that integrate social issues into sourcing and procurement decisions also enjoyed a sizable margin benefit. The existing ESG measures in this area focus on working conditions and labor rights.
Many companies that have strong records in those areas have begun taking a more expansive view, evaluating the full range of challenges and needs in their supply chains. This includes everything from how small suppliers, such as farmers, can earn a living wage to how to create greater community support and financial empowerment for suppliers. Given the size and scale of the supply chains of large CPG companies, efforts in these areas can have a real impact on economic development in regions where the company sources. At the same time, it can make the company’s supply chain more resilient and cost effective because it is less dependent on just a few suppliers and distributors and raw materials are sourced closer to the end market.
For PepsiCo, a reliable agricultural supply chain is critical to ensuring a consistent flow of high-quality raw materials. The company has made significant moves to strengthen its agricultural supply chain in ways that help farmers produce more and earn more in the process, while respecting human rights and protecting the environment. The company plans to expand its Sustainable Farming Initiative, an industry-leading program that promotes agricultural best practices, increased yields, and workers’ rights, to reach more than 7 million acres by 2025, which collectively represents 75% of the company’s agricultural spending. This protects a critical part of PepsiCo’s global supply chain while helping to solve important economic, environmental, and social issues.
As part of the initiative, the company has developed a robust potato growing program in India, for example, that provides training to farmers, in part through a team of agricultural experts. The training, aimed at helping farmers grow the specific potatoes needed for the Lay’s product line, covers topics such as the ideal distance between planted rows of potatoes. In addition, PepsiCo announces the prices it will pay for potatoes ahead of the growing season, allowing farmers to better plan, manage costs, and earn a sustainable income. The company uses its Sustainable Farming Initiative in 33 countries to date with growers on farms of all sizes, with varied crops. This effort pays real dividends for PepsiCo, guaranteeing access to high-quality raw materials in many locations and thus making the supply chain more resilient.
For certain ESG topics, our analysis of the consumer packaged goods industry did not find a link between ESG performance and financials where we would have expected to find one. Consider the work many leading food companies have done to improve the nutritional and health attributes of their product portfolio. The pressure from regulators and investors for food companies to address this issue continues to intensify. But our analysis did not show a correlation with valuations or margins. This might be because consumer packaged goods includes nonfood companies and our sample is primarily large publicly listed players. It is possible that correlations would emerge in an analysis with a narrower industry definition or one that looked at smaller companies that focus on healthy foods.
Biopharmaceuticals: Bringing Life-Saving Medicines to Those in Need
For the biopharmaceutical industry, the connection to societal impact is clear and direct. The industry’s products improve human health and save lives. And the astounding medical advances driven by the biopharmaceutical industry over many decades have revolutionized health care. But that progress has presented challenges as well—most notably, how to ensure that life-saving medicines are accessible to as many people as possible, including those who cannot afford to pay for them. This issue is so critical that it is a major element of one of the UN’s SDGs.9
Our quantitative analysis of the biopharmaceutical industry found links between performance in ESG topics and both valuations and margins:
- Valuations. The 12% valuation premium for top performers in all downside ESG topics was due to seven topics, including conducting ethical human clinical trials and avoiding and combating corruption.
- Margins. EBITDA margins were 8.2 percentage points higher and gross margins were 6.7 percentage points higher, all else being equal, for top performers in expanding access to drugs than for median performers. In addition, top performers in conducting ethical human clinical trials and promoting employee safety had EBITDA margin and gross margin premiums. And top performers in promoting transparent lobbying had an EBITDA margin premium.
The valuation findings reflect the likelihood that companies with stellar records in human clinical trials and combating corruption tend to do well in controlling risk. In addition, companies that are known for excellence in R&D tend to adhere to the highest ethical standards in conducting human clinical trials. Such excellence is likely to be a key factor in both our valuation and margin findings.
The largest margin premium we saw was linked to expanding access to medicine. But determining cause and effect here is particularly difficult. Making products accessible in developing markets can, for example, drive valuable innovations, including changes in manufacturing and product technologies that ultimately lower costs. However, industry observers point out that margins tend to be lower in emerging markets and that the causality may go in the other direction: companies with healthy margins have more flexibility to invest in expanding into new, developing markets. Determining causality is also difficult because it is challenging for companies to determine the true cost of serving a developing market and to allocate resources appropriately.
For decades, companies have expanded access to medicine largely through donation programs. But increasingly, many are looking for ways to leverage the core business more directly to achieve that goal. Merck, for example, is harnessing its manufacturing operations and supply chain to make some critical drugs more accessible.
The company launched a program in 2010 with a goal of making its products accessible to 80% of the world’s population. The company employed a number of levers to achieve this. Some, such as deploying technologies like enzymatic bio-catalysis to improve costs and yield, had direct application to the global business. Others, such as improving the efficiency of procurement through localized sources of supply, could be more directly targeted at specific products and markets. Overall, these actions aimed to reduce manufacturing costs, improve yield, and create more environmentally friendly manufacturing processes. Additionally, Merck has made changes in packaging, distribution, and storage in developing markets to ensure that its products can reach patients in those markets. Such investments have allowed the company to expand the availability of products in developing markets, a necessary condition for meeting its accessibility goals.
9. United Nations Development Programme, Goal 3: Good Health and Well-Being.
Oil and Gas: Facing the Challenge of Climate Change
Oil and gas companies face a significant challenge to their traditional business model from climate change. The industry’s attention to this issue reflects an intensifying focus on climate from large investors, some of which are pressuring oil and gas companies to adjust the value of their reserves to reflect potentially stranded assets. As countries around the world commit to limit global temperature increases, some oil and gas reserves may never be developed. In addition, a recent taskforce led by Michael Bloomberg recommended that companies should disclose climate risk information in their public filings.
Our quantitative analysis of the oil and gas industry found links between performance in ESG topics and both valuations and margins:
- Valuations. The 19% valuation premium for top performers in all downside ESG topics was due to three topics: maintaining process-oriented health and safety programs; reducing the impact on biodiversity, water, and ecology; and avoiding and combating corruption.
- Margins. EBITDA margins were 3.4 percentage points higher, all else being equal, for top performers in maintaining process-oriented health and safety programs than for median performers. There was also a strong link between margins and performance in supporting ongoing employee training.
It is hardly a surprise that health and safety and environmental issues are linked to higher valuations. Minimizing accidents and environmental damage, after all, is a well-understood factor in shareholder returns. At the same time, a top-tier health and safety record, as well as solid employee training, is linked to a clear boost in margins. Companies that excel in both areas are more likely to avoid long and expensive disruptions from accidents or other negative events.
Given the importance of climate change, it is notable that we did not find a link between oil and gas companies’ efforts to address climate change and financial performance. Our analysis examined two measures in this area—investing in alternative energy and minimizing carbon intensity in reserves—and found no connection to either valuations or margins. This is understandable. Investments in alternative energy programs and the resulting revenues are both very small compared with investments in and revenues from oil and gas exploration. And the ultimate impact of reduction of the carbon intensity of reserves on valuations remains unclear given the uncertainty of policies, such as potential carbon taxes. This will become clearer over the long term.
Despite the complexity surrounding the climate change challenge, some companies are taking action. Total, for example, has been integrating climate change into its decision making since 2000. The company made several significant changes to its strategy, including reducing oil and increasing natural gas in its portfolio, exiting the coal business in 2015, and increasing R&D and pilot projects in CO2 capture and storage.
This effort has required some difficult decisions. When faced with the opportunity to pursue a very profitable coal-related project in China, for example, Total first attempted to make the project more sustainable. Ultimately, however, the company abandoned the project altogether, deciding it was incompatible with its commitment to move away from coal.
We did not find a correlation between externally facing social areas, like community involvement, and either valuations or margins. This may be because data on community activities is difficult to track, particularly given the many communities in which oil and gas companies operate.
Measurement issues aside, oil and gas companies have long recognized the importance of community relations to the success of the business. They often operate in remote, less developed regions, where their business practices, including safety, compliance, and sourcing, have significant implications for the local population. And they often work with local governments and other groups to support the development of local businesses that can become suppliers to the company.
In addition, there is an opportunity for forward-looking companies to support national-level initiatives. This can take many forms. Companies can help governments determine how best to use the funds they receive from energy revenues—to help develop national infrastructure or the education system, for example. They can also contribute expertise to governmental economic development programs.
Retail and Business Banking: Innovating to Expand Financial Inclusion
The role of financial institutions, including banks, is to finance the real economy. The tremendous growth in the financial sector over the past couple of decades, however, has highlighted that some in the industry have shifted away from that role. The result has been the development of ever-more-complex financial instruments and greater risk, which contributed significantly to the financial crisis of the past decade. In addition, company-specific scandals involving retail banking customers have further eroded trust in the industry. As a result, many banks are now realizing that a renewed effort to make positive contributions to society can help rebuild their own and their industry’s standing.
- Valuations. The 3% valuation premium for top performers in all downside ESG topics was due to three topics: securing business and personal data, ensuring a responsible environmental footprint, and integrating environmental factors into credit risk analysis.
- Margins. Net income margins were 0.5 percentage points higher, all else being equal, for top performers in promoting financial inclusion and 3.4 percentage points higher for top performers in integrating environmental factors into sourcing and procurement. There were also margin premiums for top performers in three topics related to ethical business practices: ensuring fair selling practices, ensuring fair debt collection, and avoiding and combating corruption. There were, however, two negative correlations: top performers in integrating environmental factors into credit risk analysis and protecting and promoting equal opportunity had lower net income margins, all else being equal, than median performers in those topics.
The connection between valuations and securing business and personal data is fairly obvious given that such protection is now considered table stakes in an age of more frequent cyberattacks.
Some of the other links we found, however, are more complex. Consider the connection between valuations and the integration of environmental factors into credit risk analysis. This correlation indicates that investors recognize that borrowers with poor environmental practices can be higher credit risks and are rewarding banks that factor this into their lending with higher valuations. However, this topic had a negative correlation with margins, indicating that near-term financial performance may take a hit when banks factor environmental issues into lending decisions and thus forgo loans that are profitable in the short term.
Not all banks, however, are suffering negative effects from such practices. Spurred in part by several shareholders and environmental groups, PNC decided in 2015 to reduce its lending to coal-mining companies, particularly those involved in mountaintop removal mining (MTR). Since then, PNC has continued to reduce its exposure to coal mining and now prohibits lending to coal producers with anything more than a minor exposure to MTR. While the business predicted a small financial hit, its decision ended up being a good economic move, reducing risk in its portfolio and bringing in some new clients that embrace the new policies. A supportive board of directors, as well as a strong risk committee that understood how to integrate social and environmental issues into long-term risk assessment, helped PNC make a strategic move that has paid off.
Of course, banks can go beyond just saying yes or no to borrowers on the basis of their environmental or social practices. We think banks have a real opportunity to influence the projects they finance. They can, for example, provide insight to borrowers on best practices in social and environmental issues and encourage those borrowers to adopt such approaches.
The positive correlation we found between promoting financial inclusion and margins may reflect recent advances. In the past, many banks considered expanding service offerings to unbanked or underbanked groups to be a cost of doing business in order to comply with government mandates. More are now looking at this as an opportunity, as new financial technology (fintech) solutions and partnership models make it easier to profitably offer affordable financial products and services to underserved groups.
At the same time, such activities can yield meaningful social benefits. BCG’s 2016 Sustainable Economic Development Assessment (SEDA) found a concrete connection between a country’s level of financial inclusion and its overall well-being. (See The Private-Sector Opportunity to Improve Well-Being, BCG report, July 2016.)
To expand financial inclusion and derive business benefits, banks must get creative. And they need to adapt their approach to the regulatory environment and market dynamics in the locations where they operate.
Consider Standard Bank. In South Africa, under the government program known as Enterprise Development, banks must direct 0.2% of their profit to support black-owned small and midsize enterprises (BSMEs). That requirement is generally met simply by making donations or grants to black entrepreneurs or BSMEs. Standard Bank, however, has taken a different approach. The bank invested a portion of the money into an independent trust to be used as collateral for loans to aspiring black entrepreneurs, none of whom would have qualified for loans. The bank used other enterprise development funds to provide support to those businesses, such as technical advice and services. This approach allowed the bank to provide business loans to a larger number of BSMEs and to help improve the performance of those businesses. Moving forward, Standard Bank plans to expand parts of the BSME financing model to other SMEs. (For more information on financial inclusion, see Improving Financial Inclusion in South Africa, BCG Focus, April 2017.)
Bank margins were also bolstered by a strong track record in ethical business practices. It is likely that such actions not only protect the bank brand but also reduce costs. Fair selling practices, for example, can lower customer attrition rates and minimize fines because the bank is not selling inappropriate products to its customers. Fair debt collection, meanwhile, can also reduce customer attrition. And banks that avoid and combat corruption are likely to face lower costs related to fraud, including lawsuits and government penalties.
In addition to the negative correlation noted above related to integrating environmental factors into credit risk analysis, we also saw a negative correlation between performance in protecting and promoting equal opportunity and net income margins. It is possible that such efforts may be associated with investments in the short term, which affect margins.
Technology: Expanding Economic and Social Inclusion
In our interviews, it was clear that technology companies often view their core business as making dramatic contributions to the overall good of society. A number of online platforms, for example, give people in remote areas access to information and to global marketplaces, a development that supports economic inclusion and equity.
We were unable to analyze the relationship between ESG performance and financial performance, as we did for the other four industries, because of data challenges. In particular, data is not currently tracked for a number of the areas in which we believe technology companies can have a significant societal impact. This may be in part because business models vary so dramatically in this industry. As a result, a fixed set of data that is relevant for all technology companies is much harder to identify than for, say, banks.
Despite such issues, our study highlighted technology companies’ strong commitment to making a positive societal impact. Perhaps their most compelling opportunity is to promote social and economic inclusion among marginalized and underserved groups. Given the wide variety of business models, the routes to achieving that can vary considerably.
Airbnb, for example, is helping to draw tourism dollars into neighborhoods that wouldn’t ordinarily attract visitors. In fact, about 74% of Airbnb listings are located outside the main hotel districts of the cities where the company operates. The company’s activities also provide economic benefits to hosts that need it: 62% of US Airbnb hosts say that hosting helped them pay their mortgages and hence stay in their homes.
Mastercard’s partnership with SASSA (South African Social Security Agency) is a prime example of how a technology platform can support societal inclusiveness.10 The partnership provides social security payments electronically through a biometrically authenticated card. The program not only increased financial inclusion in South Africa from 67% to 75% in the first year but also slashed government costs by $375 million over five years, strengthening the company’s government relations. At the same time, the program demonstrated the power of a business model that can be tailored to other markets.
Facebook, meanwhile, says that it is committed to ensuring that every person can participate in the global digital community, regardless of their location, socioeconomic status, or physical limitations. The company builds innovative tools to connect them, including Free Basics, which offers services via smartphones in countries where internet access may be prohibitively expensive for many people. The services, which include content on news, employment, health, and education are available for free without data charges through a partnership with local telecommunications companies. Free Basics has launched in more than 65 countries and provides more than 1,000 services worldwide. The company also built Facebook Lite, a version of Facebook for people with low-bandwidth internet. Today 200 million people around the world use Facebook Lite to connect.
Microsoft, for its part, is focused on a major inclusion issue in the US: internet access. The company recently announced its Rural Airband Initiative in support of bringing broadband access to 23 million people in the rural US. As part of that initiative, Microsoft proposed an ambitious goal for the nation: to eliminate the rural broadband gap by July 4, 2022. Microsoft believes that hitting this goal will require a mix of technologies, including fiber, fixed wireless, satellite, and TV white spaces (a technology that leverages unused spectrum in the UHF television bands). Microsoft will provide seed capital to companies that are deploying and developing TV white spaces technology with the aim of connecting 2 million rural Americans to broadband. The company will also contribute its relevant patent portfolio, free of charge, to organizations investing in and using the TV white spaces technology.
10. Mastercard is included here because its core business is digital payment technology.
Our analysis of all five industries reveals that some companies are embracing novel approaches to improving their societal impact. As further evidence emerges of the financial rewards of doing so, more companies are likely to find innovative ways drive societal progress.


