
When a grocery chain expands its international-foods section or a pet supplies store moves dog treats closer to the front door, it’s not by chance. Retailers are taking advantage of assets that their e-commerce competitors lack—physical space and the organization of products within that space—to enhance customers’ shopping experience and boost sales. And increasingly, they are using big data to do it.
At a time when customers can find almost anything they want online, brick-and-mortar stores must make it easier for shoppers to find the right products in the right place at the right time. Deeper, more powerful data analytics can help improve store design, floor plans, merchandise mix, and other elements of localization.
Retailers aren’t strangers to data. Stores have long relied on information from point of sale and other systems to optimize how products are merchandised, priced, and promoted. (See “Making Big Data Work: Retailing,” BCG article, June 2014.) While some existing retail systems can produce massive amounts of information, retailers lack the analytics necessary to adequately interpret it. Other stores have limited their use of big data to one-off projects, making it difficult to fold results into ongoing strategies.
To succeed, retailers must apply data analysis to more aspects of localization. They must use it more consistently and apply more sophisticated algorithms. Those algorithms should connect floor space, assortment, and product placement with loyalty, web browsing, and store heat map data. Whether retailers develop big data tools internally or buy off-the-shelf services, they must set up repeatable processes that can be managed effectively.
The results of these efforts could reshape every shelf and endcap—every inch of floor space—to attain maximum value. In our client work, we have seen wide-scale, data-based localization improve performance for a variety of retailers:
- A US specialty retailer’s localization strategy led to a 3% sales increase despite declining sales in the category nationwide.
- A localization pilot project led to a 4% sales increase at a US big box retailer, helping it recapture market share to gain on a key competitor.
- A decentralized general-merchandise retailer that used big data to create performance group clusters saw sales grow 3% to 4%, a key component of a successful turnaround.
Adopting a big data mindset for localization can be challenging. Therefore, a shift to data-based localization is best accomplished as part of a broader change strategy. Such a program should be managed by a cross-functional team of personnel from merchandising, planning, marketing, pricing, and store operations. Retailers should use localization analytics in agile-based sprint tests and other short-term projects before rolling out company-wide programs.
How Big Data Boosts Localization
For data-based localization to work, it must include everything a store sells—not just a retailer’s most visible products. A comprehensive strategy takes into account layout, how shelves are configured and stocked, seasonal items, and new brands or SKUs, among other elements. (See Exhibit 1.)
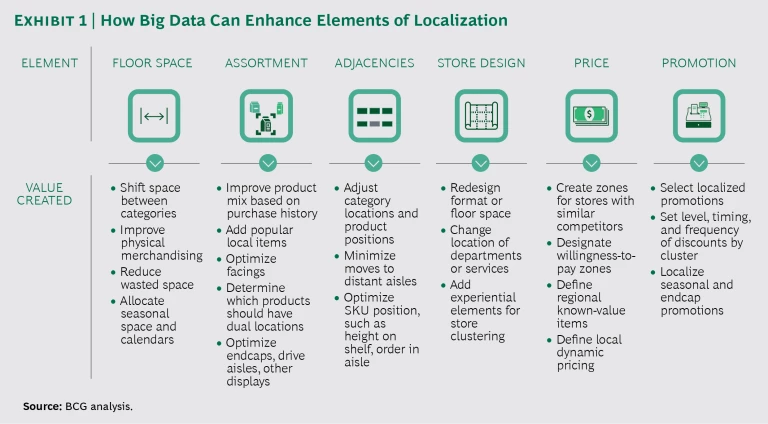
Here are the major elements of localization and the data analytics that retailers can use to improve them.
Floor Space. Retailers must decide how much room to dedicate to certain products or product categories, with an eye toward maximizing sales and yielding the highest possible margin per square foot. Typically floor space planning is based on historical sales data and sales forecasts. To optimize it further, retailers should evaluate marginal space economics, determining the difference in profit that one product category generates per square foot in a particular space compared with what another product category would generate in the same space. For example, a grocery chain determining how much space to dedicate to chicken must consider how adding space would affect sales and margins compared with adding more space for pork, lamb, or fish.
For data-based localization to work, it must include everything a store sells—not just a retailer’s most visible products.
When allocating floor space, retailers can use big data to evaluate transaction-level details and reveal hidden associations that can be capitalized on to boost sales. These details and associations include attachment sales, or additional products shoppers buy in the same category as their intended purchase, and future purchases that may come with a purchase in that category. Another hidden association that big data can reveal is allocated distribution costs, which aren’t visible until costs are allocated to the item at the store level.
To find the best allocation of floor space to maximize margins, retailers will need to use analytics to adjust sales data to account for differences in individual stores’ merchandise mix as well as for out-of-stock and seasonal items.
Assortment. The products a store stocks, along with the brands, styles, and varieties of each that appear on its shelves, make up its assortment, or merchandise mix. Retailers strive to create a merchandise mix with the maximum achievable long-term margins for each store they operate.
To optimize assortment, retailers can group locations that sell similar items into clusters using sales data aggregated by attributes such as brand, size, or flavor. Such clusters make it easier to recognize patterns across similar stores, leading to more accurate predictions of future sales at individual stores.
In addition, retailers can use customer transaction data to measure incrementality, or how much an item in the assortment increases sales and margins compared with a similar item. To again take chicken as an example, customer purchase data may show how offering packages of cut-up chicken contributes to overall chicken sales, and how dropping or offering more of such packages affects sales of other chicken products.
Adjacencies. Retailers typically make inventory and stocking decisions based on common data points such as enterprise-wide sales over time, individual store sales, cost of goods sold, and stocking costs. Analytics can help uncover less common data that can be just as valuable. One often underconsidered data point is the effect on sales of the relative distance between two items in a store, or what’s known as adjacency. Adjacencies data can be used to compare sales and cross-sales of product categories located next to one another, across from one another, or in the same aisle. Retailers can then boost sales and margins by shelving, say, two sets of goods with positive adjacencies next to one another, increasing sales of both.
Optimizing adjacencies across an entire store is complex. Retailers can start to mine adjacencies by using store-level data to find which item placements worked best in the past. That can help determine, for example, whether frozen pizza sells better when placed next to ice cream or to frozen vegetables, or if shelving hairspray next to hair brushes leads to more sales than displaying it with other hair care products. Studying data on adjacencies can also help retailers decide which item categories to allot to prime locations such as the front of the store and the drive aisle.
Additional Elements. Big data can help optimize other elements of localization, including store design, price, and promotion. Retailers can use quantitative customer experience segmentation to improve the way a retail space looks and feels by analyzing customer surveys to determine how different types of customers like to shop. Other data that can be used to improve store design includes loyalty behavioral evaluation, or what an existing customer does when a favorite item is out of stock; and prototype ROI evaluation, the impact of adding various in-store elements to an overall design.
To optimize prices, retailers can evaluate data that shows what local shoppers are willing to pay. For example, they can study the prices that local competitors charge for certain products, particularly known-value items, such as milk and bread, and use the information to set their own prices. Retailers also can evaluate data that reveals which types of local promotions worked best in the past to plan future promotions.
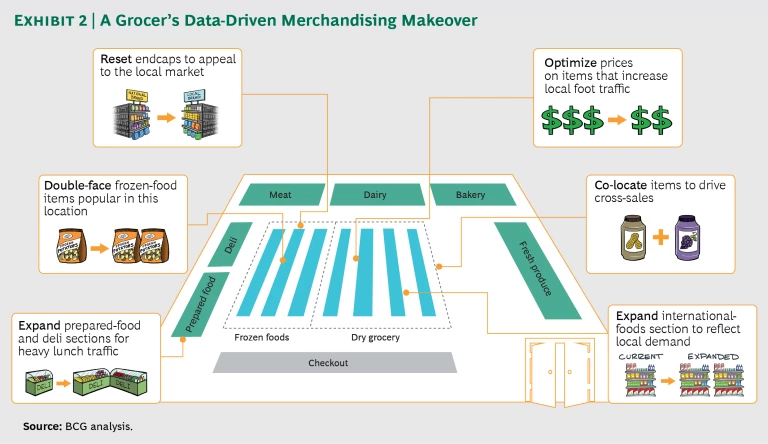
Applying big data to elements of localization can lead to multiple changes. For example, if marginal space productivity analysis showed a lunchtime pickup in foot traffic, a grocery store could expand its prepared-food and deli sections. (See Exhibit 2.) It could double-face items such as a popular size of frozen potatoes after analyzing sales uplift at other locations that added an extra facing of similar items. It could also expand its international-foods section to reflect local demand based on the popularity of existing assortment relative to other stores and customer demographics.
Building a Data-Based Localization Strategy
Despite the potential for benefits from a big data makeover, in our client work, we’ve found that many retailers don’t consistently collect the data needed to improve localization. At others, existing merchandising, pricing, or sales management systems aren’t capable of performing the sophisticated analysis required to uncover the information. To take full advantage of a big data-based localization strategy, retailers may need to adopt new systems that can be tailored to their specific requirements and circumstances. This may require working with an outside party that can help create a customized service. Whatever big data tools for product localization they choose must be relatively simple to integrate with existing systems.
Even so, incorporating big data into localization can be challenging. It takes more than using existing technology in new ways or integrating new analytics. First, it requires an organization-wide commitment to flexibility and openness to new approaches. Cross-functional teams of merchandising, planning, and pricing personnel together must work faster and more dynamically without adding complexity to the process. Organizations that aren’t already following these new, agile ways of working will need to consider how to train teams throughout the journey. (See “Taking Agile Way Beyond Software,” BCG article, July 2017.)
Incorporating big data into localization requires an organization-wide commitment to flexibility and openness to new approaches.
In our experience working with retail clients, organizations are most successful using big data to improve localization when they follow a few other guiding principles.
Do analytical sprints. Borrow from agile principles, including the use of minimum viable product tools, and adopt a rapid test-and-learn mentality. Pick a single use case for an analytics-based sprint project and evaluate how it works. Move to the next sprint following the same approach.
Incorporate analytics-based localization into the workflow. Teams must base merchandising decisions on data year-round, not just during annual top-to-bottom category resets. This gives category managers the added responsibility of ensuring that localization recommendation tools don’t make work more difficult for their teams.
Be consistent. While different arms of a retailer’s merchandising organization may use different data analytics tools or analyze different data to change different localization elements, the outcomes of their efforts should be integrated in a way that presents shoppers with a cohesive in-store experience, regardless of what they’re buying.
Combine multiple big data sets, including online sales. Analytics allow retailers to study multiple sets of data from multiple sources, giving them insights they couldn’t gain from a single data set. Large data sets may include website traffic and search terms, actions customers take when items are out of stock online, and frequency and contents of abandoned virtual shopping carts. Retailers can also use analytics to study data from physical-store sales, including information on returns, length of checkout lines, stockouts, and variations in assortment and sales by store or region.
Companies should also track online shopping activity to identify products popular with shoppers in a certain region, then stock more of those products in physical locations in that area.
Garbage in, garbage out still applies. Data-based decisions aren’t worth anything if the information used to make them isn’t correct. Before getting started, retailers may need to spend time looking for and fixing one-off problems. Even the cleanest data can’t provide perfect foresight, so big data must be used in conjunction with contingency plans for dealing with novel or unexpected situations.
Understand the tradeoffs between value and complexity. Analytics can deliver sophisticated solutions to complicated localization configurations, but often a simpler solution will be preferable to one that is too complex for personnel to easily implement. For example, localizing at the store level may provide more value but be harder to execute, whereas localizing a cluster of stores allows retailers to strike a reasonable balance and improve adherence in the field, which will increase realized value.
Spending is up in the US as median household incomes rise, but brick-and-mortar retailers continue to file for bankruptcy at a record pace, undone by changing times and the rise of Amazon and other technology-savvy e-commerce rivals. In a competitive environment that’s squeezing retailers’ margins, they in turn need to squeeze as much as possible out of every square inch of physical space. One way to do that is using big data to gain a deeper understanding of customer preferences and shopping habits, information that will help optimize floor space, product mix, and other elements of localization. But adopting improved analytics and the technology to run it is only half the battle. For stores that aren’t accustomed to basing decisions on data, the change can involve a significant culture shift. For retailers to succeed, personnel from various product-related departments will have to work together more closely and at a sprint pace. That’s a winning combination that will help keep customers coming back for more.


