


The first quarter of 2022 saw the end of a bull market that lasted, with only brief interruptions, for more than a decade. BCG’s 2022 Value Creators rankings highlight the contrast between the record-high valuations and market levels reached in 2021 and the declines that most sectors and companies experienced since the start of
To deliver strong and resilient value creation going forward, companies must navigate today’s highly volatile and uncertain environment while remaining focused on middle- to long-term advantage. But doing so will not be easy. Companies face a minefield of challenges—including soaring inflation, rising interest rates, and a looming recession—that demand action but constrain flexibility. Geopolitical risk is at its highest level in decades, and the potential longer-term impact of the war in Ukraine extends well beyond materials prices and supply chains. To succeed, companies must understand their risk exposures comprehensively, manage them effectively, and prioritize the right longer-term investments.
For the past 24 years, BCG has been ranking companies on the basis of TSR, a metric that reflects the true bottom line for a company’s shareholders. Over the years, these rankings have yielded tangible insights that help companies create strong and sustainable value over the long term. The 2022 Value Creators rankings detailed in the linked interactive are based on data as of December 31, 2021, and reflect average annual TSR over the five years from 2017 through 2021.
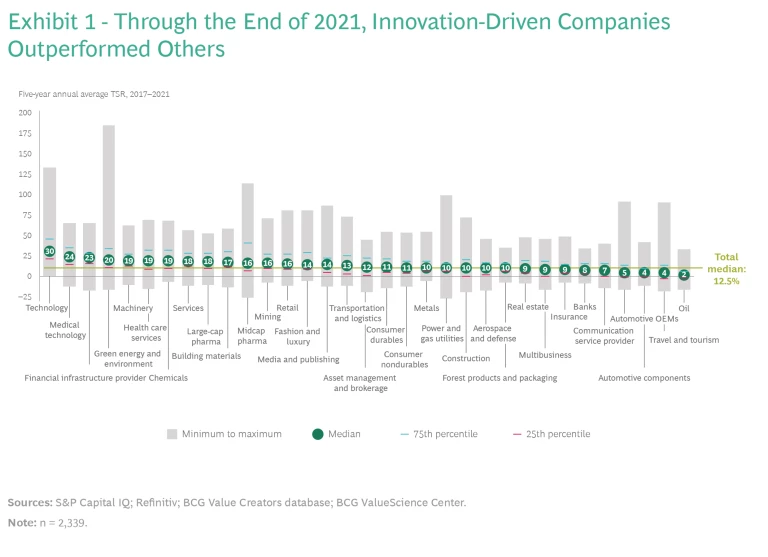
Even as the impact of COVID-19 persisted in 2021, the strong capital market performance that was characteristic of the era since the Global Financial Crisis continued. Indeed, in our sample of approximately 2,350 companies, the average annual TSR for 2017 through 2021 was 12.5%, up from 10.3% for the five years from 2016 through 2020.
Technology and other innovation-driven sectors (such as medical technology, financial infrastructure, and green energy) outperformed all other industries in average annual TSR for the period 2017 through 2021, and they dominate the overall top 10 ranking. (See Exhibit 1.) Oil, travel and tourism, and automotive (original equipment manufacturers and suppliers) were the most severely challenged industries in terms of value creation. Nonetheless, the broad range of TSR performance within each industry—significantly wider than the range across industry averages—shows that companies have the opportunity to outperform their rivals, regardless of their sector.
Top performers globally and by industry were predominantly from North America and Asia-Pacific. European companies recovered some ground compared with last year and are now proportionately represented in industry top 10 rankings.
However, circumstances have changed dramatically since the start of 2022. Through mid-April, global markets have corrected year-to-date by more than 15%. The correction was initially fueled by a rotation from growth to value stocks and by recognition that high inflation would persist longer than many investors had anticipated. The downward momentum accelerated after Russia invaded Ukraine. But industries and countries have not been affected equally.
From an industry perspective, technology has experienced the most substantial fall. Through mid-April 2022, the tech industry’s year-to-date median TSR was negative 20%, compared with an annualized TSR of 30% from 2017 through 2021. (See Exhibit 2.) Investors’ shift from growth to value stocks is largely responsible for the decline. This industry also experienced the largest absolute drop in value, reflecting the tremendous size of many large-cap tech companies. Even so, the tech industry’s year-to-date median TSR has been in line with that of other hard-hit industries, such as automotive suppliers and fashion and luxury. Overall, tech has outperformed all other industries since the start of 2017, with $100 invested on December 31, 2016, now worth $316 (down from $377 at the end of 2021).
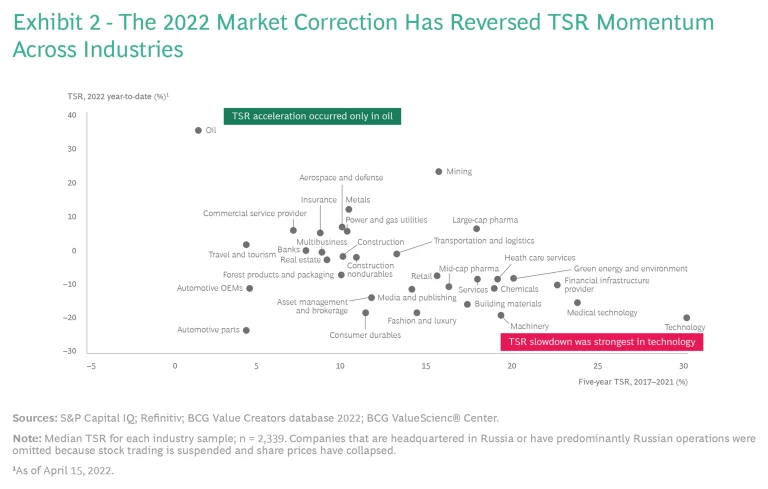
The TSR reversal has also been substantial for medical technology, financial infrastructure, and green energy. Year-to-date median TSRs in these industries are negative 10% to negative 15%, compared with annualized TSRs that exceeded 20% for 2017 through 2021.The drop-off in TSR has been less extreme in industries that have traditionally been more resilient, such as large-cap pharma, utilities, and communication service providers.
At the other end of the spectrum, year-to-date median TSR for oil, mining, and other materials industries has exceeded those sectors’ five-year average for 2017 through 2021. Shortages caused by the war in Ukraine have pushed prices higher for many raw materials. In addition, investors regard these industries as natural hedges against inflation.
From a country perspective, US companies experienced the most substantial TSR reversal in 2022 year-to-date relative to their momentum from 2017 though 2021. This reflects the importance of technology and other hard-hit industries such as automotive suppliers and fashion and luxury. In contrast, TSR accelerated for companies in some emerging markets, including Brazil, Malaysia, and Singapore.
Looking ahead, companies need to protect short-term fundamental performance and navigate the volatile environment while continuing to invest in long-term growth opportunities. In the shorter term, winners will distinguish themselves by their preparedness for and resilience to macroeconomic headwinds, inflation, and other uncertainties. Even after the recent correction, markets still exceed pre-pandemic highs in index levels and valuations—so it is not clear whether we have seen the worst of the pullback yet.
Over the longer term, the right balance between pursuing growth and profitability will be essential, as will be making the right investments in competitive advantage, innovation, and portfolio optimization. First and foremost, successful value creators must underpin their growth aspirations with viable business models and attractive economics. In evaluating investments, companies should be mindful that opportunities for value creation often exist in times of crisis—for example, M&A deals made during downturns tend to outperform those made during bull markets.
Importantly, each company should optimize its performance for the short and longer terms jointly, rather than as separate efforts. This requires a combined fact base that includes knowledge of investors’ focus areas in a sector and a practical understanding of risk factors and how they will affect the company’s business in different scenarios.
Companies can apply these insights to prepare for short-term disruptions and to refine their longer-term strategy and investments. In doing so, they must recognize that the future will look very different than the past decade. One key difference is the much more important role that sustainability will play in promoting competitive advantage and value creation. A sound sustainability strategy will be essential to maintain investors’ trust in a company’s ability to justify valuations.
Methodology
We further refined the sample by organizing the remaining companies into 33 industry groups and by establishing an appropriate market-capitalization hurdle to eliminate the smallest companies in each group. (We identify the size of the hurdle for each industry in the interactive.)
Our global large-cap ranking in the interactive focuses on the top 50 companies among the 200 largest companies by market capitalization. We base the global and industry rankings on five-year average TSR performance for the individual companies, from 2017 through 2021.
In addition, for all but four of the industry rankings, we divide TSR performance into the six investor-oriented financial metrics that BCG’s TSR disaggregation model uses: sales growth, margin change, multiple change (EBITDA), dividend yield, change in the number of shares outstanding, and change in net debt.
For four industries—asset management and brokerage, banking, insurance, and real estate—we use a slightly different approach to TSR disaggregation because of the special analytical problems involved in measuring value creation in those sectors. For asset management and brokerage and for real estate, equity growth replaces sales growth, ROE change replaces margin change, and the P/E multiple replaces the EBITDA multiple. Change in net debt is not shown. For banking and for insurance, equity growth replaces sales growth, and the price-to-book multiple replaces the EBITDA multiple. Margin change and change in net debt are not shown.
This interactive reflects the rankings of companies in our 2022 database and does not include companies that dropped off the list prior to 2022 as a result of mergers, bankruptcies, or other events. For that reason, the rankings from previous Value Creators reports may be slightly different.
Sources: S&P Capital IQ; Refinitiv; BCG ValueScience Center.
Note: Market capitalization of equity is shown as of December 31, 2021. The location shown is of the corporate headquarters. The contribution of each factor in the TSR disaggregation to the five-year average TSR is shown in percentage points. Dividend yield may include cash dividends, special dividends, proceeds from spinoffs, other extraordinary payouts and adjustments for share splits, issuance of bonus shares, or other one-off events. Although disaggregation is multiplicative, it is converted and shown here as additive, with remainders assigned to the margin and multiple change fields. Because of rounding, the numbers may not add up to the TSR figure shown. Share change refers to the change in the number of shares outstanding, not to the change in share price. Net debt change refers to the change in market capitalization relative to the change in enterprise value, and it includes the change in debt and cash.
Disclaimer: The materials contained in this interactive are designed for information purposes only. BCG does not provide fairness opinions or valuations of market transactions, and these materials should not be relied on or construed as such. A company’s inclusion in the ranking does not represent an endorsement by BCG. This interactive does not provide investment or financial advice. Users should contact their advisor to receive such advice.
BCG has used publicly available data. BCG has not independently verified the data and assumptions used in these analyses. BCG has made no undertaking to update these materials after the date they were gathered for publication, after which such information may become outdated or inaccurate. Changes in the underlying data or operating assumptions will have an impact on the analyses and conclusions. The underlying model used for this interactive is designed to work across industries and is no replacement for a detailed calculation that accommodates company- or industry-specific adjustments, which may have an impact on the accuracy of the results.


