Like just about every business, a SaaS company’s key to success is maintaining the proper balance between profitability and growth. Focusing too much on boosting profit margins can lead companies to starve sales and marketing departments of the resources they need to retain current customers and attract new ones. Concentrating too much on growth can cause companies to overspend without a clear path to profitability.
That’s the dilemma management teams face when running a B2B SaaS company and an issue that investors look for when they consider investing.
SaaS companies have been especially attractive to private equity (PE) firms, given their high-growth prospects; at present, software makes up more than two-thirds of all PE investments in the technology space, according to Pitchbook. However, the past couple of years have been challenging for many PE-backed SaaS companies. Many customers, both current and potential, have been looking to streamline and cut costs, so new-customer expansion and growth has proved more difficult than it has been in previous years.
To enable PE investors and management teams to gain insights into SaaS companies’ performance and what holds them back, BCG collaborated with seven growth equity funds, initiated by Susquehanna Growth Equity, on an in-depth benchmarking analysis of a wide variety of SaaS companies held in their portfolios.
To identify the top-performing SaaS companies, we began with the critical Rule of 40. The great virtue of the rule is its simplicity: a company is considered financially strong if the sum of its annual revenue growth and EBITDA margin equals or exceeds 40%.
But what drives Rule of 40 outperformance? Generally speaking, there is no single metric that explains why some companies successfully balance revenue growth and sales efficiency—and how those that fall below 40% can most effectively improve their results.
Clearly, companies need to reach some level of scale before the growth and profitability tradeoff can be appropriately managed. Larger SaaS companies are considerably more likely than smaller ones to achieve Rule of 40 performance. More than a quarter of companies (26%) with more than $80 million in revenue beat the Rule of 40, compared with 22% of companies with $30 million to $80 million in revenue, and only 9% of companies with less than $30 million in revenue. (See “The Methodology and Demographics.”)
The Methodology and Demographics
BCG partnered with a select group of private equity firms—a collaboration initiated by Susquehanna Growth Equity and including Brighton Park Capital, FTV Capital, JMI Equity, and TCV—that invest in B2B SaaS companies to better understand the performance of their portfolio companies and the value they create. We conducted an in-depth benchmarking analysis of 107 participating portfolio companies. (See the exhibit.) The benchmarking allowed us to track a set of detailed metrics covering financial performance, go-to-market information, costs, and R&D expenses.
We will be running another benchmarking initiative. Participation costs nothing for sponsors and their portfolio companies. Participants receive a detailed benchmarking dashboard, comparing their results with top performers and tailored segments in the overall benchmarking sample on a select set of metrics. Please reach out to TechCapitalBenchmarks@bcg.com if your company is interested in participating. Note that the benchmarking effort is limited to privately held software companies.
Still, the top companies, no matter how big, were able to achieve better performance across many different facets of the business.
By analyzing a variety of related performance metrics and understanding what differentiates the top-performing SaaS companies, we were able to pinpoint a set of clear and actionable performance metrics that have the greatest impact on the ability of SaaS companies to grow efficiently. These results also enable us to suggest several key steps that every SaaS company should take to optimize the balance between growth and profitability.
The Winning Formula
The key to finding companies that are well-positioned to meet or exceed Rule of 40 performance lies at the intersection of two critical metrics:
- Gross revenue retention (GRR), which is the percentage of recurring revenue retained from existing customers, excluding revenue from upselling or cross-selling. It serves as a baseline for understanding customer loyalty and usage patterns. (See “Glossary.”)
- Annual contract value (ACV) for new customers, which is the annualized revenue from new subscription customers.
Glossary
Annual contract value. ACV represents the annualized revenue from a subscription customer. It simplifies forecasting and revenue comparisons, aiding in understanding customer value over time. While we captured both new-customer and upsell ACV, in this report new-customer ACV refers to ACV at the time of customer acquisition.
Annual recurring revenue. ARR is a key financial metric used by subscription-based businesses to measure the predictable and recurring revenue generated in a year from subscriptions, excluding one-time payments, setup fees, and nonrecurring revenue sources.
Customer acquisition cost. CAC calculates the cost of acquiring a new customer, including marketing and sales expenses. It’s critical for assessing the efficiency of growth investments.
Customer success. This business function focuses on ensuring that customers achieve their desired outcomes while using a company’s product or service, which ultimately drives retention, expansion, and long-term value.
Gross margin-adjusted CAC ratio. This ratio divides lifetime value (LTV) by CAC, adjusted for gross margin, to evaluate the profitability of acquiring customers. It ensures growth is sustainable and generates value.
Gross revenue retention. GRR is the percentage of recurring revenue retained from existing customers, excluding upselling and cross-selling. It is an indicator of customer loyalty and the stability of revenue streams.
Gross revenue retention to net revenue retention. The gross-to-net ratio compares GRR to NRR, revealing how much of a company’s revenue growth relies on upselling versus retention. It informs strategies for improving core customer value.
Horizontal and vertical software platforms. Horizontal platforms serve broad markets across industries, while vertical platforms specialize in a niche industry. Understanding the focus helps investors gauge if a company is scalable and its market potential.
Ideal customer profile. An ICP outlines the characteristics of a company’s most valuable customers. It helps marketing and sales focus resources on high-potential leads, thereby optimizing the teams’ efforts.
Lifetime value. LTV estimates the total revenue a customer will generate during their lifetime with the company. It informs strategies for customer retention and long-term profitability.
Net magic number. The net magic number assesses sales efficiency by comparing revenue growth with sales and marketing expenses. A ratio above one indicates efficient growth, helping investors evaluate the potential for scaling a business.
Net revenue retention. NRR measures the percentage of recurring revenue retained from existing customers after accounting for upgrades, downgrades, and churn. A high NRR indicates strong customer retention and the potential for long-term growth.
On-target earnings. OTE is the total compensation an employee, usually in sales, can earn if they meet performance goals. Offering incentive compensation is critical for motivating and retaining top talent.
Research and development index. RDI is a metric that evaluates R&D effectiveness by dividing the year-over-year change in revenue by the R&D expenditure as a percentage of revenue from the previous year, with higher RDI scores correlating to increased total shareholder returns.
Rule of 40. The Rule of 40 is a metric for evaluating the health of a SaaS company, calculated as the sum of revenue growth rate and EBITDA margin. Generally, companies aim for a result that is above 40%.
Total addressable market. TAM represents the maximum revenue opportunity available for a product or service in a market. It is foundational for sizing investment potential and growth opportunities.
Companies with both a high GRR and low new-customer ACV tend to have stronger Rule of 40 performance, while those with a low GRR and a high new-customer ACV tend to struggle. (See Exhibit 1.) Of course, while GRR can be optimized over the long run by better churn management and by focusing on stickier product segments, ACV is generally harder to manage. Thus, it’s critical to have a good understanding of the issues that affect underlying customer retention when you’re operating or investing in spaces that typically have a high ACV.
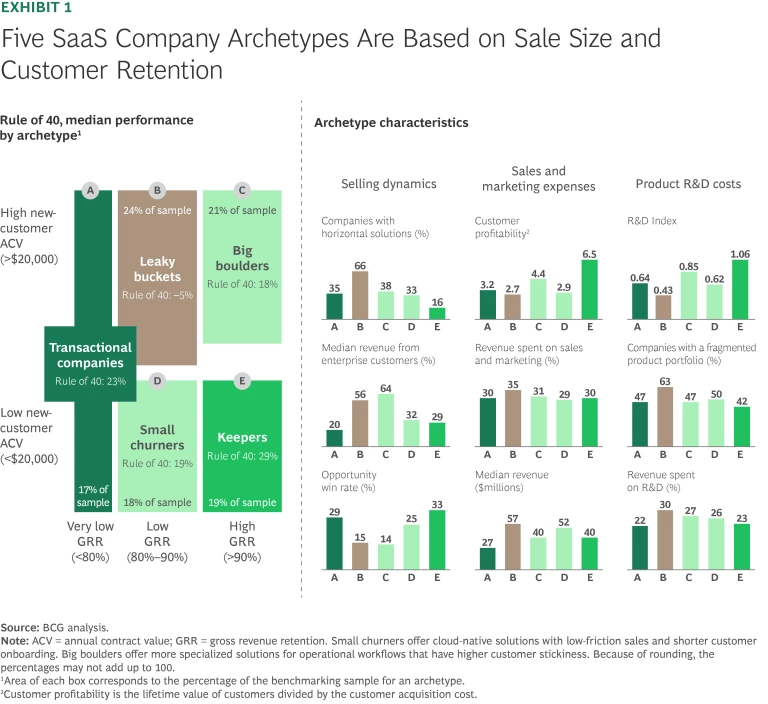
Specifically, GRR reflects how much recurring revenue from existing customers a company retained in the following year—and is thus the inverse of churn. ACV is a measure of the size of the sale; a higher ACV generally indicates a “weightier” software sale—one with longer sales cycles and more enterprise-level customers. In general, companies with lower ACVs typically have shorter, simpler paths to selling new customers, while those with higher GRR find that keeping those customers is easier.
The sweet spot? Companies that can do both. We call them the keepers, due to their ability to keep customers that they have an easier time acquiring. We think this is partly a function of the segment of the market they operate in. These companies tend to offer software aimed at specific industry verticals, so their competition tends to be limited to other similarly specialized software providers. This results in more efficient go-to-market (GTM) efforts and a high win rate. They also focus more on small and midsize businesses and less on enterprise customers, giving them more selling opportunities and a simpler new-customer selling process.
Surprisingly, some very low GRR businesses—those that retain less than 80% of their revenue each year—had the second-highest level Rule of 40 performance: 23%, on average. We call these transactional companies, and they typically operate in high-velocity spaces (those with shorter sales cycles) or where the sales team can efficiently generate a lot of new customers. Transactional companies focus on small-to-midsize businesses and SaaS-native products such as solutions for restaurants or field service teams. Thanks to a typically high win rate, these companies can make up for their relatively high degree of churn—an exception to the rule that a high GRR is necessary for Rule of 40 overperformance. Of course, most of these companies also have a relatively low ACV—about 80% have an ACV of less than $18,000.
The companies that are most challenged to achieve Rule of 40 performance are those that we call the leaky buckets, which have relatively low GRR and a high ACV. These companies typically sell more horizontal software platforms and have enterprise-level customers. Notably, scale does not explain these companies’ Rule of 40 underperformance—at $57 million, leaky buckets had the highest median revenue in our benchmark, compared with $40 million for the keepers, for example.
Leaky buckets tend to have several characteristics in common:
- More complex selling dynamics due to increased competition and buyers’ demands in the enterprise and horizontal spaces. As a result, these businesses have some of the lowest overall customer win rates. As an aside, high GRR can also have positive knock-on effects on new sales due to the potential for positive referrals from existing customers; we think this is one factor driving better win rates for keepers.
- High sales and marketing expenses as a percentage of revenue and mediocre per customer profitability. The latter is measured by the lifetime value (LTV) of customers divided by the customer acquisition cost (CAC). While these companies are capturing significant revenue through their high ACV per customer, their overall LTV is eroded because they can’t retain customers, as evidenced by their low GRR.
- High product R&D costs needed to support the complexity of the underlying product platform. These companies are developing more complex product portfolios, leading to higher R&D costs and lower return on their R&D investments. (See the sidebar “Measuring Returns on R&D Investments.”)
Measuring Returns on R&D Investments
The R&D Index (RDI) metric assesses the effectiveness of a SaaS company’s R&D investments by calculating the ratio of its organic revenue growth to R&D spending as a percentage of revenue from the previous year. A higher RDI score indicates that a company is deriving significant growth and value from its R&D expenditure. A company with year-over-year organic growth of 25% and with R&D spending as a percentage of the previous year’s revenue of 27% would have an RDI of 0.93.
The RDI is important because it quantifies the link between R&D investments and financial performance, revealing which companies are effectively leveraging their R&D efforts for sustainable growth. And it provides a way to benchmark companies within the same industry and helps organizations align their innovation strategies with tangible business outcomes.
A further reason that leaky buckets may be struggling to exceed Rule of 40 performance is because they have strayed outside their core ideal customer profile. A common symptom of this type of strategic drift is developing an expansive product portfolio without a clear strategic fit; in fact, this archetype has the highest percentage of companies with moderate-to-high product fragmentation across their portfolio.
By breaking down why some SaaS companies outperform and others do not, this framework can provide a helpful starting point for understanding some of the inherent advantages and disadvantages that many companies face. It is critical to remember, however, that none of these metrics are necessarily predictive of any particular company’s destiny. Rather, they indicate areas in the broader landscape of software business models that may be relatively more challenged and how to restore them to health. (See the appendix.)
Stay ahead with BCG insights on principal investors and private equity
Taking Action
Our analysis can help companies understand those areas that drive their relative Rule of 40 performance. The reality, however, is that some companies have a harder path to boosting their performance than others. Still, every company has the potential to improve, regardless of where it sits in our framework. How best-in-class companies in our benchmark outperform suggests four imperatives: manage retention, maintain strategic focus, maximize returns from R&D, and scale GTM efforts thoughtfully.
Manage Retention
As we have seen, improving GRR by reducing churn can have an especially meaningful impact on overall performance. GRR, however, can be a challenging metric to improve; more than half (54%) of the companies in the benchmark program had a GRR that was within 2 percentage points of their prior year’s GRR.
Still, there are several steps companies can take to improve customer retention and boost GRR.
- Understand the root causes of churn. Determine why customers don’t renew their subscription. Reasons could include overly complex products, poor customer support, and sudden increases in pricing. Then categorize the reasons and share throughout the organization as the first step toward addressing them.
- Clarify accountability for renewals. Rather than leaving the responsibility for reducing churn with the sales or customer success teams, consider creating a dedicated and properly incentivized renewals team. Provide it with the authority to manage the relationship with the customer, including onboarding users and solving problems. Companies in our benchmark program that have a renewals team with account managers (responsible for upselling and account growth) and customer success managers (responsible for renewals) had a median GRR that was 4 percentage points higher than those without.
- Standardize renewal processes and cadence. Ensure that customers can renew their subscriptions in a uniform and timely fashion. It’s particularly important to engage sales, renewals, finance, and customer success teams. This enables customers to engage in a consistent way with the multiple teams involved in effectively generating renewals.
- Consider developing an early-warning system to avoid churn. Evaluate the use of AI and machine learning models to generate alerts and populate dashboards with the data needed to give sales and renewals teams the advanced notice and information they need to successfully retain customers.
- Focus on time-to-value and value-realization plans. Understand the specific steps to take to ensure customer adoption, onboarding, and usage. In concert, develop specific ways to communicate the product’s value to business decision makers and buyers.
- Develop a codified renewal playbook. Create a clear best-practice guide for customer retention that details next-best actions, pricing alternatives, and other steps that the sales team can take to address a subscriber’s issues and reduce churn.
Maintain Strategic Focus
Expanding the set of products that a company offers and moving into adjacent markets in pursuit of a larger total addressable market (TAM) can be a key value-creation lever. But the bottom line is that expansion is hard, especially for younger companies. They often pursue adjacent software categories and customer bases inefficiently, resulting in high levels of product complexity and fragmentation. For example, efforts by earlier-stage SaaS companies to adopt a platform approach can result in an R&D organization developing an excessively fragmented product lineup instead of efficiently driving growth within the existing product-market fit. This can significantly harm overall performance, especially when combined with a relatively immature GTM organization.
Another reason that companies may struggle to meet the Rule of 40 is because they have strayed outside of their ideal customer profile (ICP) and tried to expand outside of their core solution set too soon. We scored each company in our benchmark on the degree of fragmentation in their product strategy and lineup. (See “Assessing Product Fragmentation.”) The result: companies in the leaky-bucket archetype were the most likely to have significant product fragmentation.
Assessing Product Fragmentation
Using a browser-enabled large language model and data publicly available on the web, we estimated product fragmentation by considering eight key characteristics. Then we determined a company’s product fragmentation score on a scale of one to five.
- Distinct Customer Segments. Does the company serve a wide range of distinctly different customer bases (such as small businesses, enterprises, governments, or different industries) with little overlap in their needs?
- Divergent Use Cases. Does the company offer multiple products that solve very different problems or serve fundamentally different use cases, with little apparent integration between them?
- Minimal Product Integration or Narrow Ecosystem. Are the company’s products poorly integrated, with few indications that they work together as part of a broader, unified platform or ecosystem?
- Inconsistent Product Positioning or Branding. Does the company position and brand its products separately, indicating a lack of a cohesive platform strategy?
- Disparate Pricing Models or Licensing. Are the pricing models or licensing terms for the company’s products significantly different, with little effort to unify or offer bundled pricing?
- Acquisition History and Strategy. Has the company’s acquisition strategy resulted in a collection of loosely related products that have not been fully integrated into a single platform?
- Customer Testimonials or Case Study Diversity. Do customer testimonials or case studies highlight vastly different use cases or industries, with little overlap in how customers use the products?
- Fragmented Product Support and Documentation. Does the company offer separate support channels, documentation, or user communities for different products, rather than a unified support experience?
Expanding too quickly beyond a company’s ICP can also impact customer retention and increase significantly the cost of acquiring customers if the product is not well-aligned to the customer. We suspect this is one of the underlying reasons why leaky-bucket companies have the lowest median net magic number and the lowest net revenue retention (NRR) among the nontransactional businesses. Leaky-bucket companies also spent the most both on sales and on R&D as a percentage of revenue, most likely because of a disconnect between their product roadmap and the GTM function.
Of course, company leaders may argue that a move into adjacent categories is necessary to drive growth. Companies are understandably eager to have a broad set of products that they can sell into their market; they are also looking for a large TAM to highlight to prospective investors. In our experience, however, such efforts are often misguided: many companies should place more importance on understanding their ICP, the drivers of differentiation within their ICP, and the true resulting TAM before they make the decision to expand into adjacent spaces. Some companies still have many years of growth remaining in their core markets, and the distraction of moving into adjacent markets can inhibit that when they are not yet at the scale needed to take on the complexity of expansions.
Maximize Returns from R&D
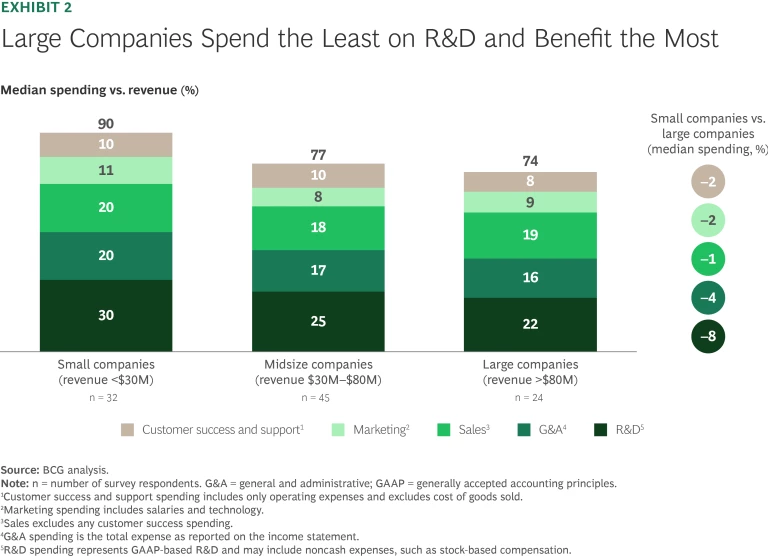
To drive value creation in SaaS companies, it is crucial to run an efficient R&D function. R&D investments have the highest potential for being scaled up in a software organization, allowing companies to take advantage of the fundamental “write once, sell everywhere” economics of software. That’s why the median spending on R&D as a percentage of revenue at the largest companies in our benchmark was 8 percentage points lower than at the smallest. (See Exhibit 2.)
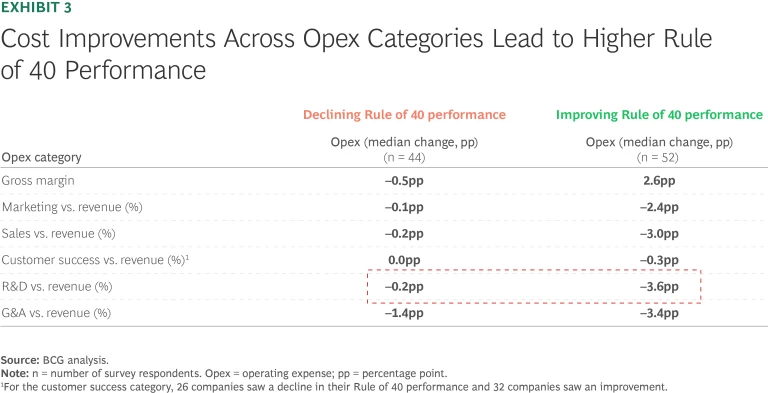
Moreover, companies that excelled in improving their Rule of 40 performance from 2022 through 2023 often did so by optimizing R&D expenditures relative to revenue—this was the cost category with the largest percentage point decline over the period. (See Exhibit 3.)
As companies grow, there are two steps they can take to optimize R&D spending as a percentage of revenue:
Offshoring R&D. Offshoring can significantly reduce R&D costs. In our benchmarks, R&D expenses as a percentage of revenue at companies offshoring more than 30% of their overall R&D spending were 2 to 3 percentage points lower than at their similarly sized peers.
However, we also found that the type of development being offshored matters. Keeping new-product development onshore, where teams are closer to sales teams and end customers, helps foster better overall product development. Companies performing a high degree of new-product development while also offshoring a significant portion of their R&D spending had research and development index (RDI) levels that were 50% lower than other companies in the benchmark, suggesting that the proximity to the GTM organization is vital during such initiatives.
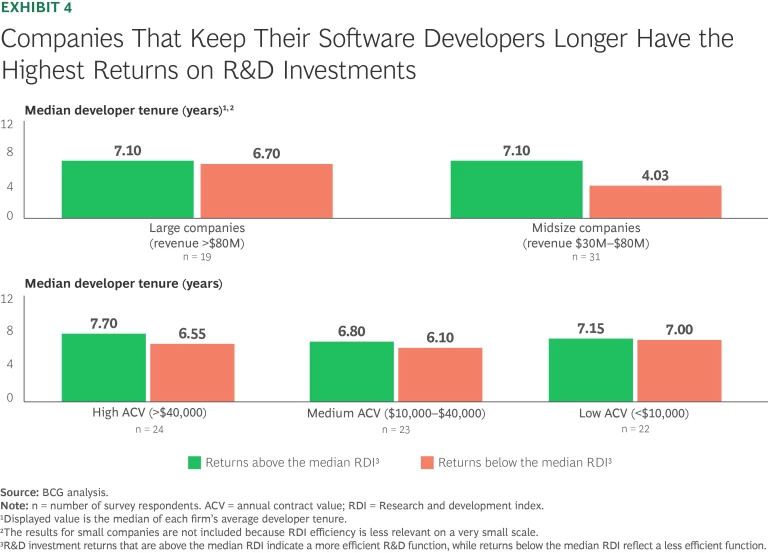
- Retaining Developers. Tenure matters: growth-stage companies with a longer-tenured developer workforce tended to outperform on the RDI, indicating that retaining skilled developers pays dividends. Across every revenue and ACV segment, companies that outperformed on the RDI tended to have a longer-tenured developer team. (See Exhibit 4.)
Scale GTM Efforts Thoughtfully
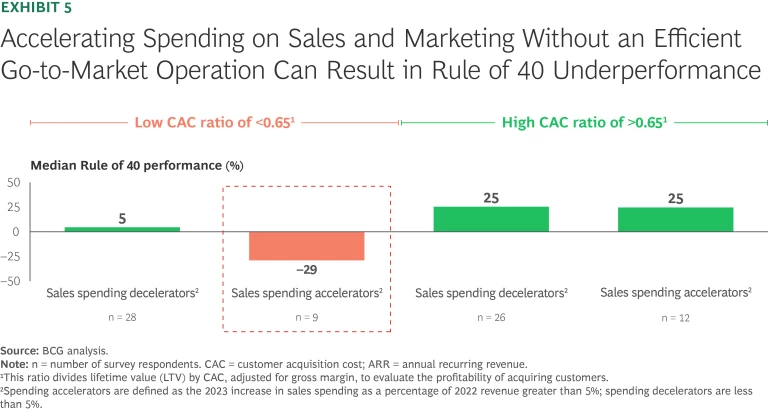
Scaling a GTM strategy requires careful consideration. Many companies attempt to grow simply by adding more salespeople, but scaling the team without an efficient sales strategy in place can amplify existing problems rather than solve them. We found that benchmarked companies that significantly increased their spending on sales and marketing as a percentage of revenue when they had an inefficient GTM operation saw significantly lower Rule of 40 performance. (See Exhibit 5.) In fact, this is the only group in our sample with a negative Rule of 40 performance overall. Instead, companies should scale their GTM functions carefully.
Understand your GTM bottlenecks. One dynamic that could be driving poor GTM efficiency is a mistaken belief that simply adding demand converters—sales reps who convert quality leads into actual sales—will in and of itself lead to top-line growth. In fact, as companies scale their GTM function, they need to focus on their true bottleneck, which could be poor demand generation through top-of-funnel marketing and pipeline development. In other words, make sure that sales is not the bottleneck before investing significantly in expanding the sales team.
Sales talent strategy matters. A strong talent strategy is equally crucial. An experienced sales team provides real value: in our benchmark, sales teams with greater tenure increased sales efficiency, if modestly. Keeping sales talent over time lets them develop their knowledge of the underlying product portfolio and the customer base. Companies whose account executives have a median tenure of two years or fewer had a median net magic number of 0.51, compared with 0.55 for those with three years’ tenure or more. Retaining sales talent extends to other roles in the GTM organization as well: by providing a viable talent pathway for sales and business development reps to transition into account executive roles, companies can enhance both retention and engagement across the organization.
At the same time, we also found that the median net magic number for the few companies in the benchmark where average account executive tenure was more than four years was actually lower than for other cohorts. There is a sweet spot for account executive tenure and value in refreshing the sales staff to maintain a competitive, winning sales culture.
Align sales incentives. To build an efficient sales organization, sales teams must be set up for success. Effective incentives play a key role here. According to the benchmark, organizations that set sales quotas at four to six times their account executive’s on-target earnings—the total compensation salespeople can earn if they meet performance goals—have better net magic number sales-efficiency metrics than those setting sales quotas both above and below this range. And companies where more than 50% of account executives achieve their quotas see better results. That’s why is it critical to set aggressive but attainable goals and to encourage sales teams to stretch to reach them—while also rewarding sales talent and driving overall employee retention, a key factor in creating an effective talent strategy.
And it’s not just about quota levels; equitable assignments also matter. Sales teams are more productive when territories and market segments are well-balanced and everyone on the team has a fair shot at achieving their sales goals.
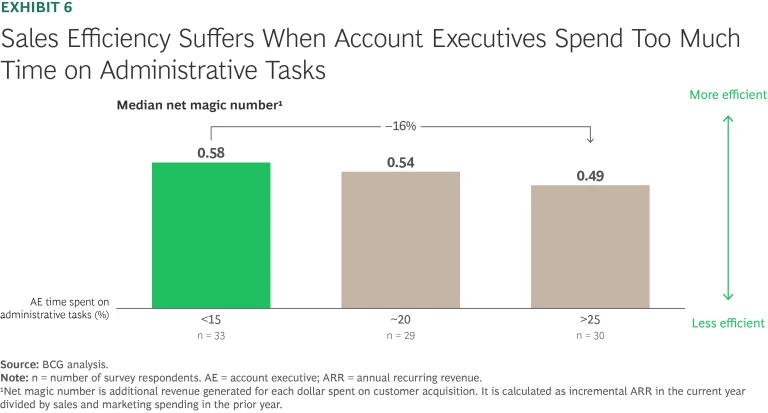
Reduce administrative burdens. Reducing administrative burdens for sales teams can also significantly improve performance. Account executives at top-performing sales organizations spend less than 15% of their time on administrative tasks. (See Exhibit 6.) And it’s not just the time spent; it’s also important to understand why account executives are investing time in nonsales activities—whether it’s because of a lack of sales opportunities, insufficient tools, or organizational inertia—and to address these issues accordingly.
Leverage the right set of selling tools. Finally, reducing churn and reaching the top quartile for NRR requires having the right data infrastructure in place. (See Exhibit 7.)
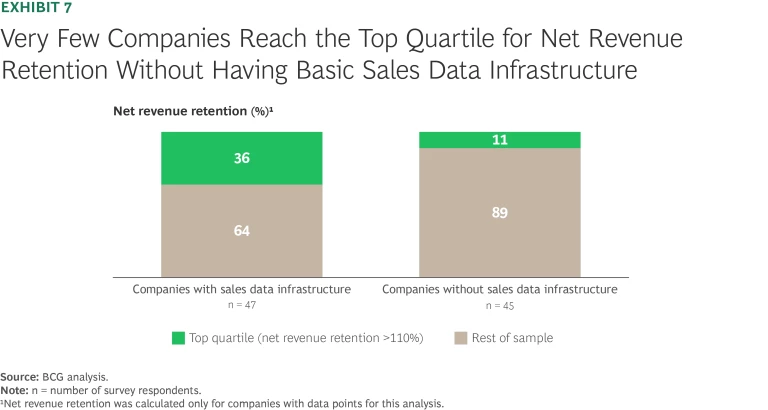
In fact, just five companies in the sample achieved top-quartile NRR without all of the following:
- A single “source of truth” for customer and pipeline data
- A single customer relationship management (CRM) system that’s used by all salespeople
- Forecasting carried out using a CRM system or a dedicated sales forecasting tool, instead of Microsoft Excel spreadsheets or personal files
While these requirements can help identify potential red flags in the overall use of sales data, they should be considered table stakes for an efficient sales and marketing operation. For example, more-sophisticated organizations are beginning to apply artificial intelligence, generative AI agents, and machine learning to prioritize offers, identify and segment customers more efficiently, and drive meaningful improvements in upselling and cross-selling customers.
It is increasingly clear to software leaders and investors alike that SaaS companies need to strike a delicate balance between pursuing growth and profitability. For many companies, this requires flexing a new set of muscles, and it can be overwhelming trying to navigate where to cut and where to invest. While the right answer will vary for each company, our benchmark results provide clear and powerful signals for company leaders on how to get the most bang for their value-creation buck.


